Introduction
While placental growth as represented by placental weight (PW) and its derivatives has been linked to child and adult health,Reference Campbell, Hall and Barker1–Reference Salafia, Maas and Thorp5 PW is only a simple summary of multiple placental dimensions. Novel measures (Materials and methods) of placental growth have been developed that either measure more precisely and reliably than current methods or measure aspects of the placenta that have never before been quantified. These measures may shed light on the mechanisms linking placental growth to diseases with their onset in childhood and adulthood. The role of the placenta in ‘fetal programming’ deserves a detailed and thorough evaluation, given the public health ramifications of adult diseases originating in failure of the placenta to optimally and efficiently meet fetal needs.Reference Godfrey6 To date, previous studies have rarely utilized measures other than PW and the PW–BW (birth weight) ratio (or its inverse, the fetoplacental weight ratio) to understand how child and adult health outcomes may relate to placental growth and may therefore be rooted in the prenatal exposures and experiences of the child. This paper specifically considers how placental disk thickness, and in particular its variability, predict the ability of the placenta to meet the needs of the fetus (i.e. placental efficiency), which is likely to be an important factor in fetal programming and subsequently in the development of adult disease.
In recent work,Reference Yampolsky, Salafia and Shlakhter7–Reference Salafia and Yampolsky9 we demonstrated that an abnormal placental chorionic surface shape results in a lower placental functional efficiency, so that a smaller baby is produced for the same PW (i.e. altering the fetoplacental weight ratio, a predictor of child and adult disease risk). In Yampolsky et al.,Reference Yampolsky, Salafia and Shlakhter7 we directly related a specific deformation of the placental chorionic surface shape with sparseness of the placental chorionic surface vasculature. Further, in Salafia et al. Reference Salafia, Misra, Yampolsky, Charles and Miller10 we showed a link between placental surface shape and histologically diagnosed vascular pathology; placental functional efficiency was reduced (smaller BW for the same PW) in the presence of histologically diagnosed vascular pathology only when the surface shape is abnormal.
Our modelingReference Yampolsky, Salafia and Shlakhter11 suggests that the gaps in the placental chorionic surface vascular outgrowth that result from deformation of normal chorionic surface vascular branching will also lead to an increased variability of placental disk cross-sectional thickness. Disk thickness variability is a more direct reflector of branching growth of the finer levels of the placental vasculature, at the level of the fetal stems, than chorionic surface shape or the chorionic surface vessels alone. This leads us to the analysis of placental disk thickness and its relation with (a) placental functional efficiency and (b) deformed placental chorionic surface shape, which is carried out in the present paper.
Our specific hypotheses are as follows:
(1) If variable disk thickness is related to deformed growth of the placental vascular tree, then it would also be expected to correlate with deformed placental chorionic surface shape, and in particular, ‘regularly irregular’ chorionic surface shapes, which our growth modelReference Yampolsky, Salafia and Shlakhter11 connects with effects of vascular pathology on placental vascular outgrowth (we use Fourier analysis to quantify the typical ‘regularly irregular’ placental shapes).
(2) If variable disk thickness does, in fact, reflect variable placental fetal stem villous arborization, and by extension, fetal stem-level vascular branching, then variability of placental disk thickness would also be expected to have an effect on placental functional efficiency, resulting in a lower BW for a given PW (quantified as the fetoplacental scaling exponent, β, as described in Salafia et al. Reference Salafia, Yampolsky and Shlakhter8 and Salafia and YampolskyReference Salafia and Yampolsky9).
Finally, we also test whether average (mean) disk thickness or its variability, estimated from multiple measurements of a single central randomly oriented slice, has effects on placental functional efficiency independent of any associations with chorionic disk shape.
Materials and methods
Placental cohort
The Pregnancy, Infection and Nutrition Study is a cohort study of pregnant women recruited at mid pregnancy from an academic health center in central North Carolina. Our study population and recruitment techniques are described in detail elsewhere.Reference Savitz, Dole and Williams12, 13 Beginning in March 2002, all women recruited into the Pregnancy, Infection and Nutrition Study were requested to consent to a detailed placental examination. As of 1 October 2004, 94.6% of women consented to such examination. Of those women who consented, placentas were collected from 87% and photographed for image analysis. Of the 1225 consecutive placentas collected, 1023 were delivered at term. Placental gross examinations, histology review and image analyses were performed at EarlyPath Clinical and Research Diagnostics, a New York State-licensed histopathology facility under the direct supervision of Dr Salafia. The Institutional Review Board of the University of North Carolina at Chapel Hill approved this protocol.
The fetal surface of the placenta was wiped dry and placed on a clean surface after which the extraplacental membranes and umbilical cord were trimmed from the placenta. The fetal surface was photographed with the Lab ID number and 3 cm of a plastic ruler in the field of view using a standard high-resolution digital camera (minimum image size 2.3 megapixels). A trained observer (D.H.) captured the series of x, y coordinates that marked the site of the umbilical cord insertion, the perimeter of the fetal surface and the ‘vascular end points’, the sites at which the chorionic vessels disappeared from the fetal surface. The perimeter coordinates were captured at intervals between 1 and 2 cm, and more coordinates were captured if it appeared essential to accurately capture the shape of the fetal surface.
Placentas were cut perpendicularly to the chorionic plate by a series of parallel cross sections. The cuts were generally made starting from the apparent geometric center toward the edge of the placental surface, creating eight slices and seven unique cross sections. The frequency of the cross sections was increased if it appeared necessary to capture significant details of placental shape, such as multiple lobes. Placental slices were digitally traced by a trained observer (D.H.) to capture perimeters. The perimeter coordinates were again captured at intervals between 1 and 2 cm. For this study, only the central cross section of the placenta was used for analysis. Given that placentas were oriented for photography relative to the shortest distance from the site of rupture to the disk edge (a point outside the placentas), this is effectively a randomly oriented cross section of the central placenta.
Placentas received from the Pathology Department in several pieces, or with parts removed, could not be sliced according to the protocol. This has resulted in a reduced number of cut placentas, compared with the number of placentas collected. The total number of placentas for which the traced slices were obtained is 771, of which n = 587 were delivered at term. This equals 57% of all placentas delivered at term in the study.
Quantifying the thickness of a randomly oriented central placental slice
To measure placental disk thickness, we analyzed a random central cross section of the placenta. As noted above, placental orientation was randomized. Thus, this may approximate the larger diameter, but need not. It does represent a random slice through the center of the placental disk. We parameterize the top and bottom boundaries of the central slice by their length. We then put 100 markers on top and bottom of the slice so that the length of the boundary piece between two markers is constant. The markers are grouped into opposite pairs. We measure the following quantities:
(1) Mean placental thickness is the mean distance between the opposing markers.
(2) Normalized mean placental thickness is the mean placental thickness divided by the width of the slice.
(3) Variability of thickness for each pair of opposite markers Markeri top, Markeri bottom; we calculate di = distance (Markeri top, Markeri bottom), which is the thickness of the slice measured between the two markers. We then calculate the absolute value of the deviation of di from mean placental thickness. We average the deviations over all pairs of markers, and divide the resulting quantity by the value of the mean placental thickness. The result is a number between 0 and 1, with 0 corresponding to no variability (uniform thickness).
We used a single randomly oriented central slice as representative of the overall thickness of the placental disk in analyses of the impact of non-centrality of umbilical cord insertion on thickness. Our previous workReference Yampolsky, Salafia and Shlakhter7 suggests that non-centrality of cord insertion is not associated with a change in placental surface shape, and is significantly correlated with a larger PW, and lower functional efficiency (smaller baby for a given PW). We thus expect to find that non-centrality of cord insertion would produce a measurable increase in placental thickness, which for the same surface area would result in a heavier placenta. This was confirmed in our current data, suggesting that a single randomly oriented central slice is an adequate reflection of overall disk thickness and its variability.
Fourier analysis of the placental surface shape
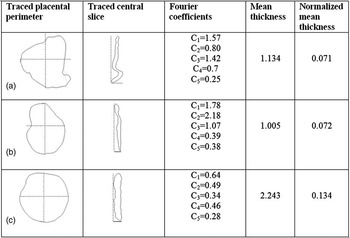
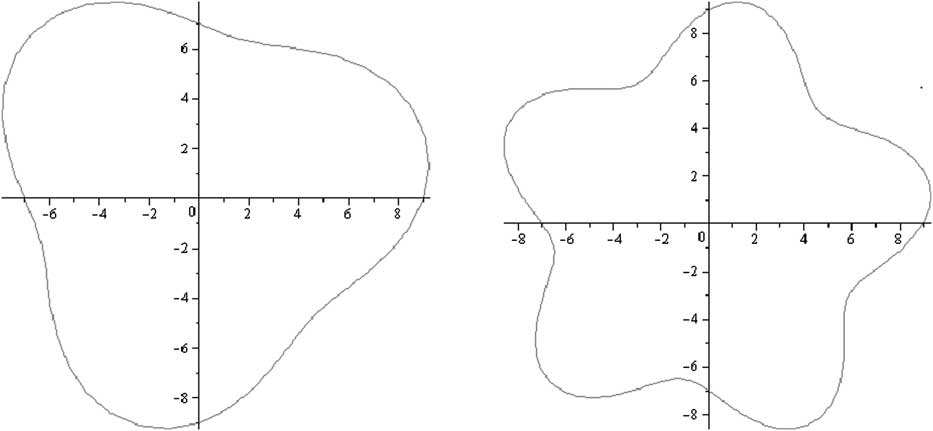
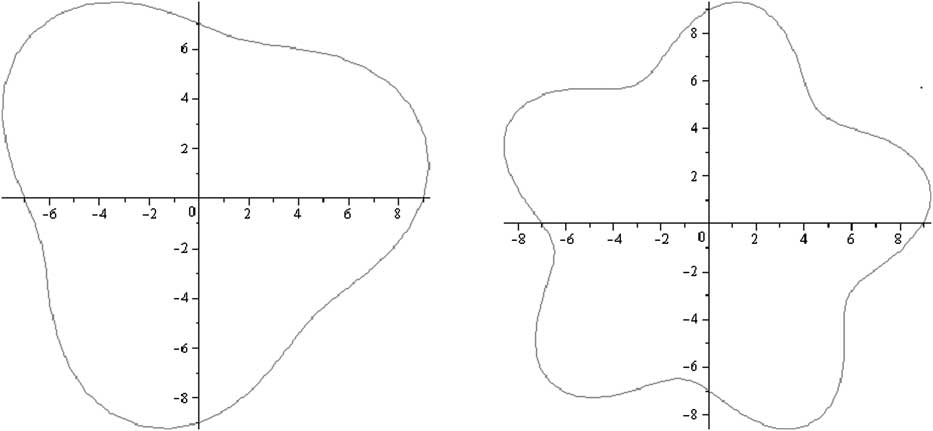
As in our previous work,Reference Yampolsky, Salafia and Shlakhter7 we use Fourier analysis to quantify the placental surface shape. The details of the analysis are provided in the Appendix. Fourier coefficients are a useful tool, in particular, as we would like to identify the typical regularly irregular placental surface shapes, such as tri-lobate, and star-shaped placentas (see Figs 1 and 2). An n-fold symmetry (n > 1) of the placental surface is reflected in a larger value of the coefficient Cn. In Fig. 3, we demonstrate this principle with two idealized placental shapes: a tri-lobate one (C 3 = 1, and for all other n > 0, Cn = 0) and a star-shaped one (C 5 = 1, and for all other n > 0, Cn = 0). Note, also, how this rule works for observed regularly irregular placentas in Fig. 1. For instance, the value of the coefficient C 3 for the tri-lobate placenta in Fig. 1a is measurably larger than the values of the other Cn's with n > 1.
Placental shape and thickness. (a) Tri-lobate placenta: large C 3, small mean thickness; (b) bi-lobate placenta: large C 2, small mean thickness; and (c) normally shaped placenta.

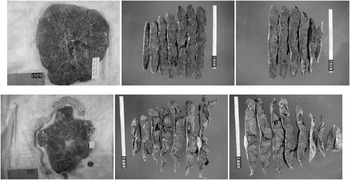
Variability of thickness for irregularly shaped placentas described by the Diffusion Limited Aggregation model. Above: the slices of a round placenta have uniform thickness. Below: the slices of a star-shaped placentas have highly variable thickness.

Idealized placental shapes and Fourier coefficients. Left: idealized tri-lobate placenta, C 3 = 1, for all other n > 0, Cn = 0. Right: idealized star-shaped placenta, C 5 = 1, for all other n > 1, Cn = 0.
Quantifying the displacement of the umbilical cord insertion
As in Yampolsky et al.,Reference Yampolsky, Salafia and Shlakhter7 we use the Fourier coefficient C 1 to measure the non-centrality of the insertion, and call it the Fourier displacement of the umbilical cord. If the shape is circular, with a central cord insertion, then C 1 = 0. A large Fourier displacement of the umbilical cord insertion does not influence the normal round shape and the diameter.Reference Yampolsky, Salafia and Shlakhter7 We have shown in Yampolsky et al. Reference Yampolsky, Salafia and Shlakhter7 that the centrality of the insertion of the umbilical cord has a significant impact on placental functional efficiency. However, a large displacement results in a heavier placenta,Reference Yampolsky, Salafia and Shlakhter7 with a reduced functional efficiency per unit of placental mass, larger β, which means a smaller baby for a given PW.
Quantifying the abnormality of placental surface shape and deformation of the placental vascular tree
As shown previously,Reference Yampolsky, Salafia and Shlakhter7 we use Fourier coefficients C 2, C 3, C 4 and C 5 to describe the variability of the shape of the placental chorionic surface. Our Diffusion Limited Aggregation (DLA) stochastic growth model of placental vasculatureReference Yampolsky, Salafia and Shlakhter11 predicts that a deformed chorionic surface shape reflects abnormal development of the placental vascular tree. Typical deformations of vascular growth described in Yampolsky et al. Reference Yampolsky, Salafia and Shlakhter11 result in star-shaped or multi-lobate placentas. Quantitatively, such a placental shape has large values of C 2, C 3, C 4 and C 5 as described above.
We also use a measurement of deviation of placental shape from the mean round shape described in Salafia et al. Reference Salafia, Misra, Yampolsky, Charles and Miller10 as Symmetric Difference, Δ. The larger value of Δ implies a larger difference between the placental surface area and the mean round shape.
Our DLA model predicts that the vasculature of a regularly irregular-shaped placenta fills the surface unevenly,Reference Salafia and Yampolsky9, Reference Yampolsky, Salafia and Shlakhter11 with gaps in vascular coverage forming sectors centered on the umbilical insertion point. This would produce a cross section of a highly variable thickness, with thinner areas corresponding to the sectors with less vascular coverage.
Measuring placental functional efficiency
As we have shown in Salafia et al. Reference Salafia, Yampolsky and Shlakhter8 and Salafia and YampolskyReference Salafia and Yampolsky9, the BW of a newborn does not scale linearly with the PW. The scaling relation between the two quantities is

which is a version of Kleiber's Law, reflecting the fractal structure of the placental vasculature.
Therefore, we have introduced a measure of the placental functional efficiency

A larger value of β corresponds to a lower BW for a given PW, and hence a lowered placental function per unit of volume. This is a nonlinear transformation of the fetoplacental weight ratio used in a number of studies.
Statistical analysis
Spearman's correlations for nonparametric distributions were used in order to be confident that our findings were robust to outliers, with P < 0.05 considered significant throughout. For partial correlations, which require normal distribution, any variable with a Kologonov–Smirnov P < 0.05 indicating deviation from a normal distribution (e.g. symmetric difference and umbilical cord displacement) was log-transformed before its use in these analyses.
Results
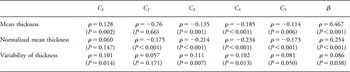
Results are also summarized in Table 1 and are explicitly discussed below.
Correlations of Fourier coefficients and β with thickness variables

Thickness v. Fourier displacement
The first Fourier coefficient C 1 is strongly and significantly positively correlated with mean thickness (ρ = 0.128, P = 0.002). Thus, a large umbilical cord displacement results in a thicker placenta. This confirms the findings of Yampolsky et al. Reference Yampolsky, Salafia and Shlakhter7
Variability of thickness v. variability of the shape
Our present measurements support the predictions of the DLA modelReference Yampolsky, Salafia and Shlakhter11 (see Fig. 2). The coefficients C 3, C 4 and C 5 are strongly and significantly correlated with the variability of disk thickness (ρ = 0.111, P = 0.007; ρ = 0.102, P = 0.013; and ρ = 0.081, P = 0.05, respectively). Further, there is a negative correlation with mean disk thickness and coefficients C 3, C 4 and C 5 (ρ = −0.135, P = 0.001; ρ = −0.185, P < 0.001; and ρ = −0.114, P = 0.006, respectively), and with normalized mean disk thickness and coefficients C 2, C 3, C 4 and C 5 (ρ = −0.175, P < 0.001; ρ = −0.214, P < 0.001; ρ = −0.234, P < 0.001; and ρ = −0.173, P < 0.001, respectively). Thus, the deformation of the placental chorionic surface shape, which corresponds to deformed placental chorionic surface vascular growth (which may, in particular, be manifested as a regularly irregular chorionic surface shape), results in a higher variability of placental disk thickness, and a lower mean disk thickness. These coefficients, as noted above (see section ‘Materials and methods’), correlate with increased irregularity of disk shape. Therefore, the relationship of altered thickness is consistent across many varieties of irregular disk shapes.
Variability of thickness v. placental efficiency
Next, we test whether the effect of lower placental disk thickness is reduced placental efficiency, as predicted by our model.Reference Salafia and Yampolsky9, Reference Yampolsky, Salafia and Shlakhter11 We find a strong and significant positive correlation of variability of disk thickness with β (ρ = 0.086, P = 0.038). Thus, a placenta with thin parts will tend to have a reduced functional efficiency, resulting in a smaller baby for a given PW.
Variability of thickness v. placental efficiency controlling for placental chorionic shape and cord insertion
We find a significant (P < 0.0001) partial correlation between the value of β and normalized mean placental thickness. Adjusting for symmetric difference, umbilical cord displacement and thickness, a significant (P = 0.002) correlation (0.125) was also seen between the value of β and the variability of thickness. Thus, increased variability of thickness (as well as the related reduced mean thickness) affects placental functional efficiency, measured as β, independently of the variability of surface shape or cord displacement.
Conclusions
Our findings suggest that consideration of placental dimensions including thickness (and not simply PW) can provide an insight into the mechanisms of fetal programming.
As we hypothesized, placentas with higher variability of thickness have a lowered functional efficiency (a higher value of β), and thus yield a smaller baby for a given PW. Variability of thickness relates to non-uniform three-dimensional growth of the placental vascular tree. As we see, accounting for effects of placental shape, cord displacement and the value of thickness as factors, the variability of thickness alone is responsible for much of the observed reduction in placental functional efficiency. Thus, the non-uniform villous and vascular arborization, which is reflected in a non-uniformly thick placenta, is reflected in a lower BW for a given PW (larger β). The measurement of variability of placental thickness is thus a valuable predictor of placental functional efficiency, reflecting deficiencies of placental vascular development, and by extension the fetal environment, which may not be detectable from analysis of the placental chorionic surface shape.
Our empirical model has predicted that deformed placental growth would be produced by stressors acting in placental angiogenesis. In previous work,Reference Yampolsky, Salafia and Shlakhter11 our model suggested that such deformed placental chorionic surface shapes are accompanied by non-uniform three-dimensional placental vascular branching, and thus increasingly variable placental disk thickness. This is consistent with the findings of the present paper. Deformed placental chorionic surface shapes corresponded to significantly higher variability of thickness. The presence of areas of low thickness (gaps in the vascular coverage due to reduced numbers of placental chorionic vessels at the corresponding stage of tree growth) also led to a lower average thickness in this case. As predicted in Salafia and YampolskyReference Salafia and Yampolsky9 and Yampolsky et al. Reference Yampolsky, Salafia and Shlakhter11 such placentas also have a lowered functional efficiency (a higher value of β), and thus yield a smaller baby for a given PW.
While a small but growing body of epidemiologic evidence links placental growth to health and disease in adulthood (primarily blood pressure, body weight and mortality),Reference Campbell, Hall and Barker1–Reference Salafia, Maas and Thorp5 published work thus far has relied on relatively simplistic measures of the placenta, namely PW and the fetal–PW ratio. As we have previously published and now demonstrate here,Reference Salafia, Zhang and Charles14, Reference Salafia, Zhang and Miller15 other parameters may contribute to a more nuanced description of the placenta. Utilizing measures of placental growth to study fetal origins of adult onset disease may contribute to a fuller understanding of the intrauterine forces that program health and disease in adults.Reference Godfrey6 Furthermore, if variability in placental branching growth, as reflected in abnormal placental chorionic surface shape and variable placental disk thickness, is proven to be a reliable predictor of health and disease in adulthood, these placental measures may be ideal candidates for screening as we seek to invest in childhood prevention efforts that may pay dividends in adulthood.
Acknowledgements
This work was partially supported by the NSERC Discovery Grant (M. Yampolsky), the NARSAD Young Investigator Award (C. Salafia) and the K23 MidCareer Development Award NIMH K23MH06785 (C. Salafia).
Appendix
Fourier analysis to quantify the placental surface shape
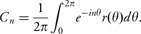
First, the umbilical insertion point is placed at the origin. Perimeter markers are connected by straight line segments to obtain an approximate perimeter P of the chorionic plate. A sector of opening of 6° with vertex at the origin is rotated in 6° increments. For each turn of the sector, the points in P inside of it are averaged to yield a radial marker. In this way, we obtain 60 radii emanating from the origin spaced at 6° intervals. They are connected to obtain the angular radius r(θ), which is a function of the angle θ from the umbilical insertion point. For the function r(θ), we compute its Fourier coefficients Cn as
Software
Numerical simulations of vascular trees were carried out using our ANSI C, three-dimensional, diffusion-limited aggregation simulation package ‘DLA-3d-placenta’, developed under the terms of the GNU General Public License as published by Free Software Foundation. For DLA cluster visualization, we have used PovRay, a freeware ray tracing program available for a variety of computer platforms. Fourier coefficients were calculated using Maplesoft Maple 12.0 Mathematics and Engineering software. The analysis of the digitally traced placental surfaces and slices was carried out using our proprietory ANSI C package ‘Placental-geometry’.