The Veterans Health Administration (VHA) is a leader in public reporting of healthcare-associated infections (HAIs). 1 As public reporting of HAI continues to expand, the accurate measurement of HAIs is essential for the evaluation of quality improvement projects within individual facilities and across different institutions.Reference Wright, Kharasch, Beaumont, Peterson and Robicsek 2 – Reference Richards 6
The convention in HAI reporting is to report infection rates standardized by 1,000 device days. 7 – 9 One strategy for HAI prevention is to reduce the number of device days by discontinuing devices that are no longer required.Reference Meddings, Rogers, Mach and Saint 10 However, this decrease in denominator may paradoxically increase infection rates.Reference Fakih, Greene and Kennedy 11 This trend was observed in 2 catheter-associated urinary tract infection (CAUTI) prevention studies in which a reduction in the device utilization ratio led to increased or unchanged rates of infections per 1,000 device days.Reference Wright, Kharasch, Beaumont, Peterson and Robicsek 2 , Reference Rothfeld and Stickley 3 The use of a population-based HAI rate adjustment with bed days as the denominator has been one approach to avoiding this potential disincentive to reducing unnecessary device days. However, the impact of this approach has only been demonstrated in single-institution studies and has not been used to compare infection rates between hospitals.Reference Wright, Kharasch, Beaumont, Peterson and Robicsek 2 , Reference Rothfeld and Stickley 3
We used VHA administrative databases to compare hospital infection rates using both device days and bed days as the denominator for CAUTI, central line-associated bloodstream infection (CLABSI), and ventilator-associated pneumonia (VAP). Hospitals and intensive care units (ICUs) that disproportionately care for patients with more complex illness may experience higher rates of appropriate device utilization.Reference Gould, Umscheid, Agarwal, Kuntz and Pegues 12 – Reference Almenoff, Sales and Rounds 16 This difference in device utilization may impact infection rates depending on the choice of denominator. Therefore, we explored the relationship between device utilization and infection rates over time and according to hospital complexity.
METHODS
In this retrospective survey, we used data from fiscal years 2011 (October 2010–September 2011), 2012 (October 2011–September 2012), and 2013 (October 2012–July 2013). Data for fiscal year 2013 beyond July were unavailable at the time of analysis.
Study Sample
Using VHA administrative databases, we identified 123 VHA medical centers providing acute inpatient medical and surgical services. Facilities with device days at or below the 5th percentile were excluded from the analysis for that HAI (<200 catheter days for CAUTI, 100 line days for CLABSI, or 50 ventilator days for VAP each year). We excluded 2 VHA medical centers with closure of acute inpatient medical and surgical services in 2013. We excluded another VHA medical center with missing complexity data.
Measures and Data Sources
We obtained the count of infections and device days for CAUTI, CLABSI, and VAP from the Inpatient Evaluation Center HAI database, bed-day data from the VHA Decision Support System Ward National Data Extract, and facility complexity grouping from the VHA administrative dataset. 17
HAI data were collected and submitted by each VHA medical center on a monthly basis; the data were aggregated at the nursing unit level. Case definitions and device days were collected according to National Healthcare Safety Network (NHSN) guidelines. 7 – 9 The Decision Support System Ward file reports inpatient encounters by nursing unit segments. The VHA facility complexity grouping was based on empirical analysis of factors contributing to medical center complexity, including the number of prorated patients, patient risk, complexity of intensive care and surgical services, the number of resident slots, research dollars, and the number of complex clinical programs (eg, spinal cord injury program, blind rehabilitation, cardiac surgery, neurosurgery, interventional radiology, poly-trauma, and Mental Health Intensive Case Management). 17 – Reference Korom-Djakovic, Canamucio, Lempa, Yano and Long 19 Each VHA medical center was assigned a complexity level of 1a (most complex), 1b, 1c, 2 or 3 (least complex). Similar methods have been used to develop complexity levels for ICUs in the VHA.Reference Almenoff, Sales and Rounds 16 Medical Centers with high complexity are similar to academic tertiary referral centers with a large volume of high-risk patients, complex specialist and intensive care services, significant research funding, and an affiliation with a large academic training program.Reference Korom-Djakovic, Canamucio, Lempa, Yano and Long 19 For example, the Houston VA is a 1a facility with 357 acute care beds, the largest VA residency program in the country, substantial research, and complex medical services, including transplant surgery, neurosurgery, cardiovascular surgery, and spinal cord injury services.Reference Michael 20
We estimated infection rates for CAUTI, CLABSI, and VAP in 2 ways: number of infections per 1,000 device days and number of infections per 10,000 bed days. We calculated device utilization as the ratio of device days to bed days. To compare hospital infection rate using device days and bed days as the denominator, we ranked VHA medical centers on each of the infection rate measures. VHA medical centers with the same infection rate were assigned the average rank. We calculated infection rate and device utilization as yearly measures at the hospital level using data from acute medical and surgical units (intensive care, coronary care, medicine, surgery, mixed medicine and surgery, step-down and telemetry care units). To do so, we rolled the unit level infection count, device day, and bed day data up to the hospital level and then divided the number of infections by the number of device days to obtain the device-day rate. We then divided the number of infections by the number of bed days to obtain the bed-day rate. Infection rates and device utilization for VAP were calculated using data from intensive care and coronary care units only.
Analysis
Our analysis was conducted at the hospital level. For the comparison between infection rates and device utilization across time and facility complexity grouping, we used analysis of variance on continuous variables with normal distribution or the Wilcoxon rank sum test for variables that were not normally distributed. Post hoc tests were conducted using Tukey’s honestly significant difference (HSD) following a significant omnibus F-test. Correlations between a hospital’s relative ranking on infection rates using device days and bed days as the denominator were tested using the Pearson correlation coefficient. Statistical analyses were carried out using Stata, version 12.1 (StataCorp, College Station, TX).
This study was conducted in support of VHA operations using existing data and did not include protected health information. This study was reviewed by the Institutional Review Boards at Baylor College of Medicine, the Michael E. DeBakey VA Medical Center, and the Kansas City VA Medical Center, which determined that this activity does not constitute human subject research.
RESULTS
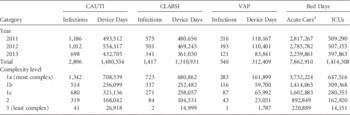
A total of 120 medical centers providing acute medical and surgical care were included. Complexity level 1 hospitals accounted for 62% (n=74) of VHA medical centers, with 32 1a hospitals, 16 1b hospitals, and 26 1c hospitals. Complexity level 2 hospitals accounted for 25% of medical centers (n=30), and 13% (n=16) were complexity level 3 hospitals. A total of 7.9 million bed days were included in this study, including 1.4 million ICU bed days. The total number of healthcare-associated infections reported were as follows: 2,896 CAUTI with 1.5 million catheter days; 1,417 CLABSI with 1.3 million central-line days; and 530 VAP with 312,409 ventilator days (Table 1).
Total number of Infections, Device Days, and Bed Days Stratified by Year and Hospital Complexity

NOTE. CAUTI, catheter-associated urinary tract infection; CLABSI, central line-associated blood stream infection; VAP, ventilator-associated pneumonia; ICU, intensive care unit.
a Acute care bed days includes ICU bed days.
HAI and Device Utilization Ratio across Time and Hospital Complexity Level
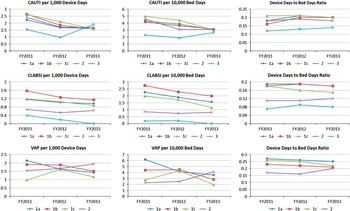
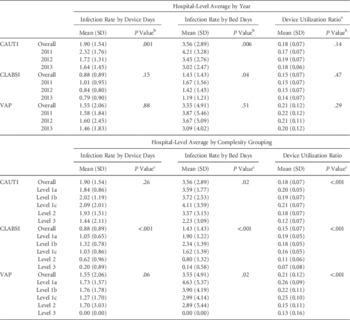
We present infection rates and device utilization ratios by year and hospital complexity grouping at the hospital level in Table 2. Infection rates improved over time for CAUTI measured either by device days or by bed days (Table 2). CLABSI rates decreased significantly over time when measured by bed days only (Table 2). VAP rates with either device days or bed days and device utilization ratios for CAUTI, CLABSI, and VAP were not statistically different across time. Despite VA overall improvement in CAUTI and CLABSI over time, the improvement was not uniform across hospitals of varying complexity. However, the absolute number of infections in lower complexity hospitals was very small (Figure 1).
Infection rates and device utilization ratio by complexity level and year. NOTE. Complexity level 3 facilities were not shown in graphs for VAP due to the small number of facilities in this category in this study.

Hospital-Level Infection Rate and Device Utilization Ratio

NOTE. CAUTI, catheter-associated urinary tract infections; CLABSI, central-line associated bloodstream infection; VAP, ventilator-associated pneumonia.
a Device utilization ratio=device days/bed days.
b Comparison across time.
c Comparison across facility complexity grouping.
Hospital-level infection rates and device utilization ratios varied by facility complexity grouping, with high complexity hospitals having a higher infection rate and device utilization ratio than low complexity hospitals (Table 2). Over the 3-year period, infection rates for CLABSI were higher in more complex hospitals measured using both denominators. For CAUTI and VAP, infection rates were statistically different by facility complexity grouping when measured by bed days but not by device days. Device utilization ratios were statistically different for all 3 types of devices (ie, urinary catheters, central line catheters, and ventilators) and in all cases were higher in more complex hospitals.
Comparing Hospitals’ Relative Performances in HAI Using Device Days and Bed Days
Infection rates calculated with device days and bed days as the denominators were strongly correlated for each year, with Pearson correlation coefficients from 0.79 to 0.94 (P<.001, Table 3). Relative performances of hospitals measured by the ordered rank of each medical center based on infections per device days and infections per bed days were also strongly correlated with Pearson correlation coefficients from 0.82 to 0.96 (P<.001) for each type of infection and across all 3 years. An analysis limited to ICU settings of device days and bed days as the denominator for CLABSI showed that both the rates of these infections and the rank order of facilities was strongly correlated for the 2 denominators (0.87–0.89 and 0.961–0.964, respectively).
Pearson Correlation Coefficients for Infection Rates and Hospital Rankings Derived Using Device Days Versus Bed Days as the Denominator

NOTE. CAUTI, catheter-associated urinary tract infection; CLABSI, central line-associated blood stream infection; VAP, ventilator-associated pneumonia. All Pearson correlation coefficients were statistically significant at P<.001.
DISCUSSION
In this retrospective survey, we observed that infection rates calculated with either device days or bed days as the denominator were strongly correlated over a 3-year time period in the setting of stable device utilization. Additionally, changing the denominator did not affect the rank order of medical centers for rates of CAUTI, CLABSI, or VAP. Despite stable device utilization ratios, CAUTI and CLABSI rates declined over the study period. Infection rates and device utilization varied by hospital complexity for all 3 HAIs.
Our findings are important in the ongoing debate regarding whether to report infection rates with device days or bed days as the standardizing denominator. Prior studies have demonstrated that infection prevention efforts aimed at reducing unnecessary device use may increase infection rates when device days is used as the denominator.Reference Wright, Kharasch, Beaumont, Peterson and Robicsek 2 , Reference Rothfeld and Stickley 3 , Reference Fakih, Greene and Kennedy 11 This paradoxical increase has led some to advocate for the use of 2 denominators: a population-based bed-day denominator for monitoring infection rates within institutions and the traditional device-day rate for comparisons between hospitals.Reference Wright, Kharasch, Beaumont, Peterson and Robicsek 2 , Reference Fakih, Greene and Kennedy 11 , Reference Trick and Samore 21 Our findings demonstrate that device days and bed days were equally effective adjustment metrics for comparing HAI rates between VHA hospitals from 2011 to 2013. Collection of device-day and bed-day data is a manual, labor-intensive practice with frequent inaccuracies.Reference Trautner, Patterson and Petersen 4 , Reference Backman, Nobert, Melchreit, Feketa and Dembry 22 – Reference Talbot, Tejedor and Greevy 24 Although NHSN allows reporting from electronic surveillance, this requires an integrated electronic medical record system that captures device use, which is not available in many facilities. 7 – 9 , Reference Wright, Fisher, John, Reynolds, Peterson and Robicsek 25 , Reference Stone, Pogorzelska-Maziarz and Herzig 26 The use of a single population-based denominator for all infection reporting would benefit infection preventionists who spend nearly half of their time on activities related to infection surviellance.Reference Stone, Pogorzelska-Maziarz and Herzig 26
One potential explanation for the strong correlation observed between infection rates using both denominators is that device use did not change during our study period. The VHA is a leader in infection prevention and has participated in nationwide efforts to reduce device-related infections, such as the introduction of a CLABSI bundle in 2006 and implementation of Centers for Disease Control and Prevention (CDC) recommended practices to reduce CAUTI and VAP in the mid-2000s.Reference Render, Hasselbeck, Freyberg, Hofer, Sales and Almenoff 14 , Reference Krein, Kowalski, Hofer and Saint 27 Our finding that utilization of devices remained stable is consistent with other reports that have assessed device utilization. A study from the CDC did not find a change in utilization of urinary catheters in ICUs from 1990 to 2007.Reference Burton, Edwards, Srinivasan, Fridkin and Gould 5 The national VHA implementation of the CLABSI bundle also did not result in changes in central-line utilization.Reference Render, Hasselbeck, Freyberg, Hofer, Sales and Almenoff 14 The absence of a national change in device utilization may suggest that these practices are difficult to maintain outside the context of a research study or that changes in devices utilization occurred in the VA prior to 2011.Reference Wright, Kharasch, Beaumont, Peterson and Robicsek 2 , Reference Rothfeld and Stickley 3 , Reference Meddings, Rogers, Mach and Saint 10
In contrast to increasing rates of CAUTI reported from administrative claims, our epidemiologic data show a decrease in CAUTI and CLABSI rates.Reference Schuller, Probst, Hardin, Bennet and Martin 28 , Reference Weinberg and Kahn 29 Our observed decrease in the rates of CAUTI and CLABSI across VHA hospitals is consistent with the NHSN report, which reported a 7% decline in CAUTI from 2009 to 2011 and a 41% decline in CLABSI from the 2006–2008 reference period to 2011.Reference Malpiedi, Peterson and Soe 30 Although CLABSI rates declined when measured with both bed days and device days, the change was only statistically significant with the bed-days metric. Whether this indicates that the bed-days denominator is the better metric to monitor changes in infection rates over time is unclear. Given that there was no change in device utilization during the observed time period, the significant reduction in CAUTI and CLABSI rates observed in our study suggests that the decline may be attributed to other infection prevention efforts, such as those aimed at improving sterility of device insertion and maintenance.Reference Render, Hasselbeck, Freyberg, Hofer, Sales and Almenoff 14 , Reference Krein, Kowalski, Hofer and Saint 27 , Reference Saint, Greene, Kowalski, Watson, Hofer and Krein 31
Hospitals with higher complexity levels are expected to have higher-acuity patients with high device-utilization needs, and this result was observed in our findings.Reference Render, Hasselbeck, Freyberg, Hofer, Sales and Almenoff 14 – Reference Almenoff, Sales and Rounds 16 Lower-complexity hospitals had significantly lower device-related infection rates when calculated with bed days as the denominator. This difference in device utilization and infection rates based on hospital complexity raises the question whether or not hospitals of varying complexity should be held to the same standards for device-related infections. One approach towards a risk-adjusted HAI metric is the standardized infection ratio used by the CDC since 2009. 32 Additional experience and research is required to determine whether the standardized infection ratio metric sufficiently accounts for the infection rate variation among hospitals of different complexity.
Our study was performed within the VHA; however, we believe that our results are applicable to non-federal hospitals. Although the VHA has traditionally reported longer hospital length of stay, the VHA has made significant improvements in reducing length of stay over the past 20 years to the level of non-federal hospitals.Reference Rosenthal, Kaboli and Barnett 33 , Reference Kaboli, Go and Hokenbary 34 All VHA medical centers are mandated to report HAI rates using the same reporting standards as non-federal hospitals with state mandates for NHSN reporting. 1 , 7 – 9 Although VHA medical centers are not subject to CMS non-payment rules, the budget of VHA medical centers is based on the medical centers’ successes at meeting national VHA safety and quality measures. 35 Further, VHA medical centers are held to the National Patient Safety Goals from the Joint Commission to reduce device-related infections and are actively engaged in similar infection prevention efforts as non-federal hospitals.Reference Krein, Kowalski, Hofer and Saint 27 , 36 Our analyses were limited to comparisons between hospitals. Additional research is required to further evaluate both denominators as internal metrics to compare infection rates across hospital units. Finally, the data used in this study was from administrative databases that do not contain patient identifiers and could not be validated.
Our study is the first to examine the performance of both denominators for 3 HAIs on a national level. Over the past 3 years, within the VHA, using either device days or bed days to standardize HAI would have led to equivalent hospital rank order for the 3 publically reported HAIs. Our findings call into question the need to report infection rates with both device days and bed days as the denominator to limit any potential disincentive toward reduced device utilization.Reference Trick and Samore 21 , Reference Fakih, George, Edson, Goeschel and Saint 37 Although current NHSN standards require collection and reporting of both device days and bed days, the time required to collect device days takes away from time spent on HAI prevention. In the era of value-driven, evidence-based practices in health care, careful consideration should be given to the utility of having hospitals spend the resources to collect both device-day and bed-day data for use in denominators.
Acknowledgments
Financial support: This material is based upon a quality improvement project supported by the Department of Veterans Affairs, Veterans Health Administration, Office of Informatics and Analytics, Operational Analytics and Reporting. This material is also based upon work supported in part by the Department of Veterans Affairs, Veterans Health Administration, Office of Research and Development, and the Center for Innovations in Quality, Effectiveness and Safety (CIN 13-413) at the Michael E. DeBakey VA Medical Center, Houston, TX. Dr. Horstman was partially supported by the VA Office of Academic Affiliations Chief Resident in Quality and Safety program. Dr. Trautner’s research was partially supported by VA QUERI RRP 12-443.
Potential conflicts of interest: All authors report no conflicts of interest relevant to this article.
The views expressed in this article are those of the authors and do not necessarily reflect the position or policy of the Department of Veterans Affairs, the United States government, or Baylor College of Medicine.