Introduction
The UK has recently experienced a considerable decline in child poverty that has been mainly attributed to government reforms (Department of Work and Pensions, 2004). However, other studies suggest that children from the very poorest families remain a legitimate concern. Sutherland (Reference Sutherland2001) noted that the income situation of the poorest children may have indeed worsened following the government's reforms. Recent evidence from the British Household Panel Survey (BHPS) revealed that whereas the proportion of children in non-severe poverty declined significantly after 1997, there has been no evidence of a corresponding decline in the proportion of children in severe poverty (Magadi and Middleton, Reference Magadi and Middleton2005). This was consistent with findings from a study based on the Family Resources Survey (FRS) which observed that the decline in child poverty between 1997/98 and 2003/4 was lower for more severe poverty (below 50 per cent of median income) compared to the proportion below 60 per cent of median income (Brewer et al., Reference Brewer, Goodman, Shaw and Shephard2005).
While the government is committed to continuing to monitor various aspects of poverty, including persistent poverty, there are no plans to monitor severe poverty. There has been a vast array of recent research on child poverty, but little is known about the circumstances and characteristics of children in severe poverty, for whom policy responses may need to be different (Adelman et al., Reference Adelman, Middleton and Ashworth2003).
This article develops a measure of severe child poverty, and identifies the risk factors for severe child poverty, based on the 2004/5 FRS. The severe child poverty measure: takes into account the child's own experience of poverty or deprivation; includes the parents’ experience of poverty or deprivation separately from that of their children; and considers the income of the household, since the contribution of low household income to the risk of poverty in childhood cannot be ignored. The specific objectives are:
• to examine the extent of severe child poverty in the UK; and
• to identify the risk factors for severe child poverty in the UK.
Overview of poverty measurement
Given the multi-dimensional nature of poverty, its measurement should encompass a variety of dimensions and not just income (Perry, Reference Perry2002). Focusing solely on income may miss important aspects of what it means to be poor (Nolan and Whelan, Reference Nolan and Whelan2005). Furthermore, it has been observed that poverty measures based solely on income are often limited by the difficulty of obtaining an accurate calculation of a household's income, and widespread misreporting of income by respondents in surveys (Willitts, Reference Willitts2006). Material deprivation indicators should compensate to some extent for the misreporting of income, which is a particular problem at the lower end of the income distribution (Willitts, Reference Willitts2006). For instance, those with reported low income but no evidence of material deprivation would not be classified as being in poverty. The need to take into account the multi-dimensional nature of poverty has been well recognised in international poverty studies. In a descriptive comparative analysis of European poverty, Heikkila et al. (Reference Heikkila, Moisio, Ritakallio, Bradshaw, Kuivalainen, Hellsten and Kajoja2006) argue that an indicator of poverty based on income, subjective and material deprivations is likely to be a more reliable measure of poverty than income alone.
Our measure of material deprivation is based on an ‘enforced lack’ approach which helps to discriminate between those choosing not to have necessities and those forced to do without necessities because of a lack of economic resources (Hallerod, Reference Hallerod1995). We do recognise on-going debate in the deprivation literature on the role choice plays and how different groups may respond differently (Cappellari and Jenkins, Reference Cappellari and Jenkins2004). For instance, it has been noted that younger people tend to say they cannot afford items, whereas older people tend to say they do not need items (McKay, Reference McKay2004). Nevertheless, our confidence in the use of the ‘enforced lack’ approach in this study is strengthened by the fact that research evidence has shown that families with children tend not to differ much from the general population in their reporting of deprivation indicators (Willitts, Reference Willitts2006).
Although some researchers have highlighted the benefits of a material deprivation measure over income, and vice versa, many experts recognise the complementary nature of the two measures, and support the use of combined income and deprivation tier for a more robust and reliable poverty measure (Ringen, Reference Ringen1988; Muffels, Reference Muffels, Berghman and Cantillion1993; Hallerod, Reference Hallerod1995; Nolan, Reference Nolan1999; Adelman et al., Reference Adelman, Middleton and Ashworth2003; DWP, 2003). According to DWP (2003), a better measure of living standards at any point in time can be obtained by measuring both low income and material deprivation combined to identify households whose low incomes are leading to deprivation since they cannot afford the necessities. Furthermore, the combined measure helps minimise the role of choice in deprivation items, since the level of income is also taken into account.
Analogous to the methodology used to measure severe child poverty based on the Poverty and Social Exclusion Survey (PSE) of 1999 (Gordon et al., Reference Gordon, Adelman, Ashworth, Bradshaw, Levitas, Middleton, Pantazis, Patsios, Payne, Townsend and Williams2000; Adelman et al., Reference Adelman, Middleton and Ashworth2003; Bradshaw and Finch, Reference Bradshaw and Finch2003), the measurement of severe child poverty in this article, based on the 2004/5 FRS, involves three indicators:
• child deprivation – whether the child goes without items that the majority of parents in the UK believe to be necessary for children, because parent(s) cannot afford to provide the items;
• parent deprivation – whether parent(s) go without items that the majority of adults in the UK believe to be necessary for adults, because they cannot afford the items; and
• income poverty of the household – below a given threshold of median household income.
Data and methods
Family Resources Survey
This article is based on analysis of the Family Resources Survey (FRS), an annual national survey of private households in the UK, sponsored by the Department for Work and Pensions (DWP). The survey aims to be representative of the UK household population. Our analysis focuses on the 2004–05 survey, which had an effective sample size of about 45,000 households from which approximately 28,000 households were successfully interviewed, giving an overall response rate of 62 per cent (DWP, 2005). The data presented in this paper are based on weighted percentages to cater for potential bias due to possible selective non-response. To ensure reliable significance tests, the weights used in the analysis have been re-scaled so that the overall totals for weighted cases equal those of unweighted cases.
Households interviewed in the survey were asked a wide range of questions about their income and circumstances. The interviews were administered through face-to-face Computer Assisted Personal Interviewing (CAPI). While it was designed with DWP's data needs in mind, FRS contains information that is of interest to researchers and analysts from a wide range of disciplines. Further details about the design and implementation of the 2004–05 FRS are available in DWP (2005). Our analysis uses both household-level information, provided by an adult representative of the household (usually the household head), as well as individual level information (for example, on economic activity) provided by individual adult household members. From 2004–05, the ‘Consumer durables’ questions have been replaced by the new material deprivation questions which form an important part of our analysis.
Material deprivation threshold
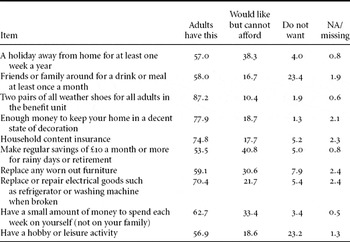
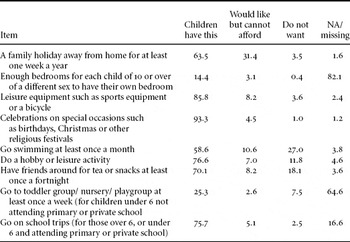
It has been noted that it is not necessary to include a long list of goods and services when measuring material deprivation (DWP, 2003). The list of deprivation items included in the FRS (see Appendix A, available online) was derived through a comprehensive analysis of existing UK deprivation data to identify a set of questions that best discriminate between poor and non-poor families (McKay and Collard, Reference McKay and Collard2004). A range of analytical methods were used to select the subset of questions, ranging from an examination of items that families were most commonly unable to afford, and direct investigations of the ability of particular questions to discriminate between poor and non-poor, to more powerful statistical methods based on factor analysis and latent class analysis. The different methods identified a consistent set of questions as having the greatest relevance. The data show that a significant proportion of children were in families who could not afford specific adult-related necessities (Table 1) or child-related items (Table 2).
Per cent of children in families deprived of specific adult-related items.

Note: Base population: all children (n = 16,012) in 2004–5 FRS.
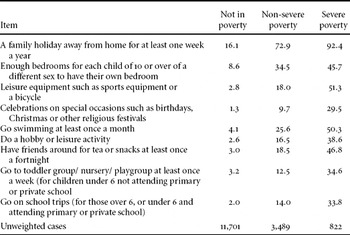
Per cent of children in families who are deprived of specific child necessities.

Note: Base population: all children (n = 16,012) in 2004–5 FRS.
Various statistical approaches were considered to determine a suitable material deprivation threshold for severe child poverty. The first approach involved the use of Discriminant Analysis to determine the appropriate threshold for the number of adult and child necessities lacked for cases to be classified as deprived. However, there were a number of difficulties with this approach with respect to its applicability and accessibility (see Magadi and Middleton, Reference Magadi and Middleton2007). Another approach considered involved the use of Principal Components Analysis (PCA) to assign indicator weights and derive summary indices of adult and child deprivation. The PCA is a powerful tool in identifying the underlying patterns in the data, and reducing the number of dimensions without much loss of information. The approach has been widely used in similar studies to quantify variations in household wealth based on household assets and amenities (Filmer and Pritchett, Reference Filmer and Pritchett2001; Rutstein and Johnston, Reference Rutstein and Johnston2004). However, in view of the limitations of a PCA approach in cases where the variables are measured at ordinal or dichotomous level (as is the case here) rather than interval level, we have adopted a simple additive approach, assigning equal weights to each of the deprivation items. In practice, the patterns of severe child poverty based on the simple additive approach were quite similar to those derived using the PCA approach (comparison available from the author on request).
Having decided to adopt a simple additive approach, rather than a more complex statistical form of combining deprivation items, there is then the question of establishing a material deprivation threshold for severe child poverty. We judged that not being able to afford one child-related or one adult-related necessity may be indicative of some (possibly mild) deprivation, while not being able to afford two or more child-related or adult-related necessities is likely to be indicative of more severe material deprivation. Our thresholds for children in families experiencing material deprivation therefore classify those deprived on at least one child and at least one adult item as experiencing non-severe deprivation, while those deprived on at least two adult and at least two child items are classified as experiencing severe material deprivation. Using this classification, 21.4 per cent of children in the UK are in severe deprivation, 26.4 per cent are in non-severe deprivation, while the remaining 52.2 per cent are not deprived.
It is worth noting that a more stringent definition of severe deprivation is used here than is used in a previous analysis (see Magadi and Middleton, Reference Magadi and Middleton2007). In the previous analysis, children deprived on at least one child item and two or more parent items, or deprived on at least one parent item and two or more child items, were defined as experiencing severe deprivation, and this identified 36.5 per cent of children as severely deprived. Although less inclusive, the simple additive approach has the advantage of simplicity and can easily be replicated in subsequent years to monitor trends.
Severe income poverty threshold
Income as used in this article refers to household income, equivalisedFootnote 1 based on the modified Organisation for Economic Co-operation and Development (OECD) equivalence scale, consistent with the measures used to monitor progress on child poverty reduction in the UK (DWP, 2003). Although the official UK measure of low incomeFootnote 2 previously used the McClements scale (DWP, 2006), the modified OECD scale is preferred for child poverty measures since it assigns greater weight to the cost of young children, and facilitates comparison with other official statistics in the UK and Europe. The modified OECD scale is now the preferred equivalence scale in the UK Households Below Average Income (HBAI) analysis (DWP, 2008).
Low-income measures may be based on ‘before housing costs’ or ‘after housing costs’ income. With an ‘after housing costs’ measure, the median income poverty line and the proportions below it are calculated after deducting housing costs from the household income. We acknowledge the advantages and limitations of both BHC and AHC measures for income poverty. In this article, we have used an ‘after housing costs’ measure, which is believed to be a better measure of disposable household income (Adelman et al., Reference Adelman, Middleton and Ashworth2003). The measure is more suitable in identifying those facing greatest financial difficulties: that is, those experiencing severe poverty. Although ‘after housing costs’ is our preferred measure, proponents of a ‘before housing costs’ income measure may argue that the impact of higher housing is to some extent picked up in the deprivation measure (see for example Willitts, Reference Willitts2006) since those with high housing costs cannot afford to buy items and activities.
Our income poverty measurement is based on relative (rather than absolute) poverty lines, which are more widely used in developed country contexts, such as the UK, where the key challenge is to ensure that the whole population shares the benefits of economic growth. What is regarded as minimum acceptable living standards in this context depends largely on the general level of social and economic development (Expert Group on Poverty Statistics, 2006). Three options were considered in identifying an appropriate income threshold for severe child poverty measurement. The first involved an attempt to circumvent the well-recognised drawback of using arbitrary income poverty thresholds. We considered using median income support levels as a proxy for low income. However, a major shortcoming was that the prevailing income support levels do not reliably reflect acceptable minimum living standards. At the time this research was carried out, a consensual minimum income standard for Britain had not been established, although there is some scope for using recent work on this as a basis in future (Bradshaw et al., Reference Bradshaw, Middleton, Davis, Oldfield, Smith, Cusworth and Williams2008; Oldfield and Bradshaw, Reference Oldfield and Bradshaw2008).
The second option considered using the lower end of routinely published income thresholds. The current approach in DWP's annual Opportunities for All publication is to report a range of low-income thresholds at 50, 60 and 70 per cent of median. Measuring Child Poverty (DWP, 2003) uses the higher end of the income threshold of 70 per cent of contemporary median income, in conjunction with material deprivation. Our focus in this study is on severe poverty; hence, a lower threshold is appropriate. We considered using the lower income threshold of 50 per cent or a more extreme cut-off point of 40 per cent. According to the FRS 2004/05 survey, about 16 per cent and 9 per cent of all children in the UK were in households with below 50 per cent and 40 per cent of median income,Footnote 3 respectively. Previous studies on severe child poverty in the UK have used the 40 per cent threshold (Adelman et al., Reference Adelman, Middleton and Ashworth2003; Magadi and Middleton, Reference Magadi and Middleton2005) or the 50 per cent threshold (Magadi and Middleton, Reference Magadi and Middleton2007). While this approach is desirable for its simplicity, the choice of thresholds remains rather arbitrary.
The final approach focused on the ‘poorest of the poor’: that is, the bottom half of those classified as being in poverty based on the standard threshold of 60 per cent median income. This involved obtaining the median income for all individuals in income poverty at 60 per cent threshold, then classifying those in the bottom half (that is, below the median of the poor) as being in ‘severe poverty’. This threshold corresponded to 45 per cent of median income based on 2004/5 FRS. An examination of the proportion of children classified as being among ‘the poorest poor’ helps establish the extent to which children (or families with children) are close to the conventional poverty line or disproportionately experience dire financial difficulties. Using this definition, 12 per cent of all children in the UK are classified as being in ‘severe’ income poverty, 15 per cent are in mild–moderate income poverty and 73 per cent are not in income poverty.
Severe child poverty definition
We have classified children as being in ‘severe’ poverty if they are in households with severe income poverty (the ‘poorest poor’: bottom half of income poor at conventional 60 per cent threshold) in combination with ‘severe’ material deprivation (deprived of at least two adult and at least two child necessities). Those in households below 70 per cent of median income, in combination with at least one adult and at least one child deprivation, are classified as being in non-severe poverty. The remaining are classified as not being in poverty.
Results
The extent of severe child poverty in the UK
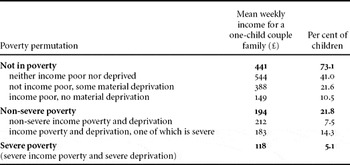
Based on the above definition, of children in the UK about 5 per cent (0.66 million) are classified as being in severe poverty, 22 per cent in non-severe poverty, while the remaining 73 per cent are not in poverty. The poverty permutations and mean income for a one-child couple family are presented in Table 3.
Poverty permutations and mean income.

Note: Base population: all children (n = 16,012) in 2004–5 FRS.
As might be expected, given the combined income and deprivation definition of severe poverty, those in severe poverty have extremely low disposable household income, averaging only £118 per week for a one-child couple family, compared to £441 for those not in poverty in 2004. Those classified as being in severe poverty have substantially lower average disposable income than the other subgroups, with the exception of those classified as having severe income poverty with non-severe or no material deprivation. These subgroups, especially those having no deprivation, are likely to comprise those for whom reliable income measures are not available. Further examination shows that those in severe income poverty but not deprived comprise a disproportionately high proportion of the self-employed (see Appendix B, available online), a group prone to income measurement errors. For instance, 35 per cent of children in severe income poverty but not deprived have self-employed parents, compared to only 13 per cent for all children. It is also possible that some of those with no deprivation but low income have recently become income-poor, and this has not yet been translated into deprivation (Gordon et al., Reference Gordon, Adelman, Ashworth, Bradshaw, Levitas, Middleton, Pantazis, Patsios, Payne, Townsend and Williams2000).
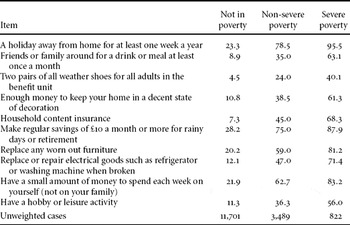
We examine in Tables 4 and 5 the extent to which families of children in severe poverty lack specific adult-related or child-related necessities. Children in severe poverty fare rather poorly on each of the specific adult-related and child-related deprivation items, which is to be expected given the definition of severe poverty employed. The data highlight the extent of deprivation that children classified as severely poor are experiencing: 88 per cent live in households that cannot afford regular savings of £10 a month or more; 81 per cent live in households that cannot afford to replace worn furniture; 71 per cent live in households that cannot afford to repair electrical goods; and 68 per cent live in households without contents insurance.
Per cent of children whose families cannot afford specific adult-related necessities.

Note: Base population: all children (n = 16,012) in 2004–5 FRS.
Per cent of children whose families cannot afford specific child-related necessities.

Note: Base population: all children (n = 16,012) in 2004–5 FRS.
Characteristics of children in severe poverty
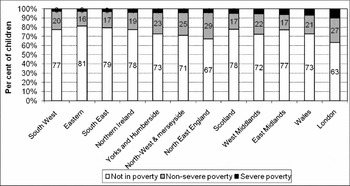
The proportion of children in severe poverty ranges from a low of about 3 per cent in South (South East and South West) and Eastern England to a high of about 10 per cent in London (Figure 1). Other regions with above-average levels of severe child poverty are East Midlands and Wales. It is important to note that the average housing costs are highest in London and South East; hence, these regions would be expected to show lower poverty levels if income was based on a ‘before housing costs’ measurement. On the other hand, Northern Ireland has considerably lower housing costs compared to the other regions and therefore would show higher poverty levels, relative to the other regions, if income was based on a ‘before housing costs’ measure.
Regional variations of child poverty in the UK, ranked by increasing severe child poverty levels.

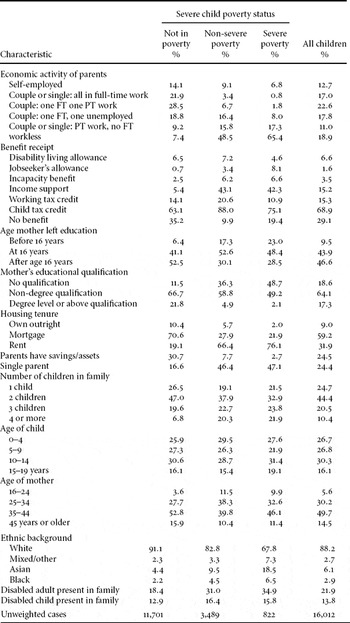
The bivariate distribution of child poverty by socio-economic factors show a strong association between economic activity of parents and severe child poverty status (Table 6). As might be expected, children in severe poverty are highly likely to have workless parents and unlikely to have parents in full-time work. The majority (65 per cent) of children in severe poverty have workless parents, compared to 49 per cent of children in non-severe poverty and only 7 per cent of children not in poverty. Conversely, the proportion of children in severe poverty who have parents in full-time work is considerably lower that that of children in non-severe poverty or not in poverty.
Characteristics of children in severe poverty.

It is interesting to note that the low economic activity among parents of children in severe poverty is not matched with levels of benefit receipt. Children in severe poverty are generally less likely to be in families in receipt of means-tested benefitsFootnote 4 (except Jobseekers Allowance) compared to those in non-severe poverty. In particular, children in severe poverty are considerably less likely to be in families receiving Child Tax Credit (CTC) or Working Tax Credit (WTC), compared to those in non-severe poverty. While the lower receipt of WTC among families of children in severe poverty might be explained by the higher proportion of workless parents among this group, the lower receipt of CTC is surprising since almost all families in this group would be eligible for CTC (they have dependent children and are on low income). We have assumed that all families receiving Income Support also received CTC, since some families who were in receipt of Income Support prior to the introduction of tax credits and were still so doing in the year of our data, 2004–05, had not yet been ‘migrated’ to CTC as originally planned, and continued to receive a single Income Support payment, which did include CTC. The fact that, even after this adjustment, a lower proportion of children in severe poverty than those in non-severe poverty were in families receiving CTC, coupled with an overall higher proportion not being in receipt of any of the above benefits or tax credits, suggests that low take-up of benefits and tax credits might be an issue for families of children in severe poverty.
There is a strong association between parents’ educational attainment and severe child poverty. A considerably higher proportion of mothers of children in severe poverty had no qualification (49 per cent), compared to mothers of children in non-severe poverty (36 per cent) or not in poverty (12 per cent). Correspondingly, only 2 per cent of mothers of children in severe poverty had degree-level qualifications, compared to 22 per cent of mothers of children not in poverty. The patterns for age of leaving full-time education are consistent with those of educational attainment, with children in severe poverty having a considerably higher proportion of mothers who left full-time education before the age of 16 (23 per cent), compared to those in non-severe poverty (17 per cent) or not in poverty (6 per cent). It is possible that the low educational attainment of parents of children in severe poverty might contribute to the low take-up of benefits and tax credits noted in the preceding section.
As might be expected, children in severe poverty are more likely to: live in rented accommodation; have families with no savings or assets; be in a lone-parent family; or come from large families with at least four children. The relationship between age of children, or age of parents, and experience of severe child poverty is not straightforward, but there is some indication that earlier motherhood is associated with higher experience of child poverty, both severe and non-severe.
There is a strong association between ethnic background and experience of severe child poverty. Children of Asian ethnic origin and, to a lesser extent, those of other ethnic minority backgrounds, comprise a disproportionately high proportion of children in severe poverty. A considerably higher proportion of children in severe poverty are from Asian and Asian British ethnic origin (19 per cent) than those in non-severe poverty (10 per cent) or not in poverty (4 per cent). Although the majority of children in severe poverty are of White ethnic origin (68 per cent), the proportions among those in non-severe poverty (83 per cent) or those not in poverty (91 per cent) are significantly higher. This suggests that children of White ethnic origin are less likely to experience severe poverty compared to those of an ethnic minority background.
Finally, the presence of disabled adults in the family is strongly associated with the experience of severe child poverty, but the same does not apply to presence of disabled children. About one third of children in severe poverty (or non-severe poverty) are in families where there are disabled adults, compared to 18 per cent of children not in poverty. The fact that it is the disability of adults, rather than that of children, that is strongly associated with the experience of severe child poverty is not surprising, since it is adult family members who usually engage in economic activities and hence their disability is likely to impact more negatively on the families’ financial resources.
Risk factors for severe child poverty
The characteristics of children in severe poverty discussed in the preceding sections provide a useful overall picture of the profile of children in severe poverty, but do not tell us about the precise risk factors for severe child poverty. This subsection examines the risk factors for severe child poverty, controlling for the effect of other important factors. We recognise that the associations described above may be influenced by the effect of other important related factors. For example, parents with lower educational attainment may be less likely to participate in the labour force, hence it is not straightforward to establish from the bivariate associations whether it is educational attainment or labour force participation that is the important risk factor in severe child poverty.
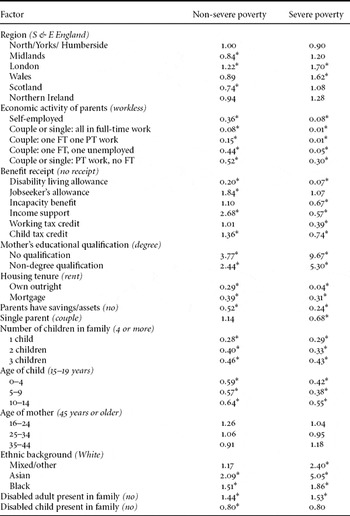
The multinomial logistic regression analysis presented here allows us to examine the factors associated with higher odds of severe child poverty, while holding the other important factors constant. A multinomial logistic model enables us to retain the three categories of the outcome variable: severe poverty, non-severe poverty and not in poverty. Table 7 gives the risk factors for severe and for non-severe poverty, relative to not being in poverty. (The percentage distribution of severe and non-severe child poverty by factors included in the regression analysis is given in Appendix C (available online), while the statistics showing explanatory power of the model – that is, Pseudo R-squared and Likelihood ratio statistics – are given in Appendix D (available online).) A relative risk factor greater than 1.00 implies that the factor is associated with higher likelihood of experience of child poverty than the reference category, while a value less than 1.00 implies a lower risk. For instance, a severe poverty ‘risk factor’ of 1.70 for London suggests that the risk of being in severe poverty is 70 per cent higher in London than in the reference region (South and East England).
Risk factors1 of severe and non-severe child poverty, relative to not being in poverty.

Notes: Unweighted number of cases = 16,012.
‘*’ denotes significance at 5 per cent level; reference categories are given in italics in brackets.
1A relative risk factor greater than 1.00 implies that the factor is associated with higher experience of child poverty than the reference category, while a value less than 1.00 implies a lower risk.
Although some of the variables (for example, benefit receipt and economic activity) are strongly correlated, further investigations showed no evidence of multicollinearity. For instance, the parameter estimates obtained before and after dropping one of the pairs of correlated variables were fairly consistent and stable (low standard errors, all well below 0.5).
The results of the regression analysis are largely consistent with the bivariate associations described in the preceding sections, confirming a relatively high risk of severe poverty among children:
• living in London and Wales
• with workless parents
• whose parents have low educational qualifications
• living in rented accommodation
• whose parents have no savings/assets
• in large families of four or more children
• from ethnic minority groups, especially of Asian origin and
• in families with disabled adult(s).
As might be expected, most of these risk factors apply to non-severe child poverty as well, but to a noticeably lesser extent. For instance, the relative risk factors of severe poverty for children with workless parents (that is, compared to those whose parents are engaged in economic activity as full-time or part-time employees or self-employed) are more than double the risk factors of non-severe poverty. Children whose mothers have no qualification are 9.7 times and 3.8 times more likely to be in severe and non-severe poverty, respectively (as opposed to not being in poverty) than those whose mothers have degree-level qualifications. Also, the risk of severe child poverty among ethnic minority groups is considerably higher (about double) than the risk of non-severe poverty.
The results of the regression analysis suggest that older children aged 15–19 years are significantly more likely to experience severe poverty than the younger age groups. A detailed examination of the experience of severe child poverty by child's age (not shown) suggests that it is the 14–15 year olds who are at the highest risk of severe poverty. This may be partly due to the fact that, while benefits moved away from weighting by age, equivalence scales have not changed, assigning children aged 14 years or older greater weight. The association between mother's age and severe child poverty does not show a straightforward pattern, but there is an indication that children of young mothers aged 16–24 years are the most likely to experience severe or non-severe poverty.
The findings with respect to Disability Living Allowance (DLA) are not surprising. The fact that those in receipt of the DLA are highly unlikely to be in severe or non-severe poverty may be attributable to the fact that the income equivalence scales do not take into account the increased cost of living due to disability. Furthermore, given the amount of time required to complete the FRS survey, it is possible that potential respondents caring for disabled children or adults will be less likely to participate. This may result in a response bias for this group if the DLA recipients who do respond to the survey are better off than non-respondents. Such potential bias is not currently corrected by the standard FRS non-response weights. In the absence of reliable adjustments for the increased cost of living due to disability, coupled with possible non-response bias for this group, we suggest that results relating to receipt of DLA be interpreted with caution.
Discussion and conclusions
This article has adopted a measure of severe child poverty that incorporates both low income and material deprivation. Children are classified as being in ‘severe’ poverty if they are in households with very low income (the ‘poorest poor’: bottom half of income poor at conventional 60 per cent threshold), in combination with ‘severe’ material deprivation (unable to afford at least two adult-related and two child-related necessities). Those in households below 70 per cent of median income, in combination with deprivation of at least one adult and one child necessity, are classified as being in non-severe poverty. The remaining are classified as not being in poverty. Based on this definition, about 5 per cent of children in the UK (0.66 million) are classified as being in severe poverty. This is a fairly conservative estimate of severe child poverty in the UK, with more stringent criteria for classification of severe child poverty than used in previous studies (see, for example, Magadi and Middleton, Reference Magadi and Middleton2007). As is to be expected, the subgroup of children classified as being in severe poverty shows relatively high levels of deprivation on each of the specific child-related or adult-related necessities.
The analysis of characteristics of children in severe poverty largely conforms to expected patterns, increasing our confidence that the severe child poverty measure adopted is indeed identifying the most disadvantaged children. The results show a relatively high risk of severe poverty among children: living in London; with workless parents; whose parents have low educational attainment; living in rented accommodation; whose parents have no savings/assets; in large families of four or more children; from ethnic minority groups, especially of Asian origin; and in families with disabled adult(s).
One interesting pattern relates to children of lone parents who are observed to be more likely to be in non-severe poverty, but less likely to be in severe poverty, compared to children with two parents living together, when other important factors such as economic activity are controlled for. The apparent strong association between having a lone parent and the experience of severe child poverty observed in the bivariate association is largely due to the low economic activity of lone parents. In fact, about half of children with lone parents (52 per cent) are in workless families, while another 27 per cent of lone parents are in part-time work. However, some caution should be exercised in interpreting these results, since a recent study suggests that the equivalence scales used here and in the official income-based measures of poverty tend to overstate the extra resources needed by couples with children, relative to lone parents, to escape material deprivation (Brewer et al., Reference Brewer, Muriel, Phillips and Sibieta2008). Furthermore, further investigations (not shown) showed that a number of factors have significant interactions with lone parenthood, suggesting that the child poverty patterns observed do vary significantly across subgroups of lone parents. For instance, the risk of severe child poverty is elevated for lone parents living in Wales, of black ethnic origin, of older age, or with older children.
The regression results reveal particularly striking patterns with respect to benefit receipt. The link between low take-up of benefits and the experience of severe child poverty warrants special attention. The same patterns do not apply to the experience of non-severe poverty, which does show the expected positive association with respect to receipt of means-tested benefits such as Income Support and Jobseekers Allowance. The fact that non-receipt of Working Tax Credit (after controlling for economic activity) and non-receipt of Income Support are associated with significantly higher experience of severe child poverty may suggest that this is a particularly vulnerable subgroup. These results suggest that benefit take-up is an issue for families experiencing severe child poverty that is worth further investigation. Given the very low income of families with children in severe poverty, one might expect most of these families to be eligible for the means-tested benefits. On the other hand, it is also possible that a disproportionately high proportion of children in severe poverty are in households not eligible for benefit receipt, possibly because they are not treated as resident in the UK, or because their benefits have been suspended due to non-compliance with eligibility requirements.
The link between non-receipt of means-tested benefits and the experience of severe child poverty has important policy implications. The current policy initiatives to reduce child poverty in the UK through provision of various mean-tested benefits or tax credits are unlikely to work for this group. Effective poverty alleviation efforts for this particularly disadvantaged subgroup of the population would require further empirical evidence to better understand their circumstances, including, for example, the reasons for non-receipt of benefits. Incorporating a severe child poverty measure within the on-going government strategy for monitoring child poverty (DWP, 2003) would be an important step forwards.
Acknowledgement
This paper is an extension of an earlier work on measurement of severe child poverty in the UK conducted by the Centre for Research in Social Policy (CRSP) for Save the Children UK (www.savethechildren.org.uk/en/docs/sevchildpovuk.pdf)
Appendices
Appendices are available as supplementary material online at http://journals.cambridge.org/JSP