Introduction
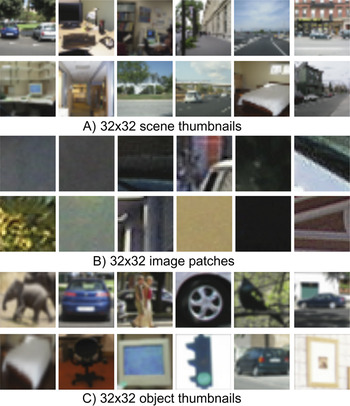
In the images shown in Fig. 1A, we can easily categorize each picture into scene classes (a street, an office, etc.). We can also recognize and segment many of the objects in each image. Interestingly though, these pictures have only 32 × 32 pixels (the entire image is just a vector of 3072 dimensions with 8 bits per dimension), yet at this resolution, the images seem to already contain most of the relevant information needed to support reliable recognition of many objects, regions, and scenes. This observation raises the question of how many pixels are needed to form a meaningful image. In other words, what is the minimal image resolution at which the human visual system can reliably extract the gist of a scene (the scene category and some of the objects that compose the scene)?
(Color online) Scenes, patches, and objects, all at 32 × 32 pixels. Note how rich the scenes (A) and objects (C) are in comparison with the image patches (B).

The gist of the scene (Friedman, Reference Friedman1979; Wolfe, Reference Wolfe1998; Oliva, Reference Oliva, Itti, Rees and Tsotsos2005) refers to a summary of a semantic description of the scene (i.e., its category, its layout, and a few objects that compose the scene). Such a summary may be extracted from very low–resolution image information (Oliva & Schyns, Reference Oliva and Schyns2000; Oliva & Torralba, Reference Oliva and Torralba2001) and, therefore, can be computed very efficiently. Low-dimensional image representations, and short codes for describing images, can be important to explain how the brain recognizes scenes and objects very fast. VanRullen and Thorpe (Reference VanRullen and Thorpe2001a,Reference VanRullen and Thorpeb) have suggested that, given how fast recognition happens (150 ms after stimulus onset), the first stages of recognition might be carried out by strictly feed-forward mechanisms (see also Serre et al., Reference Serre, Oliva and Poggio2007) in which neurons only have time to fire one or two spikes. They discuss that even with such a small amount of information, and when only a small fraction of the neurons fire one spike, it is possible to perform challenging recognition tasks (such as detecting the presence of animals in natural images). Bar (Reference Bar2004, Reference Bar2007) suggests that low spatial frequencies activate expectations that will facilitate bottom-up processing. In Torralba et al. (Reference Torralba, Oliva, Castelhano and Henderson2006), a low-dimensional image representation is used to guide attention incorporating information about the scene context and task constraints.
Studies on face perception (Harmon & Julesz, Reference Harmon and Julesz1973; Bachmann, Reference Bachmann1991; Schyns & Oliva, Reference Schyns and Oliva1997; Sinha et al., Reference Sinha, Balas, Ostrovsky and Russell2006) have shown that when a picture of a face is downsampled to a resolution as low as 16 × 16 pixels, observers are able to perform various face recognition tasks reliably (i.e., identity, gender, emotion). Remarkable performance with low-resolution pictures is also found on scene recognition tasks (Oliva & Schyns, Reference Oliva and Schyns2000; Castelhano & Henderson, Reference Castelhano and Henderson2008).
In this article, we study the minimal resolution required to perform scene recognition and object segmentation in natural images. Note that this problem is distinct from studies investigating scene recognition using very short presentation times and perception at a glance (Potter, Reference Potter1975; Intraub, Reference Intraub1981; Schyns & Oliva, Reference Schyns and Oliva1994; Thorpe et al., Reference Thorpe, Fize and Marlot1996; Oliva & Schyns, Reference Oliva and Schyns1997; Renninger & Malik, Reference Renninger and Malik2004; Rousselet et al., Reference Rousselet, Joubert and Fabre-Thorpe2005; Fei-Fei et al., Reference Fei-Fei, Iyer, Koch and Perona2007; Joubert et al., Reference Joubert, Rousselet, Fize and Fabre-Thorpe2007; Greene & Oliva, Reference Greene and Oliva2009). Here, we are interested in characterizing the amount of information available in an image as a function of the image resolution (there is no constraint on presentation time). In this work, we will show that at very low resolutions, difficult tasks such as object segmentation can be performed reliably.
Patches, objects, and scenes
Fig. 1B shows 32 × 32–pixel patches randomly selected from natural images. A number of studies (Olshausen & Field, Reference Olshausen and Field1996; Lee et al., Reference Lee, Pedersen and Mumford2003; Chandler & Field, Reference Chandler and Field2006) have focused on characterizing the space of natural images by studying the statistics of small image patches such as the ones in Fig. 1B. Those studies helped to understand the receptive fields of visual neurons in early visual areas (Olshausen & Field, Reference Olshausen and Field1996). However, many of these patches do not contain enough information to be recognized as part of a specific object or region as they contain flat surfaces or insufficient edges.
Fig. 1C shows tight crops of objects rescaled at 32 × 32 pixels. These are the kind of images many times used in computer vision to train object detection algorithms. Olshausen et al. (Reference Olshausen, Anderson and Van Essen1993) proposed an attentional system that selected 32 × 32 windows around regions of interest and argued that this was enough for recognizing most objects. Tight object and crops of objects, without background, have also been the focus of many studies in visual cognition. Many of those studies have focused on the study of faces, using image resolution as a way of controlling the amount of global and local information available.
Fig. 1A depicts full scenes (what a human would typically see when standing on the ground and looking at a wide scene), scaled to 32 × 32 pixels. These scenes contain many objects that are surprisingly still recognizable despite the fact that they occupy just a few pixels each. The scene pictures used in this study have biases introduced by the way that photographers tend to take pictures. Although this could be considered as a drawback of our data set, we think that the scene recognition and object segmentation tasks remain challenging and such biases are due to observer constraints and should be taken into account when coding images.
Materials and methods
The images used for this study were drawn from the scenes data set from Oliva and Torralba (Reference Oliva and Torralba2001) and the LabelMe database (Russell et al., Reference Russell, Torralba, Murphy and Freeman2008). In order to cover a large variety of different scenes, we collected 240 images evenly distributed within 12 scene categories. The scene categories included in this study are six outdoor categories (street, highway, seaport, forest, beach, and mountainous landscape) and six indoor categories (corridor, kitchen, bathroom, living room, bedroom, and office). All the images were originally of size 256 × 256 pixels.
For each image, we generated low-resolution images at 4 × 4, 8 × 8, 16 × 16, 32 × 32, 64 × 64, and 128 × 128 pixels. In order to reduce the resolution of each image, we first applied a low-pass binomial filter to each color channel (with kernel [1 4 6 4 1]), and then we downsampled the filtered image by a factor of 2. Next, each pixel of the low-resolution images was quantized to 8 bits for each color channel. For visualization, the low-resolution images were upsampled to 256 × 256 pixels.
Previous studies used a Gaussian filter in order to blur the images. The problem with using a Gaussian filter without downsampling the image is that it is difficult to evaluate the exact amount of information that is available to the observer. By first subsampling the image, the image resolution provides a clear upper bound on the amount of visual information available. In this article, we will use the size of the downsampled image as a measure of the amount of visual information that is available in the blurred images.
Scene recognition
Experiment
There were 28 naïve observers (age ranging from 18 to 40 years) who took part in the scene recognition experiment. They all gave informed consent. The experiment had two conditions, color images and grayscale images: 14 observers participated in the color condition and 14 in the grayscale condition. Each image was shown at one of the six possible resolutions 4 × 4, 8 × 8, 16 × 16, 32 × 32, 64 × 64, and 128 × 128 pixels. All images were upsampled to 256 × 256 pixels for display and shown only once to each observer. The procedure consisted in a 12–alternative choice task: each image was categorized as belonging to one of the 12 possible scene categories. Participants where shown one example of each category in advance. The image was displayed on the screen until the participant made a choice by pressing one of the buttons associated to the 12 scene categories. Each participant saw a total of 240 images presented in random order.
Results
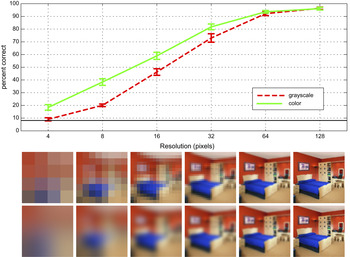
Fig. 2 provides the overall pattern of results in the scene categorization task for the color and grayscale images as a function of image resolution. Below the graph, the top row of images illustrates the number of pixels at each resolution. The lower row shows the images that were presented to the participants during the experiment.
(Color online) Scene recognition as a function of image resolution. Error bars represent 1 s.e. of the mean, obtained from 12 participants for each condition. The vertical axis represents the correct recognition rate, and the horizontal axis corresponds to the image resolution in a logarithmic scale. The black horizontal line represents chance level. The two rows of images illustrate the amount of information available at each resolution. The top row shows the downsampled images at each resolution (from 4 × 4 to 128 × 128 pixels), and the second row shows the images upsampled to 256 × 256 pixels that were shown to the participants.

When images were shown at 128 × 128 pixels, performances were at ceiling, at 96% correct recognition rate. A few of the scene images in our data set are ambiguous in terms of a unique scene category (like a road with a mountain which could be classified as a mountainous landscape or as a highway); therefore, 100% recognition rate is impossible at this task. Chance level in this task is at 8.3%. At a resolution of 4 × 4 pixels, performance for grayscale images was 9% and was not significantly different from chance [t(13) < 1], but classification of color images was significantly higher than grayscale performance [t(26) = 3.8, P < 0.001] with a correct rate of 18.4%.
At very low resolutions 4 × 4 and 8 × 8, there was a strong bias toward selecting the beach category (20% of the time) in both color and grayscale conditions. This response bias was present in early and late trials. At these low resolutions, images that belong to the categories highway and seaport were incorrectly classified as belonging to the beach category. For high resolutions, there were no biases in the responses of the participants.
Scene recognition performance remains high even at relatively low spatial resolutions (in agreement with the results by Oliva and Schyns, Reference Oliva and Schyns2000). Participants had an 81.8% correct recognition rate when color images were presented at a resolution of 32 × 32 pixels. In our study, performance more than 80% is found for an image resolution slightly higher than the one reported in Oliva and Schyns (Reference Oliva and Schyns2000), who used a Gaussian filter and measured the frequency of 50% cutoff instead of the number of pixels in the downsampled image. For grayscale images, performance was at 73% at 32 × 32 pixels. As we lower the resolution, performances drop. There is a significant improvement in recognition accuracy when color is present (Wurm et al., Reference Wurm, Legge, Isenberg and Luebker1993; Oliva & Schyns, Reference Oliva and Schyns2000; Rousselet et al., Reference Rousselet, Joubert and Fabre-Thorpe2005; Castelhano & Henderson, Reference Castelhano and Henderson2008) for low-resolution images.
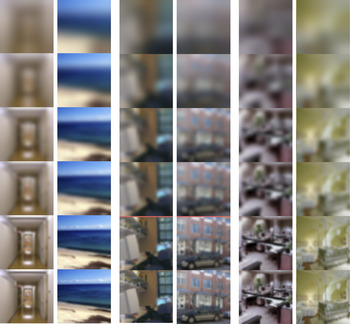
The results presented in Fig. 2 were averaged over all scene types. However, it is important to note that different types of images will lose information at different rates as their resolution decreases. Fig. 3 shows six images, at six resolutions, sorted according to the amount of image resolution needed to enable recognition. As the figure illustrates, some images can be recognized at extremely low resolutions (even when only 8 × 8 pixels are available), as the images on the left in Fig. 3, while others require higher resolution.
(Color online) Images sorted by the amount of resolution required for becoming recognizable. Each row shows images that had been downsampled to a resolution of 12 × 12, 18 × 18, 28 × 28, 42 × 42, and 64 × 64 pixels. The two images on the left (a corridor and a beach) are correctly categorized by most of the participants even at the lowest resolutions. The two images on the right require very high resolution in order to become recognizable (an office and a bedroom). The two images in the center need around 32 × 32 pixels in order to be recognized by most of the participants. Easy images are formed by few surfaces and had diagnostic spatial layouts.

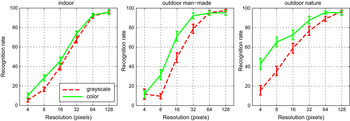
Fig. 4 shows the recognition performances averaged over three groups of scenes: indoor, outdoor man-made, and outdoor natural scenes. Each of these superordinate scene groups has different requirements in terms of resolution and contribution of color information for the scene categorization task. Indoor scenes are the hardest classes of scenes to be recognized. First, we note that the contribution of color information for indoor scenes is marginal compared to the other scene types. Recognition rate at 32 × 32 pixels is 77.8% correct for color images and 67.8% for grayscale images. On the other hand, outdoor man-made scenes have a 92.2% correct recognition rate when presented in color at 32 × 32 pixels and 78.8% when presented in grayscale. For outdoor scenes, the inclusion of color information provides a great improvement on the recognition rate compared to the results on indoor scenes. A similar trend is observed for outdoor natural scenes, although for natural scenes recognition rate remains high even for very low resolutions (at 8 × 8 pixels, performance is still around 65.1%).
(Color online) Performances for the 12-way classification task averaged over indoor scenes (six categories), outdoor man-made environments (street, seaport, and highway), and outdoor natural landscapes (beach, forest, and mountainous landscape). Error bars correspond to the standard error.

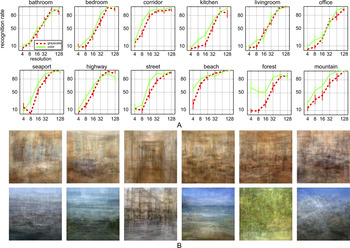
Fig. 5A provides the recognition performance as a function of image resolution for the 12 scene categories used in the experiment. Also, note that adding color information does not improve recognition performance with respect to grayscale images for most indoor categories. On the other hand, color provides a dramatic increase in recognition performance for natural environments, especially at very low resolutions. The contribution of color information is made clear in Fig. 5. Fig. 5 shows the average of all the images that belong to each of the 12 scene categories. The top row represents the indoor categories. Only the corridor category can be easily recognized in this average image. The bottom row represents the six outdoor scene categories used in the experiments. Outdoor categories have a wider distribution of colors that are good predictors of the scene category. In a series of experiments, Oliva and Schyns (Reference Oliva and Schyns2000) showed that diagnostic colors are important in many outdoor categories, particularly natural landscapes, as color of surfaces is a diagnostic feature of the scene category (see also Goffaux et al., Reference Goffaux, Jacques, Mouraux, Oliva, Rossion and Schyns2005; Rousselet et al., Reference Rousselet, Joubert and Fabre-Thorpe2005). However, color becomes less important to differentiate among man-made environments, where the color of objects and surfaces is often accidental and is not constrained by the function or material properties.
(A) Performance on scene recognition for each scene category (chance is at 8.3% correct recognition rate) with grayscale and color images. Error bars correspond to the standard error. (B) Average images of all the scene pictures that belong to each scene category. Each average is obtained and the pixel-wise average of the 20 images in each group. The categories shown are (from left to right and top to bottom): bathroom, bedroom, corridor, kitchen, living room, office, seaport, highway, street, beach, forest, and mountainous landscape.

An important observation is that not all the images can be correctly interpreted at very low resolutions. In order to study the distribution of resolutions needed to reach 80% recognition rate on single images, we performed an item analysis. As we do not have enough data to estimate the performance at each resolution independently, we use a psychometric function to estimate the relationship between recognition performance and image resolution. For each image, we use logistic regression to fit the psychometric function (Klein, Reference Klein2001) relating probability of correct recognition as a function of image resolution (we use this function as it seems to fit the observed data; however, there are several other choices that are also valid). This function is defined by only two parameters (a, b); therefore, it can be estimated with only few samples.

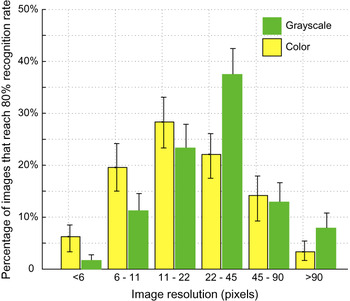
The parameters of this psychometric function are estimated using maximum likelihood. Once the parameters are estimated, we find for each image the minimal resolution needed to reach 80% recognition rate (this is the resolution for with 80% of the participants correctly recognized the scene category). Fig. 6 shows the histogram of image resolutions needed to reach 80% recognition rate for the color and grayscale conditions. Only a very small percentage (3% with color) of the images need high resolution (more than 90 × 90 pixels). For color images, the maximum of the distribution is in the bin between 11 × 11 and 22 × 22 pixels. In this resolution interval, 28% of color images are recognized by 80% of the participants. For grayscale images, 38% of the images are recognized when shown with a resolution between 22 × 22 and 45 × 45 pixels.
(Color online) Distribution of image resolutions for which images are recognizable by 80% of the observers. For resolutions between 6 × 6 and 11 × 11 pixels, there are 20% of color images that are recognizable, while only 11% of the images can be recognized in that resolution range when shown in grayscale.

Object segmentation
Experiment
Fifteen participants performed a total of 1195 trials. For each trial, an image was randomly selected from the set of 240 images described before. Each image was presented at one of the six possible resolutions 4 × 4, 8 × 8, 16 × 16, 32 × 32, 64 × 64, and 128 × 128. For this experiment, images were presented in color.
Participants were first asked to provide the scene category of the image (this part of the experiment was identical to the scene recognition experiment described before), then, participants were asked to segment, using a drawing tool, as many objects and regions as they could recognize in each image. They traced and segmented one region/object at a time, entered its possible name, and then traced a second object, named it, and so forth. The 15 participants annotated a total of 5706 objects–regions.
In this experiment, participants were not given a list of objects to use. Therefore, once the experiment was concluded, we ran a validation procedure to decide which objects were correctly recognized. For this ground truth validation, each object was shown at the original resolution together with the annotation provided by one of the participants. For the validation, the information about the level of blur shown to the participant was not shown to avoid any bias. The images and participants were randomized for the validation stage. The validation was performed by the author.
Results
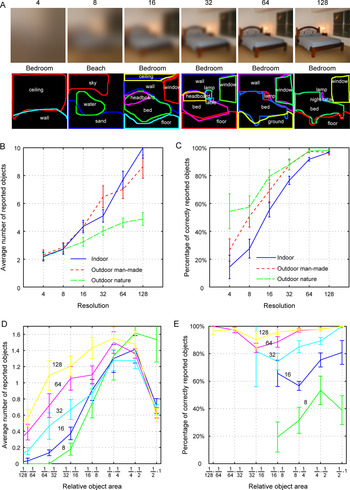
Fig. 7A shows an example image and the segmentations produced by six participants at different resolutions. As the resolution of the image increases, the participants reported more objects, and the reported objects had a higher probability of being correctly recognized. The question that we address here is to find what is the minimal image resolution needed so that participants can extract the information equivalent to the gist of the scene. Oliva (Reference Oliva, Itti, Rees and Tsotsos2005) and Wolfe (Reference Wolfe1998) argued that the gist of the scene might be composed of a coarse representation of the scene layout and a list of four or five objects.
As we increase the resolution, participants report an increasing number of objects (A). The number of objects reported per image seems to increase logarithmically with respect to the image resolution (B). From those objects, the object correctly recognized also increases with resolution reaching 80% around 32 × 32 resolution images (C). (D) Average number of reported objects per image as a function of object size (measured as the proportion of the image occupied by the object). For all image resolutions, most of the reported objects cover an image area in the interval [1/8, 1/4] of the total image size. This is between 12 and 25% of the image size. (E) Recognition rate for reported objects as a function of their size on the image.

Fig. 7B and 7C summarizes the object recognition results for each of the three superordinate scene categories. Fig. 7B gives the number of reported objects as a function of image resolution. As more resolution is available, more objects become recognizable. The number of objects reported seems to grow logarithmically with the image resolution for the three superordinate scene categories. Participants reported fewer objects for natural environments than for man-made environments. Fig. 7C gives the recognition rate for the reported objects.
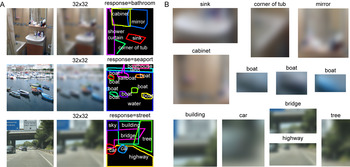
At a resolution of 32 × 32 pixels with color images, participants segmented and named five objects on average with 80% correct recognition rate (across all the superordinate scene categories). Fig. 7D shows the distribution of sizes for the segmented objects. For all image resolutions, most of the reported objects had an area that covered between 1/8 and 1/2 of the image area. Fig. 7E shows that the percentage of correctly recognized objects did not vary a lot between scales despite the large variation of object sizes. Fig. 8A shows several examples of images at 32 × 32 pixels and the segmentations provided by the participants. Fig. 8B shows some of the objects isolated from the scene. Some of the objects are defined by just a few blobs, and recognition is only reliable when they are immersed in the scene.
A shows three images at a resolution of 32 × 32 pixels and the segmentations provided by the participants. B shows some of the recognized objects cropped. Many of those objects become unrecognizable once they are extracted from the surrounding context.

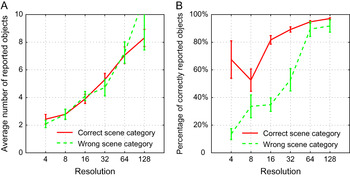
At very low resolutions, recognition is heavily driven by contextual relationships between objects (See Oliva & Torralba, Reference Oliva and Torralba2007, for a review). This point is quantified in Fig. 9. Fig. 9 shows that there is a significant interaction between performances on the scene recognition task and the object segmentation task. Fig. 9 splits the object recognition results depending on whether participants identified correctly the scene prior to the object segmentation task. The number of objects reported did not change when participants misclassified the scene category. On average, for 32 × 32 images, participants segmented five objects independently on whether they assigned the correct or incorrect scene category to the picture. However, object recognition performance drops dramatically for low resolutions. At a resolution of 32 × 32 pixels, the segmented objects were correct 89% of the times when the scene was correctly identified. Performances dropped to 53% when the scene category was wrong. Failing to recognize the scene context has a major effect on object recognition performances at low image resolutions. At high resolution, the effect is not so important. The same trends are observed when the performances are analyzed for the three superordinate scene groups (indoors, man-made outdoor, and natural outdoor).
(Color online) Performance on object recognition as a function of whether the scene was correctly identified or not. (A) Number of objects reported as a function of image resolution. (B) Recognition rate for reported objects as a function of image resolution.

Conclusions
In this article, we have explored two tasks, scene and object recognition as a function of image resolution. We have shown that 32 × 32 color images are already well-formed pictures, with meaningful and recognizable global and local structures. Strikingly, for more than 80% of the images used in our experiments, the gist of the scene (the scene category and the identity and localization of four to five objects that compose the scene) is available with an image resolution of just 32 × 32 color pixels. Even the lowest spatial frequency channels provide enough information for reliable recognition of the scene category, which can, in turn, be used to facilitate subsequent analysis of local regions and smaller objects in the scene.
How is recognition even possible at such low resolutions? A 32 × 32–pixel image represents 0.1% of the information available in a megapixel picture (similar to the number of nerve fibers in the optic nerve). Which image features can support recognition? At a resolution of 32 × 32 pixels, most regular image features generally used to study the activation of the early cortical visual areas such as edges, junctions, and textures are not available or are very weak. A lot of research effort has been devoted to understanding how early visual areas in the brain process fine image structures. However, very low–resolution blobs, particularly colored blobs, provide an incredible amount of information that could guide the processing of high-resolution image detail (Schyns & Oliva, Reference Schyns and Oliva1994; Bar, Reference Bar2007). At low resolutions, the analysis of blob shapes and their spatial relationships become central for understanding the image content. A coding of the contextual relationships between regions is mandatory in order to achieve good recognition performance.
From a computational viewpoint, low-resolution images can be processed very fast and require small amount of memory (Torralba et al., Reference Torralba, Fergus and Freeman2008). The robustness of a short code for describing semantic content of natural images could be an important asset to explain the speed and efficiently at which the human brain comprehends the gist of visual scenes.
Acknowledgments
I thank Aude Oliva, Rob Fergus, Yair Weiss, and Bill Freeman for discussions and two anonymous reviewers for insightful comments. Funding for this research was provided by National Science Foundation (NSF) Career Award (IIS 0747120).