Implications
Survival rate in the first year after calving increased from 8% to 92% between 1989 and 2013. Genetic selection made a positive contribution of 4% for survival, whereas functional survival – adjusted for within-herd production level – declined until 1999 and is since then increasing again. Culling risk increased with older age at first calving (AFC) and decreased with higher production within herd. However, over the years, the effect of AFC and production level on survival in first lactation has reduced significantly.
Introduction
The dairy industry has undergone profound changes in recent decades, that potentially affect the productivity, health and welfare of dairy cows, for example, herd size, use of hired labour, housing system, milk price and use of new technology (Barkema et al., Reference Barkema, von Keyserlingk, Kastelic, Lam, Luby, Roy, LeBlanc, Keefe and Kelton2015). At the same time, milk production per cow has more than doubled in the previous 40 years, and till the end of the last century single trait selection dominated breeding programmes. All these changes over time have stimulated the discussion in Western Europe about the effects of these changes on health and welfare and the underlying lifespan of cows. For example, as discussed in more detail by Veerkamp et al. (Reference Veerkamp, Hill, Stott, Brotherstone and Simm2008), there is clear evidence that genetic selection solely for milk yield has negative consequences for health and fertility, but it is not the absolute milk yield that apparently created the problems (Weigel, Reference Weigel2006; Windig et al., Reference Windig, Calus, Beerda and Veerkamp2006). Also, studies on the trend in longevity over the past decades vary from the opinion that the effect of larger farms and (selection for) higher milk production have decreased the survival rate of dairy cows (Oltenacu and Broom, Reference Oltenacu and Broom2010; Froidmont et al., Reference Froidmont, Mayeres, Picron, Turlot, Planchon and Stilmant2013), to the opinion that improved management and multi-trait genetic selection have had a positive impact on the survival of dairy cows (Dematawewa and Berger, Reference Dematawewa and Berger1998; Dechow and Goodling, Reference Dechow and Goodling2008; Miglior et al., Reference Miglior, Chesnais and Van Doormaal2012). But, apart from the conflicting literature, there is little insight into how longevity has changed over the past decades, and the most important factors that play a role in the culling decisions of dairy farmers.
Culling decisions are likely to be affected by changes in national regulation (e.g. milk quota system), legislation, feed costs, milk price and revenues for culled animals, and therefore culling reasons are likely to have changed over the years or seasons as well. In Europe, a milk quota system was in place from April 1984 until March 2015 in order to limit the amount of milk produced annually per country, but also per farmer (Bergevoet et al., Reference Bergevoet, Ondersteijn, Saatkamp, van Woerkum and Huirne2004). Individual farmers that produced more than the allowed quota, had to pay a penalty for the excess of milk they produced. This system might have affected culling reasons towards the end of the quota year (31 March), because farmers might have decided to cull more cows in order to avoid the penalty. How such a national regulation affected the culling, on a seasonal basis for example, has not yet been investigated.
In the literature, it has been suggested that animals calving in the optimal range of 22 to 26 months for AFC achieved highest lifetime milk yield and longest productive life, and resulted in highest profit per cow (Nilforooshan and Edriss, Reference Nilforooshan and Edriss2004; Froidmont et al., Reference Froidmont, Mayeres, Picron, Turlot, Planchon and Stilmant2013; Wathes et al., Reference Wathes, Pollott, Johnson, Richardson and Cooke2014). But within-herd production level also affects survival. Cows are culled on both voluntary and involuntary bases; the voluntary case is, for example, when the farmer decides to remove a healthy cow for low production, and the involuntary case is, for example, when the farmer is forced to remove the cow because of poor health, injury or poor fertility. With a high level of involuntary culling, a farmer has less opportunity to cull low-producing cows voluntarily. In the past, voluntary culling was assumed to be mainly for milk yield, and there is evidence that low-producing cows are more likely to be culled than high-producing cows (Vollema et al., Reference Vollema, Van der Beek, Harbers and De Jong2000; Sewalem et al., Reference Sewalem, Kistemaker, Ducrocq and Van Doormaal2005; Terawaki and Ducrocq, Reference Terawaki and Ducrocq2009). However, in expanding herds in Wisconsin, for low-producing cows the relative risk for culling decreased during the period 1981–2000, whereas the relative risk increased for high-producing cows (Weigel et al., Reference Weigel, Palmer and Caraviello2003). Hence, in Western Europe it is unclear what the association is between production level, AFC and survival, and whether these associations have changed over decades. For example, breeding goals have changed over the past 15 years, from selection mainly on yield towards selection related to more extensive breeding goals including health, fertility and longevity (Miglior et al., Reference Miglior, Muir and Van Doormaal2005 and Reference Miglior, Chesnais and Van Doormaal2012).
Therefore, the objective of this study was to investigate cow survival in the Netherlands for the period 1989–2013, and whether the associations of survival with season of calving, genetic level of survival, AFC and within-herd production level have changed over these decades.
Material and methods
Data
For this study, survival after first calving was defined: (1) survival until month 12 (surv_12mo), that is, a cow was considered to have survived until month 12 if she did not die and was not culled for slaughter and (2) survival to parity 2 (surv_1st_lac), that is, a cow was considered to have survived her first lactation if she had initiated her second lactation by having at least 1 test day belonging to the second lactation.
We have chosen to analyse survival in early life instead of total lifespan, because surv_12mo had a high genetic correlation (~0.85) with survival up to 72 months (van Pelt et al., Reference Van Pelt, Meuwissen, de Jong and Veerkamp2015), information for surv_12mo and surv_1st_lac is rather more rapidly available for each animal compared with lifespan, and more importantly modelling of the data is less complex. With only first lactation animals without censored information, all animals within a calving year can be compared, instead of comparing a mixture of different age groups at the same time within a herd.
Survival was coded as 1 for animals that survived surv_12mo/surv_1st_lac, and as 0 for animals that died or were culled for slaughter. Data were available from the Dutch/Flemish cattle improvement cooperative (CRV) from 1989 to 2013. Records for survival were constructed from the national movement database considering herdbook-registered cows. Compared to using milk recording information, the use of the movement database allowed accurate differentiating between animals that died, that were slaughtered, that were exported or that moved to another herd. All animals were a combination of at least 87.5% Holstein Friesian and Dutch Friesian, and AFC was between 21 and 40 months. Herds with at least 95% Holstein Friesian and Dutch Friesian genes were selected. Animals were required to have the first observation in month 1 in parity 1; that is, left-censored animals were deleted, because those animals had missing milk production data or changed herds. Data were created for all cows at herd level, containing all milking cows in all age classes. Only herds with at least 30 cows present every month, in the period 1994–2013, were selected in order to exclude herds with a non-conventional culling management, because, for example, the farm stopped operating or the entire herd was culled at once because of an outbreak of a veterinary disease. Due to the exclusion of left-censored animals, selection of herds was not based on the entire period, but started in 1994. Additional requirements were that (1) sires had (i.e. as sire or as maternal grandsire or combined) at least 15 progeny that could have been productive for at least 12 months after first calving, (2) sires had progeny in at least two herds and (3) every herd-year-month class had at least 25 observations. These three additional requirements for progeny per sire, herds per sire and observations per herd-year-month had to be repeated 11 times until the final data set met all three criteria. The creation of the final data set with surv_12mo and surv_1st_lac was as follows: for surv_12mo animals were selected that could have been in the herd for at least 12 months after first calving, that is, animals calving after 31 December 2013 were excluded. The data set with surv_12mo contained 1 108 745 animals. For surv_1st_lac animals were selected that could have been in the herd for at least 18 months after first calving, that is, animals calving after 30 June 2013 were excluded. The data set with surv_1st_lac contained 1 062 276 animals. In both data sets 2185 herds were included. Pedigree information of the sires and maternal grandsires was traced back six generations, resulting in a pedigree file with 11 268 sires.
Statistical model
Two analyses were performed to test the effect on survival for (1) year and season, (2) AFC, within-herd production level, 5-year interval and to estimate the genetic trend. The following base model was used:
 $$y \,{\equals}\, \mu {\plus}{\rm FIXED}{\plus}hys{\plus}\left( {sire{\plus}{1 \over 2}mgs} \right){\plus}e$$
where y is the observation for surv_12mo or surv_1st_lac, μ the overall mean, hys the random effect of herd-year-season of first calving, sire the random effect for sire, mgs the random effect for maternal grandsire and e the residual. The random sire effects were fitted by overlaying the relationship matrix for sire and 1/2 times the maternal grandsire matrix, resulting in one estimate per effect for a sire. Both analyses contained fixed effects for AFC (15 classes: ⩽21, 22, … , 34, ⩾35 months) and percentage of Holstein Friesian genes (five classes: ⩽50.0%, 62.5%, 75.0%, 87.5% and 100%). The other fixed effects differed per analysis.
The first analysis contained fixed effects for year, season and the interaction between year and season; year was year of first calving (1989–2013) and season was season of first calving (winter, 1 January to 31 March; spring, 1 April to 30 June; summer, 1 July to 30 September; autumn, 1 October to 31 December).
The second analysis contained fixed effects for 5-year interval (5-year intervals of first calving were 1989–93, till 2009–13), and the interaction between 5-year interval and AFC. This model was used to analyse survival. The same model was used to analyse functional survival, where survival is adjusted for individual milk production relative to the production level of the herd, and it is suggested as a way to exclude voluntary culling from the breeding value (Robertson, Reference Robertson1966). Therefore, for functional survival the fixed effect for within-herd production level was included, together with the interactions between 5-year interval and within-herd production level, and between AFC and within-herd production level. Within-herd production level was a ranking of animals within a herd by 5-year interval for predicted or realized 305-day yield of combined kg fat and protein, and animals were ranked into seven classes from worst to best, with 1: 1% to 5%, 2: 6% to 20%, 3: 21% to 40%, 4: 41% to 60%, 5: 61% to 80%, 6: 81% to 95% and 7: 96% to 100%. The genetic trend for bulls was obtained by averaging estimated breeding values (EBV) by birth year for bulls that were at least 87.5% Holstein Friesian. The genetic trend for cows was approximated by averaging for each animal 1/2 EBV of sire plus 1/4 EBV of maternal grandsire, as a sire model was used no EBV for the maternal grandam were available.
Effects were estimated with ASReml (Gilmour et al., Reference Gilmour, Gogel, Cullis, Thompson, Butler, Cherry, Collins, Dutkowski, Harding and Haskard2009). Subsequently, in order to compare levels within an effect, corrected for all other effects in the model, y-values were predicted using least squares means of the effects with the PREDICT statement in ASReml (Gilmour et al., Reference Gilmour, Gogel, Cullis, Thompson, Butler, Cherry, Collins, Dutkowski, Harding and Haskard2009). Predicted y-values were tested for significance based on the t-statistic. Fixed effects in the models were tested for significance based on the F-test (P<0.01).
Results
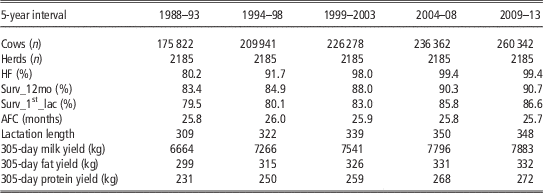
In a 25-year period, the analysed farms showed changes in mean survival rate, but also in herd size and milk production figures (Table 1). When we compare 1989–93 with 2009–13, herd size increased by 48%, percentage Holstein Friesian increased from 80% to nearly 100%, AFC remained stable around 26 months, lactation length increased by 13%, and 305-day production increased by 18% for kg milk, 11% for kg fat and 18% for kg protein. With the increase in herd size and production, surv_12mo increased by 7.3% and surv_1st_lac increased by 7.1%. Overall, the results were comparable for surv_12mo and surv_1st_lac, therefore only results of surv_12mo are presented here.
Number of cows, number of herds, means for percentage of Holstein Friesian (HF), survival rate at 12 months after first calving (surv_12mo), survival rate of first lactation (surv_1st_lac), age at first calving (AFC), lactation length, 305-day yield for milk, fat and protein, divided into five 5-year intervals

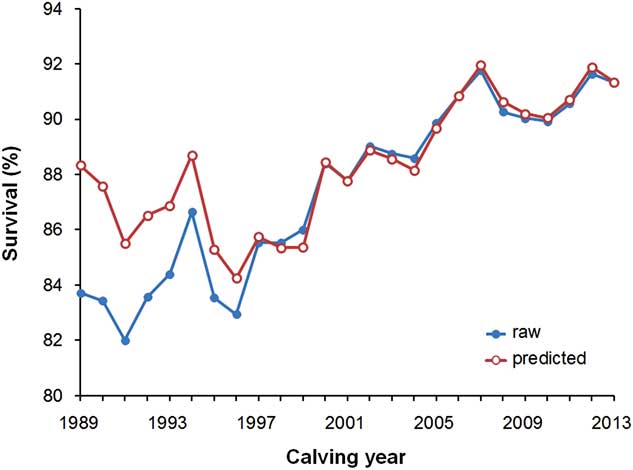
Raw and predicted means for surv_12mo are presented per calving year in Figure 1. Mean survival rate increased phenotypically between 1989 and 2013 by about 8%. Survival rates fluctuated between years, and was lowest in 1991 (82.0%) and highest in 2007 (91.8%). When survival was predicted as the least squares means in the model with effects for year, season and year-season, then there was less variation between years and there was no improvement of survival up to 1999, in contrast to the trend observed in the raw means. The effect in the model that caused this shift in curve was by accounting for the pedigree in the model. We tested this by excluding the pedigree from the model. Not accounting for genetic covariance between records led to a too optimistic trend for survival up to 1999, and improvement between 1991 and 2007 was reduced to 6.5% when accounting for pedigree. The direct effect of Holsteinization was relatively small. Compared with a model without accounting for percentage Holstein Friesian, a model including percentage Holstein Friesian gave predicted means for survival that were lower, the maximum difference was 0.5% between 1989 and 2013, the years where the mean percentage Holstein Friesian differed the most.
Raw and predicted means for survival at 12 months for calving year (reference: 2006).

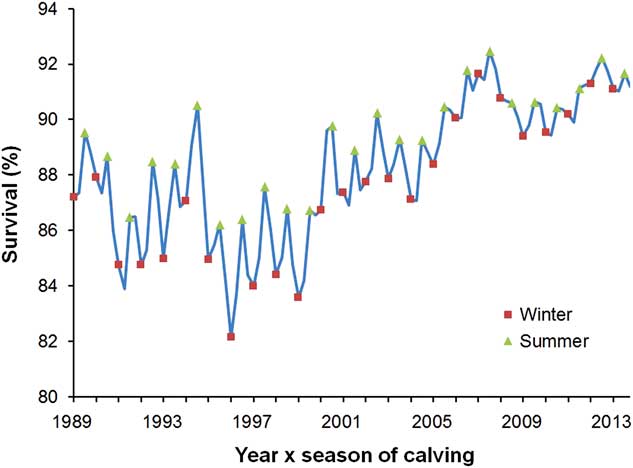
Cows that calved in winter had the lowest survival with 86.8%. Compared with calving in winter, survival was 0.5% higher in spring, 2.0% higher in summer and 0.9% higher in autumn. Within a year, the difference in predicted means for survival between cows calving in summer and winter was 2% or more in 1989–2001, and the largest difference (−5.6%) in this period was between summer 1994 and winter 1995 (Figure 2). In later decades, this difference between summer and winter became much smaller and the difference in predicted means for survival between summer and winter was 1.2% or less in 2009–13.
Predicted means for survival at 12 months for year×season of calving (reference: winter 2006, winters are marked by squares and summers are marked by triangles).

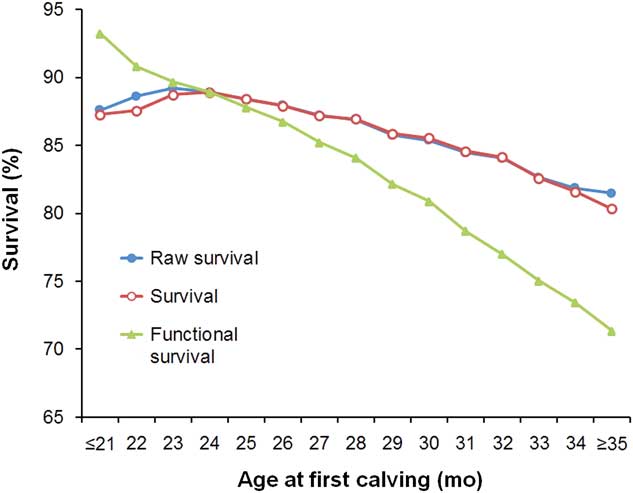
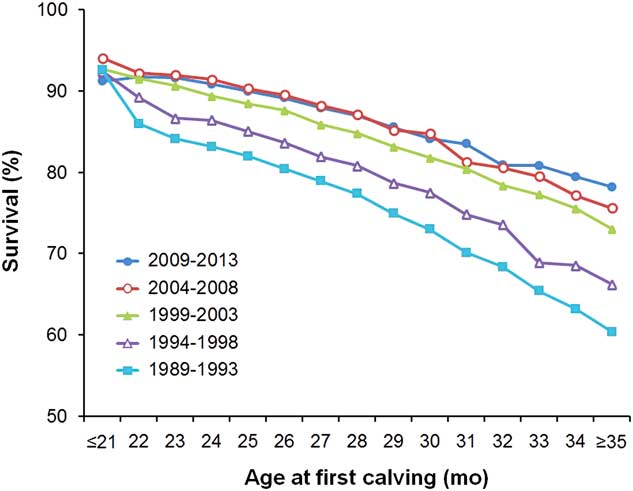
In the raw data, survival showed a clear optimum of 89% at AFC of 23 to 24 months and cows calving at a younger or older age had a lower survival (Figure 3). For predicted means for survival, that is, not adjusted for within-herd production level, the same pattern was observed as for the raw means. However, for functional survival, that is, survival adjusted for within-herd production level, no optimum was observed for survival at 24 months and AFC<24 months resulted in higher survival rates. This suggests that calving at a younger age resulted in a higher survival rate as long as production level was not decreased. Calving at a higher AFC resulted always in a decline in survival rate, especially when production level did not improve. The average decrease in survival rate per extra month AFC was 0.6% for survival and 1.5% for functional survival between AFC of 24 and 32 months. Also over the last decades the effect of AFC on functional survival changed, not only at the level of the intercept, as expected because mean survival increased over the years (Figure 1), but the effect of AFC on survival also reduced (Figure 4). The difference in survival rate between AFC of 24 and 32 months declined from 14.8% in 1989–93 to 10.0% in 2009–13.
Raw means for survival and predicted means for (functional) survival at 12 months for age at first calving (reference: 24 months).

Predicted means for survival at 12 months for age at first calving (reference: 24 months, 2004–08).

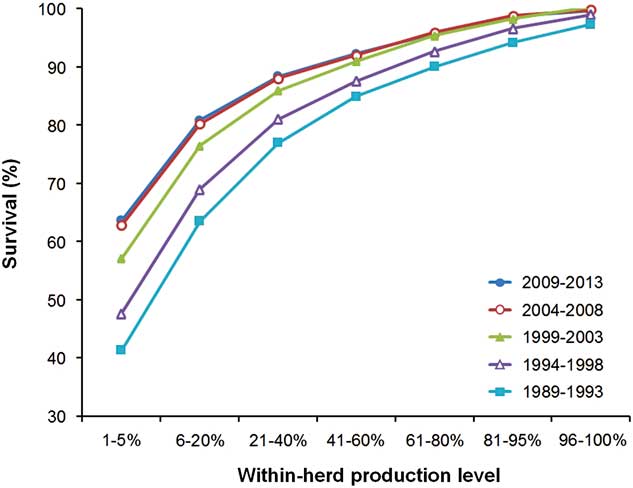
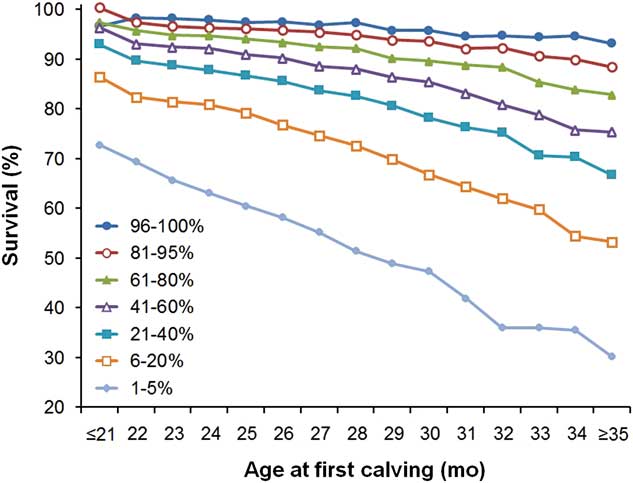
Similar to the effect of AFC on survival, the effect of within-herd production level on survival changed over the past decades (Figure 5). In 1989–93, the difference in survival rate between the lowest (1% to 5%) and average (41% to 60%) within-herd production level was 43.6%, and this difference decreased to 28.6% in 2009–13. In addition, the difference in survival rate between the highest (96% to 100%) and average production level decreased from 12.4% in 1989–93 to 7.4% in 2009–13. Only 41.8% of the lowest-producing cows were surviving the first year in 1989–93, and in 2009–13 this survival rate increased to 64.3%. Hence, these results suggest that the within-herd production level became less important for culling over the past decades. The effect of the interaction between AFC and production level on functional survival (Figure 6) showed that for the high-producing cows, AFC did not influence the survival rate as much as for the low-producing cows. Cows producing below herd-average already had a lowered survival rate, but when they also calved at an older age, 24 v. 32 months, the survival rate decreased faster (−27.1%) compared with high-producing herd mates (−3.1%).
Predicted means for survival at 12 months for within-herd production level per 5-year interval (reference level: 41% to 60%, 2004–08). Class 96% to 100% is the highest within-herd production level.

Predicted means for survival at 12 months for age at first calving per within-herd production level (reference: 24 months, level 41% to 60%). Class 96% to 100% is the highest within-herd production level.

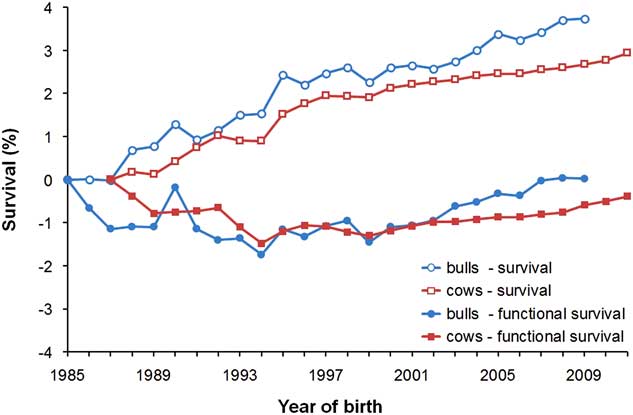
Genetic levels for survival increased over the 25-year period with 3.7% for bulls and 2.9% for cows, and functional survival did not increase for bulls and declined 0.4% for cows (Figure 7). However, there was an interesting difference between survival and functional survival of bulls born between 1985 and 1999. The genetic trend for survival increased (0.16%/year), but genetic progress for functional survival declined over this period (−0.10%/year). Initially, the genetic improvement of the bulls came due to the higher production of their daughters within herd, rather than a better functional survival per se. For survival and functional survival the genetic trend picked up again for the bulls after 1999, and both increased 0.15%/year. Also for cows we see a positive genetic trend since that time albeit lower than the trend for bulls.
Estimates of genetic trend for (functional) survival for Holstein bulls and cows (reference: bulls 1985, cows 1987).

Discussion
The objective of this study was to investigate whether cow survival changed between 1989 and 2013, and whether the associations of survival with year and season of calving, AFC, within-herd production level and genetics have changed over these decades. Analysis of a unique data set collected over the past 25 years, which includes movement records to decide if an animal was really culled or just sold to another farm, demonstrated clear phenotypic and genetic trends over time, but also how trends are affected by taking into account the pedigree or not, or by adjusting for milk yield or not. Furthermore, it was demonstrated how effects of AFC and within-herd milk production interact and changed over time. Although results are based on Dutch dairy cows, results might be applicable to other countries in Western Europe.
To enable proper modelling, and to facilitate the investigation of the effect of milk yield on survival, this study was limited to survival during first lactation only. Obviously, survival in the first year is a prerequisite for a longer lifespan of an animal. However, it is more common to analyse lifespan, and culling during first lactation differs from culling patterns in later lactations (Boettcher et al., Reference Boettcher, Jairath and Dekkers1999; Sewalem et al., Reference Sewalem, Miglior, Kistemaker, Sullivan, Huapaya and Van Doormaal2007; van Pelt et al., Reference Van Pelt, Meuwissen, de Jong and Veerkamp2015). Notwithstanding, we think we can compare these results with full lifespan because surv_12mo had a high genetic correlation (~0.85) with survival up to 72 months, and a similar change as we observed for survival in the first year in genetic trend was observed in the national evaluation for total lifespan, both for bulls and cows (CRV, 2015a and 2015b). Numerically, it is possible to extrapolate survival rate till 12 months to lifespan at 72 months, with some simple assumptions on survival rate during later parities. Van Pelt et al. (Reference Van Pelt, Meuwissen, de Jong and Veerkamp2015) found survival rates (mean across all years in a subset of this data set) for each 12-month period up to 72 months of 0.88, 0.83, 0.77, 0.70, 0.66 and 0.61, and when they were extrapolated they gave an average lifespan of 3.00 years. If we assume that only survival in the first 12 months improved over the past decades, then we expect that a change in survival rate from 84% to 92% at 12 months, which is about the change between intervals 1989–93 and 2009–13, would have increased lifespan by 0.27 years from 2.87 to 3.14 years. However, it could be hypothesized when survival rate in the first year has improved, that survival in later years has improved as well, and the impact on lifespan would be greater. Assuming this improved survival rate across whole lifespan, then lifespan is expected to be improved by 0.79 years from 2.64 to 3.43 years over the last decades. Thus, probably the increase in lifespan over the past 25 years that is predicted from the results in this study is in the range of 0.27 to 0.79 years. Comparing this prediction with the Dutch cow population, lifespan improved by 0.60 years for cows culled during the period 2000–08 (CRV, 2015a).
Only farms that were in business during the entire period (1989–2013) were selected. The advantage was that the effects of year, AFC and within-herd production level could be evaluated across the same farms. In the analysed years, the number of dairy farms in a milk recording scheme decreased in the Netherlands from 30 000 to 15 000 and the number of cows per farm almost doubled from 46 to 87 (CRV, 2015a). The number of cows also increased in the farms that we selected, albeit that this increase was only 48% (Table 1). Therefore, our selection of farms might not be a precise reflection for the whole dairy industry, but the selected farms stayed in business and probably reflect the best sample of farms to evaluate changes in survival rate over these decades.
The peak in survival rate in calving year 2007 coincided with a high milk price in 2008 in the Netherlands (Jongeneel and Van Berkum, Reference Jongeneel and Van Berkum2015). Hence, milk price and economic circumstances were important factors affecting the survival rate of cows and might also explain that heifers calving in summer had on average a 2.0% higher survival than heifers calving in winter. In the Netherlands, dairy factories gave a premium on the milk price for milk produced in fall and winter, and a penalty in spring and summer. Therefore, farmers were likely to be more tolerant in culling their summer calving heifers. However, the opposite results for the seasonal effect were found across countries. In the United States, survival rate for Holstein Friesian was higher for heifers calving in summer and fall (Hadley et al., Reference Hadley, Wolf and Harsh2006). In Wallonia, Belgium, negligible effects of season of calving were found on herd life (Froidmont et al., Reference Froidmont, Mayeres, Picron, Turlot, Planchon and Stilmant2013), whereas in Spain survival rate was higher for heifers calving in winter and spring (Bach, Reference Bach2011). These opposite results for season could be due to climatic differences, where cows in hot climates had impaired reproduction and also had lower survival rates in the hotter summer months (Vitali et al., Reference Vitali, Segnalini, Bertocchi, Bernabucci, Nardone and Lacetera2009). Furthermore, national regulations, like the milk quota system, might have affected seasonal differences. Autumn and winter calving heifers that were not pregnant at the end of the quota year, that is, before 1 April, had a higher risk of being culled compared with summer calving heifers, because the farmer had to decide which cows to cull and especially when exceeding the milk quota. Over the years though, seasonal differences in survival rate became smaller (Figure 2), and it could be argued that farmers were better able to handle the quota system. In the beginning of the quota system, farmers probably culled animals more drastically to avoid exceeding their quota, and over time they became better in planning the introduction of their young stock to the milking herd and consequently better in planning the culling of animals.
The phenotypic increase for survival rate observed in the current study was not consistently found in all countries. In the United States, the phenotypic trend for productive herd life was negative for the past decades (Nieuwhof et al., Reference Nieuwhof, Norman and Dickinson1989; Hare et al., Reference Hare, Norman and Wright2006), apparently because of more intense culling primarily due to management decisions rather than genetics (Hare et al., Reference Hare, Norman and Wright2006). Oltenacu and Algers (Reference Oltenacu and Algers2005) reported that in the United States the proportion of cows still alive at 48 months of age decreased from 80% to 60% for the period 1957–2002. However, survival to second parity stabilized, and similar to our results showed an increase for all analysed breeds since 1996 (Hare et al., Reference Hare, Norman and Wright2006). In Austria, the average herd life decreased by 0.5 years to 3.5 years for the period 1990–2005 (Fürst and Fürst-Waltl, Reference Fürst and Fürst-Waltl2006). The differences between these countries might be partly explained by the introduction of genetic evaluations for longevity since the mid-1990s, for example, in the United Kingdom (Veerkamp et al., Reference Veerkamp, Windig, Calus, Ouweltjes, De Haas and Beerda1995) and in the Netherlands (Vollema et al., Reference Vollema, Van der Beek, Harbers and De Jong2000). Normally, more awareness among farmers arises, AI (artificial insemination) companies excluded inferior bulls and breeding goals change when a genetic evaluation for a new trait is introduced, leading to a change in genetic trend.
In 1999, the genetic evaluation for functional longevity was introduced, and was changed to longevity in 2008 (Van der Linde et al., Reference Van der Linde, Harbers and De Jong2007). Before the introduction of the genetic evaluation there was a strong genetic trend for survival, that was reduced after introduction of the genetic evaluation. However, for functional survival we saw a decline in genetic trend before introduction of the genetic evaluation. After introduction of the genetic evaluation for functional survival a positive trend was observed, which is in line with expectation. The initially strong genetic progress for survival was probably due to a narrow breeding goal with strong emphasis on milk production, and the strong emphasis on increasing yield through heifer selection. That there was no accompanying genetic trend for functional survival during those years is probably due to the well-known association between selection for milk yield only and negative correlated responses for health and fertility (Pryce et al., Reference Pryce, Veerkamp, Thompson, Hill and Simm1997). Thus, genetic progress was due to the fact that sires that inherited a high milk production were used more often and their daughters were favoured during first lactation. This imbalance in the data is adjusted for by taking into account the pedigree structure with both sire and maternal grandsire in the model, which had also a clear impact on the phenotypic trend over those years (Figure 1). Furthermore, 305-day milk production increased from 6664 to 7266 kg between 1989–93 and 1994–98 and increased from 7796 to 7883 kg between 2004–08 and 2009–13. This also demonstrates that increasing milk production per se became of less importance for farmers. Also, in the early 1990s there was a stronger association between within-herd production level and the opportunity to survive (Figure 5), but genetic trend for functional survival declined until birth year 1999 (Figure 7). Another observation was that the genetic trend was sensitive to the inclusion of fixed effects for AFC and within-herd production level in the model. Here we presented the genetic trend from an analysis that included the effects of the interaction of AFC, within-herd production level and 5-year intervals. These effects were clearly important (Figures 4 and 5) in the data. Initially, when AFC was fitted as one fixed effect across 25 years, we saw that genetic trend for functional survival was affected to such an extent that it even declined after 1999. Modelling fixed effects as if these are the same across production levels and years is clearly too simplistic. The effect of AFC on survival had an interaction with 5-year interval (Figure 4) and within-herd production level (Figure 6). Also, within-herd production level is affected directly by AFC, as later calving leads to a higher milk yield (Nor et al., Reference Nor, Steeneveld, van Werven, Mourits and Hogeveen2013). These results show that it is important to adjust survival correctly for milk production and AFC over the years in genetic evaluation and when evaluating genetic trends for longevity of animals properly.
With survival there was an optimum AFC of 23 to 24 months for survival. Also, in most other countries an AFC around 24 months was found to be related with highest survival rate, but also with highest lifetime production: The Netherlands (Nor et al., Reference Nor, Steeneveld, van Werven, Mourits and Hogeveen2013), Wallonia, Belgium (Froidmont et al., Reference Froidmont, Mayeres, Picron, Turlot, Planchon and Stilmant2013), France (Ducrocq, Reference Ducrocq2005), Ireland (Evans et al., Reference Evans, Wallace, Garrick, Dillon, Berry and Olori2006; Berry and Cromie, Reference Berry and Cromie2009), United Kingdom (Wathes et al., Reference Wathes, Pollott, Johnson, Richardson and Cooke2014), Italy (Pirlo et al., Reference Pirlo, Miglior and Speroni2000), Israel (Weller and Ezra, Reference Weller and Ezra2015), Iran (Nilforooshan and Edriss, Reference Nilforooshan and Edriss2004), Australia (Haworth et al., Reference Haworth, Tranter, Chuck, Cheng and Wathes2008) and Canada (Sewalem et al., Reference Sewalem, Kistemaker, Ducrocq and Van Doormaal2005). However, with functional survival, that adjusts all cows to an average production level, no optimum AFC was found for survival. A lower AFC resulted always in a higher survival (Figure 3). Although cows with AFC<24 months tend to have lower within-herd production levels (results not shown), this lower production was why they were culled and not AFC alone. If rearing management ensures sufficient development of heifers before starting to breed them, generally influenced by nutrition and pre-pubertal growth rate during the rearing period (Wathes et al., Reference Wathes, Brickell, Bourne, Swali and Cheng2008), then cows that calve at AFC of 24 months or younger are more likely to survive first lactation than when calving at a higher AFC. Furthermore, AFC offers a good option to improve survival of first lactation animals.
Conclusions
In the Netherlands, survival during first year after first calving increased by 8% up to 92% in the last 25 years, but when accounting for the pedigree, survival showed no improvement up to 1999. Genetically, survival increased 3% to 4% and functional survival did not increase over this period. We found an interesting difference between the genetic trends for survival and functional survival for bulls born between 1985 and 1999, where the trend for survival was increasing, but was negative for functional survival. Since 1999, genetic trend picked up again for both survival and functional survival. AFC, season of calving and within-herd production level affected survival. However, these effects became less important in the most recent years. Based on survival the optimum AFC is around 24 months, but based on functional survival it is better to have an AFC<24 months. Overall, the survival rate of heifers has increased considerably in the past 25 years, initially due to the focus on a high milk production. More recently, the importance of a high milk production has been reduced towards attention on functional survival.
Acknowledgements
The authors acknowledge funding from the Dutch Dairy Board (PZ; Zoetermeer, the Netherlands), Genetic Evaluation for Sires and CRV (Arnhem, The Netherlands), and the Breed4Food project (programme ‘Kennisbasis Dier’, code: KB-12-006.-03-008-ASG-LR).