


Introduction
Water is now seen as a key global resource, seen by many as the dominant resource as we head into the next century. Hence, researchers are emphasizing new studies to evaluate the quantity and quality of this resource. In Quebec, 45% of the total volume precipitation falls as snow and is accumulated on the soil surface for a number of months. Therefore, a spatial and temporal evaluation of snow is essential to allow for an appropriate management of environment and economy.
The method traditionally used to obtain information about snow is a snow survey. However, because of inaccessibility and the large areas that need to be monitored, snow surveys are expensive where accurate estimations of the spatial distribution of the snow-cover variables are required. Combining snow surveys and remote sensing seems to offer an adequate solution, particularly because of the synoptic character of the satellite images. Furthermore, the exploitation of passive microwaves represents an interesting advantage for snow mapping, since the radiometry of this type of data is very sensitive to snow cover. It should also be mentioned that lower-frequency microwaves are relatively independent of atmospheric constraints and solar illumination.
This study is being pursued as part of the CRYSYS (CRYospheric SYStem to monitor global change in Canada program, which has been established to monitor and predict physical impacts on the cryosphere using mainly remote-sensing observations. The CRYSYS program is an interdisciplinary investigation within NASA’s Earth Observing System (EOS). One of the specific scientific goals of CRYSYS is to develop and validate passive- and active-microwave algorithms extracting snow-cover information over varied landscapes.
The first objective of this paper is an evaluation of whether current passive-microwave algorithms can be used for the retrieval of snow water equivalent (SWE) on the La Grande River watershed. Secondly, a particular emphasis in the study was placed on the analysis of SSM/I multi-temporal variations. For this purpose we used SSM/I (Special Sensor Microwave/Images) data from February and March 1994 and 1995, and SSM/I data collected on a weekly basis between October 1995 and March 1996. The results were used to derive a representative map of the SWE for the study area.
Background
In the passive-microwave domain, snow emission is very sensitive to variations in the physical characteristics within the snow cover. For frequencies higher than 15 GHz, snow emission tends to decrease as the snow-cover thickens or the SWE increases (Reference HallikaïnenHallikaïnen, 1984). This decrease is directly linked to the energy redistribution caused by the volume scattering of snow crystals (Reference Ulaby, Moore and FungUlaby and others, 1986). The exploitation of this physical property of snow led to the development of different algorithms to measure its extent and SWE. However, Reference MätzlerMätzler (1994) demonstrated that snow emissivity at 36 GHz has a tendency to increase when water equivalents are higher than 200 mm.
The intensity of the radiation is expressed in terms of brightness temperatures, which means that it relates the surface emissivity (e) to the physical temperature of the objects (Ts) in degrees Kelvin (K). Following the Rayleigh-Jeans law, the brightness temperature at the sensor, which is the apparent brightness temperature TB(app) , is defined as:

where e is the surface emissivity; Ts is the physical temperature of the surface; t is the atmospheric transmissivity; Tup is the upwelling emission of the atmosphere; TDn is the downwelling emission of the atmosphere; and Tcos is the brightness temperature of the cosmic background radiation.
The first observation satellites of the Earth with a passive-microwave sensor on board were Cosmos-243 and -384 launched by the Russians at the end of 1968 and the beginning of the 1970s (Reference Künzi, Patil and RottKünzi and others, 1982). During the 1970s and 1980s, many studies using the Nimbus satellites (Nimbus-5, -6 and -7) have shown the potential of passive microwaves for the study of the snow cover. The first maps of the snow cover were realized for the Northern Hemisphere using data from the NEMS sensor (Reference Künzi and StaelinKünzi and Staelin, 1975) from Nimbus-5. The algorithm used by Reference Künzi and StaelinKünzi and Staelin (1975) was based on a temperature gradient: GT = (Tb31.4 − Tb22.2)/9.2 where Tb31.4 and Tb22.2 are the brightness temperatures at 31.4 and 22.2 GHz.
In the early 1980s, Reference Rott and KünziRott and Künzi (1983) evaluated the potential of the SMMR (Scanning Multichannel Microwave Radiometer) sensor from the Nimbus-7 satellite for the characterization of snow. They found a close relationship between GT (brightness temperature at 18 GHz (Tb18) and 37 GHz (Tb37)) and the SWE and/or the snow-cover depth even though noticeable differences of GT were noted for similar snow depths. Those differences were attributed to snow structure.
During this same period of time Reference Hall, Foester and ChangHall and others (1982) noticed that passive-microwave data were underestimating snow-cover depths in aforested areas. In fact, vegetation has a significant influence on the emissivity of a surface comprising trees and snow, since it is a good microwave emitter, and the snow signal is therefore partially masked by the signal from trees. Reference Hall, Foester and ChangHall and others (1982) developed an index to evaluate snow-cover depths that minimizes the disturbing effect of forest: the subtraction of the effective-brightness temperature of the forest from that of the snow. The temperature of the forest was previously determined by the multiplication of the forest emissivity by the temperature of the air. A correlation coefficient of 0.8 was calculated between the index and snow depth. A strong, positive correlation coefficient (0.83) was also found between forest cover and snow depth. So, these positive relationships suggest that areas of dense forest will also be areas of deeper snow.
Similarly, Finnish researchers have developed expertise in the use of SMMR and SSM/I data for the determination of the SWE for several areas in Finland (Reference HallikaïnenHallikaïnen, 1984; Reference Hallikaïnen and JolmaHallikaïnen and Jolma, 1986, Reference Hallikaïnen and Jolma1992). Since there is a wide variety of land covers, an algorithm was developed that takes this parameter into account for each pixel. More specifically, the algorithm determines the difference of brightness temperature ΔT, by computing the difference between brightness temperatures for frequencies of 19 GHz and 37 GHz (18 and 37 for SSM/I data) for one scene recorded in winter and another recorded during fall. This operation allows surface effects to be distiguished. Considering the variety of land-cover categories, the results are highly satisfactory. The correlation coefficients obtained between SWE and ΔT were 0.48 and 0.77, for the north and the south of Finland (Reference Hallikaïnen and JolmaHallikaïnen and Jolma, 1992).
Work to estimate snow-cover depth has also been conducted for a specific area in Colorado (Reference Chang, Foster and HallChang and others, 1990). The algorithm used to determine snow depth (SD = 1.5*[Tb18 − Tb37]) is based on principles of radiative transfer and Mie scattering theory, and assumes that the snow has a uniform density (0.3 g cm−3) and grain radius (0.30 mm). The Tb18 and Tb37 are the brightness temperatures at 18 and 37 GHHz. A difference has been observed between several sectors of the study area, which are partly due to surface variations and snow structure.
Finally, since the early 1980s, the Canadian Atmospheric Environment Service (AES) has developed expertise on the use of passive microwaves for the evaluation of SWE of dry snow. Since the winter of 1988–89, the AES has been producing maps of SWE for the Canadian Prairies on a weekly basis using SSM/I data. The algorithm used by the AES is partly based on work conducted by Künzi and his colleagues (1982). It comprises calculation of a temperature gradient in vertical polarization (GTV) using frequencies of 37 GHz and 19 GHz (GTV= (Tb37v − Tb19v)/18). Comparisons between GTV and field data have shown a correlation of 0.89 for dry snow areas (Reference Goodison, Walker, Choudhury, Kerr and PampaloniGoodison and Walker, 1995). However, in the same study, relationships calculated from boreal forest data are less significant, since forested areas alter the snow signal so that SWE is underestimated.
The Test Site
The region of interest is located in the James Bay area, within the La Grande River watershed (Fig. 1). This sector divides into three morphological units comprising, from east to west, a coastal plain, an undulating plateau and a mountainous area (Société d’énergie de la baie James, 1987). The first morphological unit consists of a plain approximately 150 km wide that is covered by clay and criss-crossed by streams and small rivers. Several depressions containing peat bogs are also present. The second morphological unit is a plateau with undulating relief that is covered by fluvio-glacial deposits. The relief amplitude is relatively low (15–20 m), and, unlike the coastal plain, has scattered lakes and major rivers. Finally, the third morphological unit is composed of the Ticegamie, Otish and Temiscamie mountains, the summits of which reach heights of between 900 and 1100 m.
La Grande River watershed, northern Quebec(Canada).
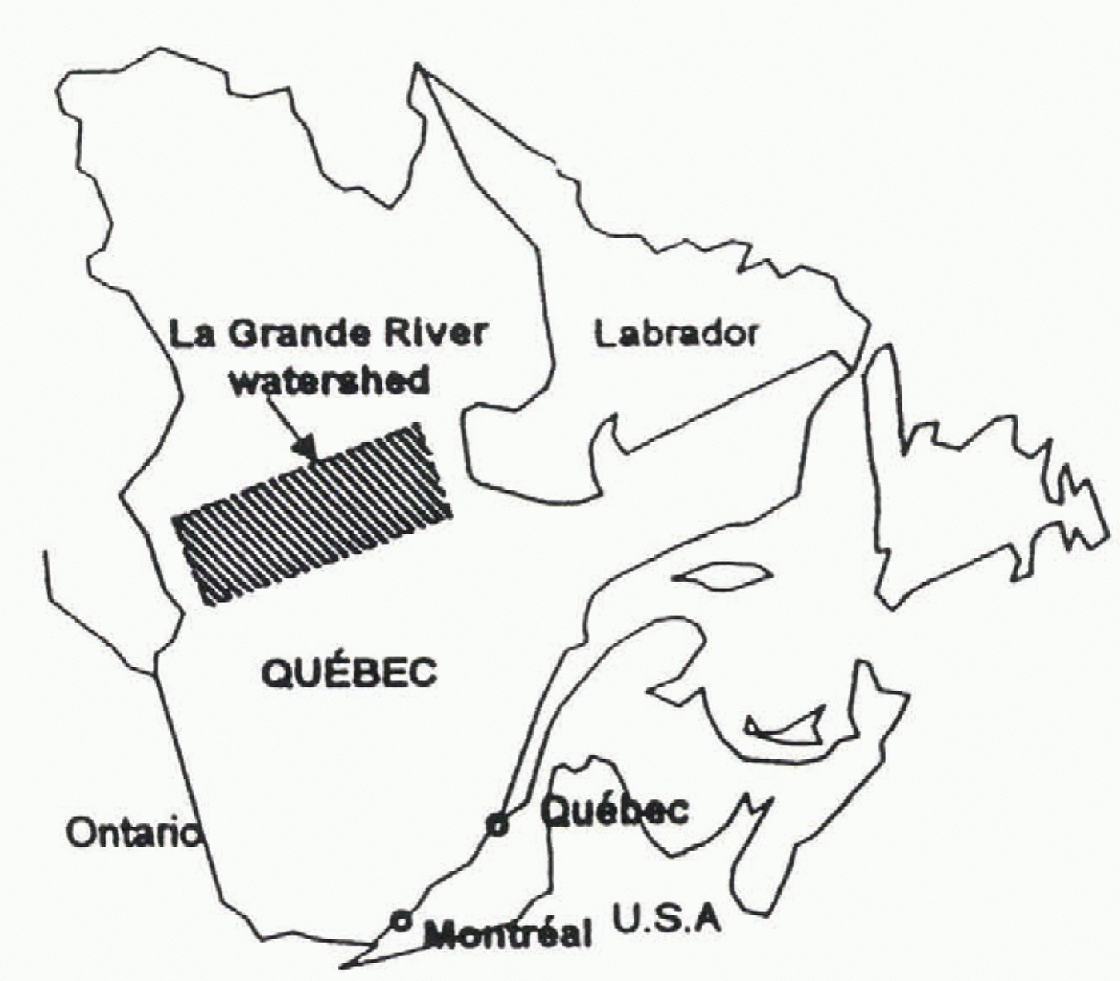
The La Grande River watershed is located in the cold continental climatic region of the subarctic type. Thus, it is characterized by short and mild summers, and by long and rigorous winters. The average annual temperature recorded at the Nitchequon weather station (considered to be the most representative of the region) is −3.8°C.
The annual average snow depth measured at James Bay between 1993 and 1996 was >90 cm. In the case of SWE, the values varied between 18 and 38 cm.
Acquisition Of SSM/I Data And Field Data
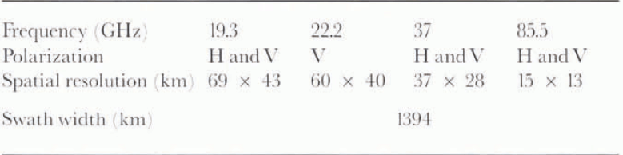
The database used to carry out this study is composed of passive-microwave data provided by SSM/I sensors and field data. SSM/I sensors have been launched aboard the U.S. DMSP Block 5D-2 series of satellites. The data used in this study were acquired by the SSM/I sensors on the DMSP F-11 and F-13 satellites. The spatial resolution varies depending on the Frequency used (Table 1). It is important to mention that the positioning error on SSM/I data is 7 km (Reference Hollinger, Pierce and PoeHollinger and others, 1990).
SSM/I characteristics
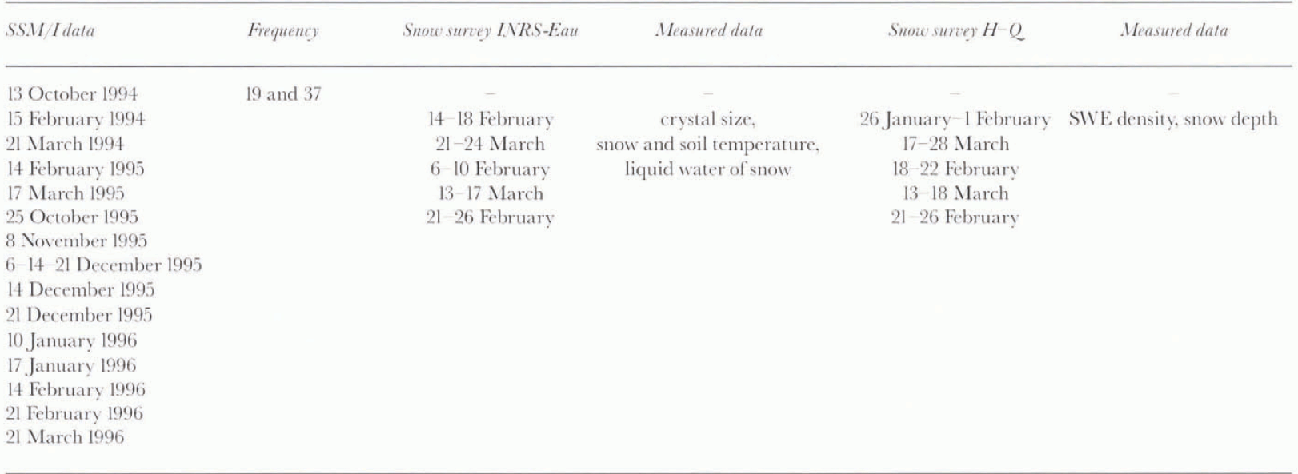
The field data used in the study are from snow surveys conducted by Hydro-Québec (H-Q) on the watershed. During 1994, 1995 and 1996, field campaigns were also carried out in mid-February and mid-March by INRS-Eau and H-Q for a radar (ERS-1) study. These field campaigns allowed the determination of SWE, snow density, and snow-cover depth, as well as other information on snow-cover characteristics (snow-crystal diameter, temperature, liquid water content). Table 2 presents the main characteristics of the SSM/I and field data used.
SSM/I dataset and snow survey
Methodology
In order to fulfill die first objective (assessing whether current passive-microwave algorithms can be used for the retrieval of SWE on the La Grande River watershed), we studied the suitability of the Goodison (Reference Goodison, Walker, Choudhury, Kerr and PampaloniGoodison and Walker, 1995) (AES and Reference HallikaïnenHallikaïnen (1984) algorithms to determine SWE for the area covered by the La Grande River watershed for any given date. To assess this, we compared field data and estimated values from each of the algorithms. A brief description of the algorithms developed by Goodison and Hallikaïnen is as follows.
The Goodison algorithm allows the determination of a temperature gradient in vertical polarization (GTV). This gradient value is obtained by subtracting the brightness temperatures at frequencies of 37 and 19 GHz, and by dividing the result by 18 (Reference Goodison, Walker, Choudhury, Kerr and PampaloniGoodison and Walker, 1995). GTV is therefore expressed as:

In order to estimate SWE, Goddison and Walker 1995 have defined a linear relationship between GTV and the measured SWE:

In the case of the Reference HallikaïnenHallikaïnen, (1984) algorithm, the process involves subtracting a fall image from a winter image for frequencies of 18 and 37 GHz in vertical polarization (V) Reference Hallikaïnen and JolmaHallikaïnen and Jolma, 1986, Reference Hallikaïnen and Jolma1992):

The SWE can also be calculated from the empirical relationship between ΔT and the measured SWE:


For this study, we have chosen the equation derived for southern Finland, since its parameters are more appropriate for the estimation of the SWE on the La Grande River watershed. Since the Hallikaïnen algorithm was developed using Nimbus-7 SMMR 18 and 37 GHz data, we replaced the Tb18v terms in Equation (4) with Tb19v for SSM/I 19 GHz data, where Tb18v and Tb19v are the brightness temperature in vertical polarization at 18 and 19 GHz.
The second objective of the study was to assess the temporal evolution of snow cover. Since the SWE varies from 0 to >380 mm, we compared our results to those of Reference MätzlerMätzler (1994), knowing particularly that Goodison’s algorithm had been derived for shallow Prairie snow covers. The method was to extract values of brightness temperatures for the snow cover at 37 GHz in vertical polarization, and to plot them as a function of field data. In order to compare them with the Mätzler curve, the vertical polarization was chosen because it is less sensitive to variations caused by the multilayered snow cover.
Information on the water equivalent of snow cover for the beginning of winter, in addition to other periods during winter, was not available. To overcome this, we estimated values for SWE from snowfall data measured from October 1995 to March 1996 at three weather stations controlled by Hydro-Québec. The simulations were performed using a simple SWE summation. Since there was no melt period, a more complete model was not necessary.
It is widely known that aerodynamic disturbances caused by the presence of a snow gauge lead to underestimation of snow amount. This underestimation increases with wind speed, and also varies with the type of snow gauge and shelter used. Those used by Hydro-Québec are of the Belfort Type. According to Reference GoodisonGoodison (1978), it is possible to adjust the precipitation data as a function of wind and snow-gauge type by applying an equation. This equation is, in fact, a relation between the gauge catch ratio (gauge catch/ground true) and wind speed (W km h−1). An equation of the polynomial type (Reference GoodisonGoodison, 1978) was applied to the raw precipitation data for October 1995 to March 1996:

Extraction and processing of the SSM/I Data
The available SSM/I data were received in text format, and were geo-referenced in longitude/latitude and contained values of brightness temperatures at 19.3, 22.2 and 37 GHz. To manage the processing of these data, a knowledge of the projection of geographic coordinates and of the interpolation of point files was necessary.
Step 1: Projection of SSM/I Data
SSM/I coordinates (point files) were first mapped using a conical Lambert projection (central meridian 68°N, 90°W, reference latitude 53°N, reference origin 63° N, 90°W).
Step 2: Interpolation of SSM/I Images
The width of an SSM/I orbit is very large (1394 km), which gives an opportunity to obtain data coverage for the study area every day. The orbit location is, however, variable between the acquisition dates. Thus, it is not possible to superimpose two datasets acquired on different dates as the pixel locations are not coincident. To correct this, we have interpolated the brightness-temperature values using the nearest neighbour algorithm. This algorithm was chosen so that the alteration of brightness temperature could be avoided (Reference RichardRichard, 1993).
To fulfill the requirements of this project, we have created sub-images of 31 lines per 29 pixels with a resolution of 25 km for each scene. Those sub-images cover a territory of 561 876 km2, and include the area of interest.
Step 3: Integration of SSM/I Images into a Geographic Information System
The interpolated sub-images were introduced into a geographic information system (GIS) (Idrisi) in order to extract the values of brightness temperatures at selected points, and to execute The mathematical operations required to obtain maps of SWE.
Results
Preliminary evaluation of algorithms
A preliminary evaluation of the Goodison (Reference Goodison, Walker, Choudhury, Kerr and PampaloniGoodison and Walker, 1995) and Reference HallikaïnenHallikaïnen (1984) algorithms was conducted on the La Grande River watershed. Figures 2a and 2b show results obtained from these algorithms using the 1994, 1995 and 1996 SSM/I data. In order to make the comparison easier between these results and the ones obtained by Goodison and Hallikaïnen, the straight-line relations have been superimposed.
Comparison between in situ measurements and the Goodison (a) and Hallikaïnen (b) algorithms.
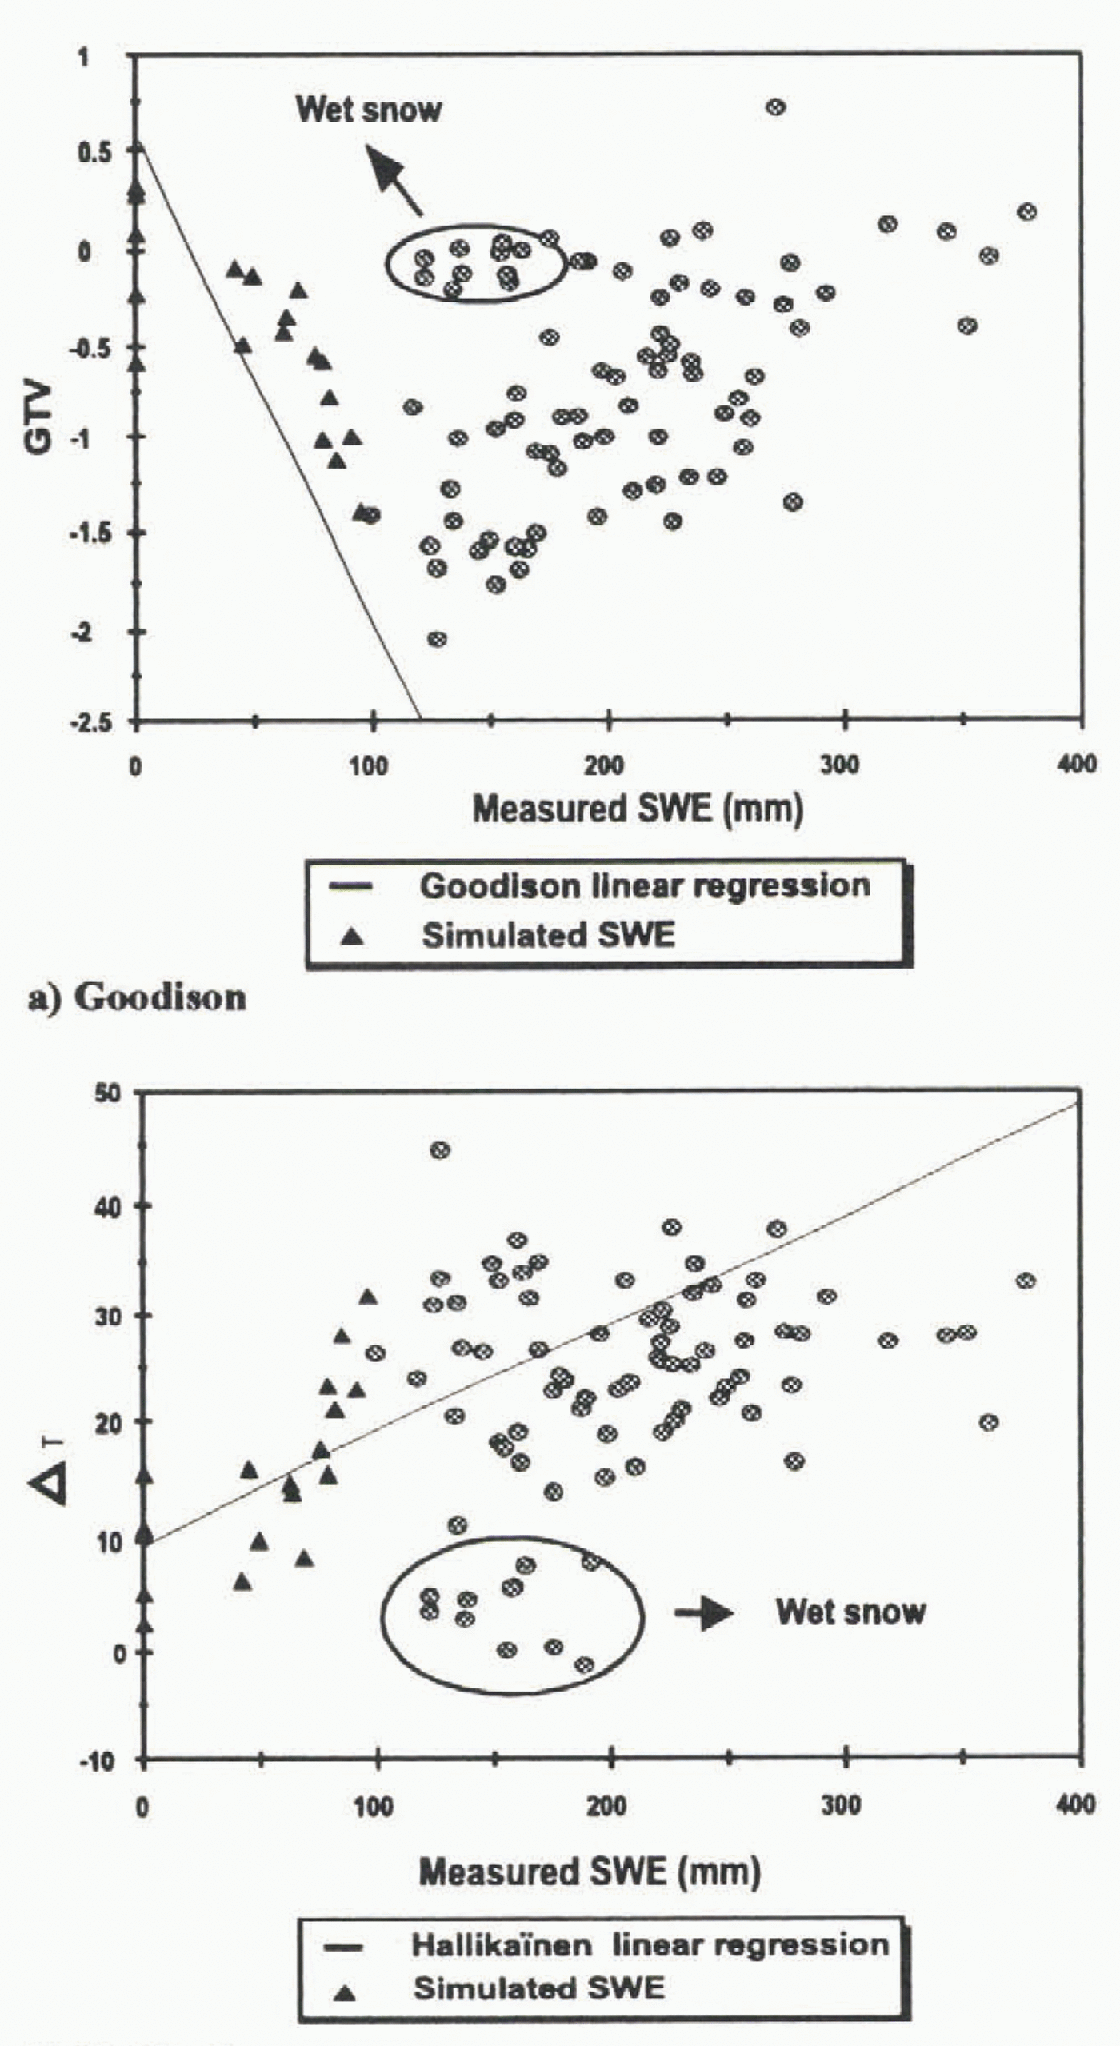
Figures 2a and 2b show that, at first sight, it seems that the Hallikaïnen algorithm is more representative than the Goodison algorithm, although the difference with the suggested theory (relation) is significant in both cases. It can also be seen that wet snow is detected more easily with the Hallikaïnen algorithm than with the Goodison algorithm.
Two reasons explain the distribution of points around the regression line of Goodison and Halliknïnen algorithms: land-cover effect, and the structure of the snow cover.
Studies conducted by Reference Hallikaïnen and JolmaHallikaïnen and Jolma (1986), Reference Hall, Foester and ChangHall and others (1982), and Reference Goodison, Walker, Choudhury, Kerr and PampaloniGoodison and Walker (1995) have shown that snow cover in forests has a higher emissivity than snow cover in unforested areas due to an interaction with trees. A vegetated cover is a good emitter that will attenuate the emission from the underlying snow cover. At the same time, it will contribute by its ow n emission to the signal receiv ed by the satellite. This effect depends on varying forest density and vegetation structure. So. decreasing microwave sensitivity in vegetated areas will obviously lead to an underestimation of the derived SWE. The structure of snow cover also modifies the snow signal. The most important parameters to consider are, the depth of snow cover, SWE and the size of the snow crystals. More details are presented in the next section
Temporal evaluation of the snow cover
As mentioned in previous studies, snow stratigraphy, crystal size, snow depth and SWE have a major effect on the brightness temperatures (Reference Ulaby, Moore and FungUlaby and others, 1986). Actually, it was demonstrated that, for frequencies higher than 15 GHz, brightness temperatures decrease as the snow cover thickens and the crystal size increases (Reference Ulaby, Moore and FungUlaby and others, 1986). This occurs because volume scattering is a prevailing factor for the extinction coefficient.
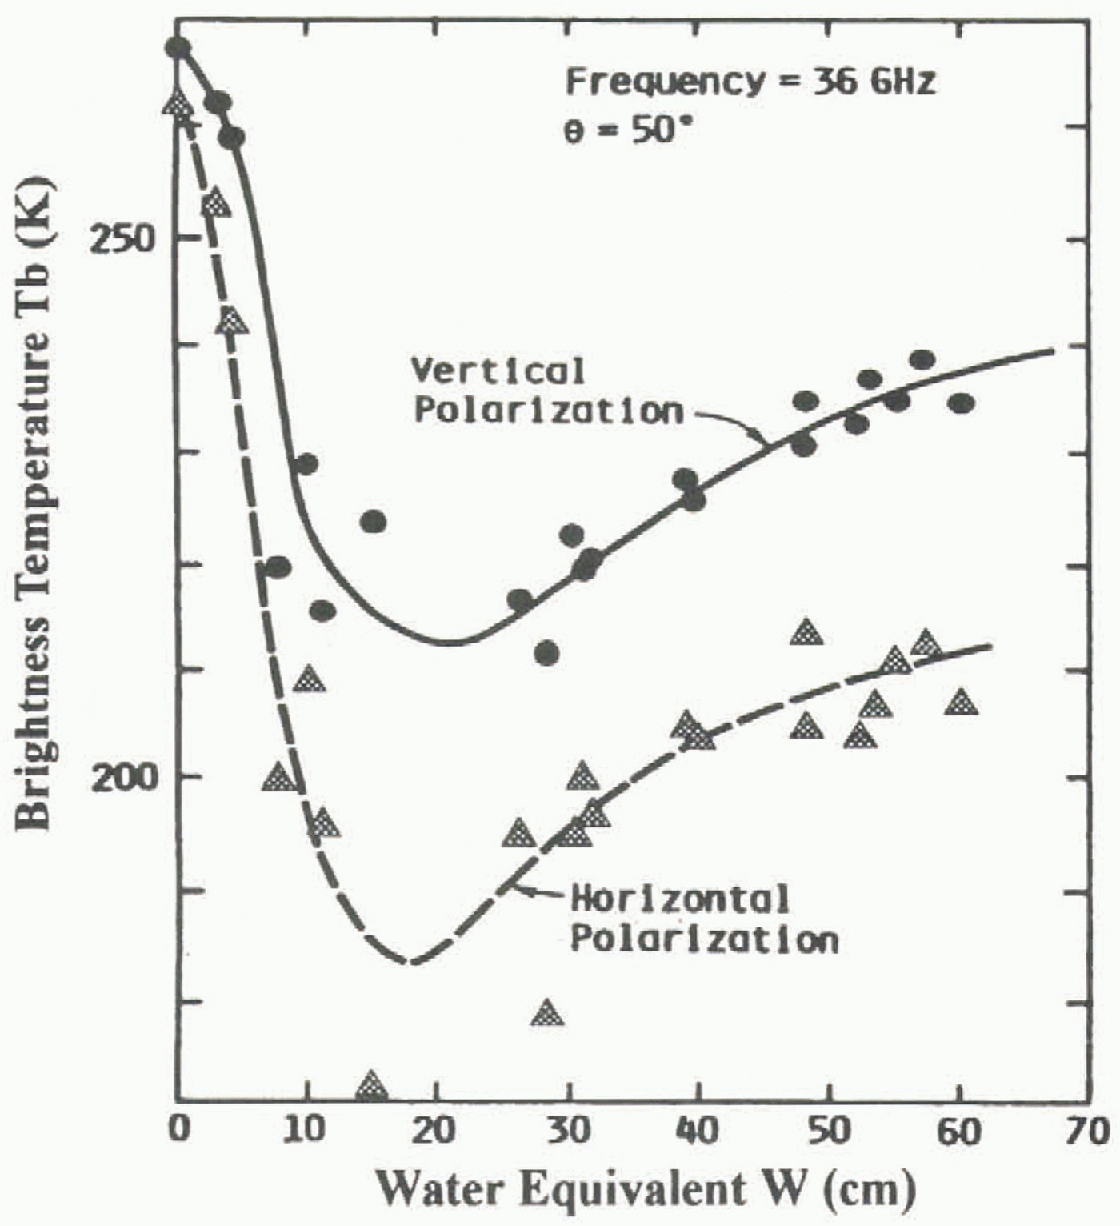
Previous studies in Switzerland by Reference Mätzler, Schanda and GoodMätzler and others, (1982), Reference Schanda, Mätzler and KünziSchanda and others, (1983) and Reference MätzlerMätzler (1994) have shown that for SWE >18 cm, the brightness temperatures have a tendency to increase, causing a positive slope in the relation between SWE and brightness temperature (Fig. 3). The same tendency was observed at the La Grande River watershed in February and much of 1994–96, when we over-layed 37 GHz brightness temperature values to the Mätzler curve. In 1995–96 we obtained weekly images for the area and were thus able to check the agreement with the Mätzler curve from the begining of winter. However, since we had no field campaign for this period, SWE was estimated (Equation (6)) for the following dates: 25 October 1995, 8 November 1995, 6, 14 and 21 December 1995,10, 17, and 24 January 1996 and 14 February 1996. Results are shown in Figure 4.
Mätzler’s relationship between the brightness temperature and the SWE, at 36.6 GHz. Extracted from Schanda and others (1983).
Comparison between SSM/I extracted-brightness temperature from the James Bay area and Mätzler relationship at 37 GHz.
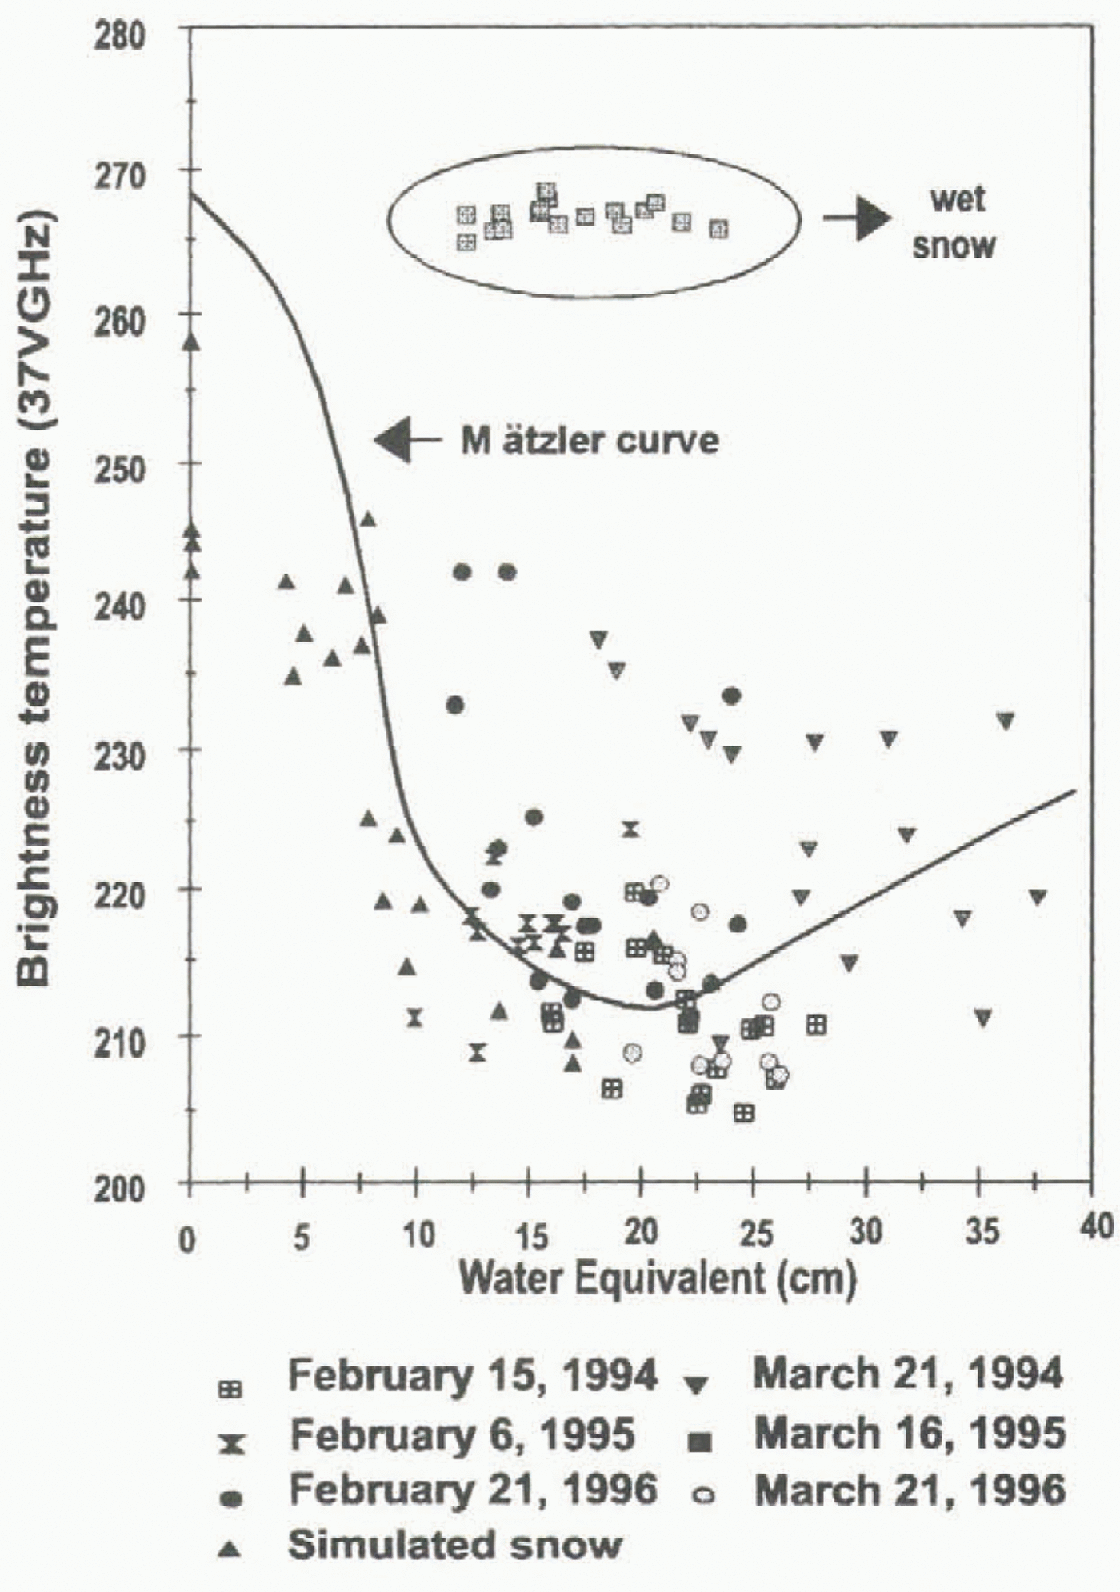
According to Reference MätzlerMätzler (1994) the behavior of the relationship between SWE and brightness temperature (37 GHz) is directly linked to the proportion of large snow crystals in the snow cover. For Rayleigh scattering, the emission decreases proportionaly to the third power of the grain radius. Thus, emissivity is lower for shallow snow cover because the high temperature gradient is responsible for the quick formation of large snow crystals (depth hoar), and increases scattering of the upwelling radiation (Reference Hall, Foester and ChangHall and others, 1991). On the other hand, if there is a very deep snowpack, the penetration depth (p) varies from a few cen timeters to tens of meters, depending on particle size, density and frequency (Reference Ulaby, Moore and FungUlaby and others, 1986). The penetration-depth calculation realised for the James Bay area shows that the average penetration was 65 cm (SWE = 17 cm). So, the upwelling radiation decreases because the radiation comes from the top (65 cm) of the snowpack, which contains more fine-grain snow. This situation leads to an augmentation of emissivity from the snow-pack and explains the reversed relationships.
These circumstances allow a clearer understanding of the differences between our results and those of Goodison and Hallikaïnen for SWE >200 mm. These algorithms were used for environments where SWE was <200 mm, and thus correspond to the first section of the Mätzler curve (Fig. 3). For the La Grande River watershed, the SWE at the end of winter was generally >200 mm, which means that it corresponds to the second section of the Mätzler curve. Therefore, it is not surprising that both the Goodison and Hallikaïnen algorithms did not fit the data.
Land-cover effect
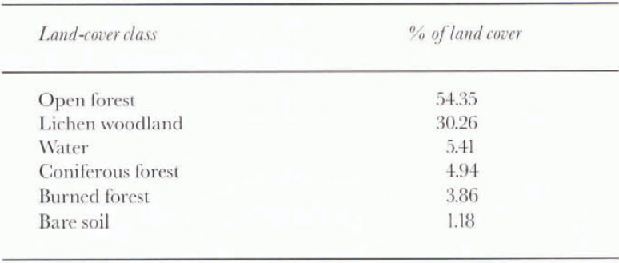
In order to evaluate the effect of land cover on the results, we used a classified AVHRR image. Six land-cover classes were identified for the area: open forest, open lichen woodland, coniferous forest, burned forest, water and bare soil. Because of the large dimensions of an SSM/I pixel, most, if not all of them, have a mixed spectral signature. Table 3 presents a synthesis of land cover for the study area. In general, we noticed that brightness temperatures were slightly higher where the area was dominated by lichen woodland and coniferous-forest land cover.
Categories of land cover
Ice is also an important element to consider. Studies (Reference Hall, Foester and ChangHall and others, 1982) indicate that radiation emanates from deeper within the ice for shorter frequencies than for longer ones in the microwave region. So, for fresh-water ice, the long frequency (37 GHz) senses snow overlying ice. while the shorter frequencies (5, 18 and 22 GHz) sense the entire thickness of ice. Thus, at 37 GHz, the overlying snow is contributing more to the observed emission than is the ice because of the volume scattering of snow. For shorter frequencies snow crystals are not large enough to produce a significani scattering, so the snow appears to be transparent.
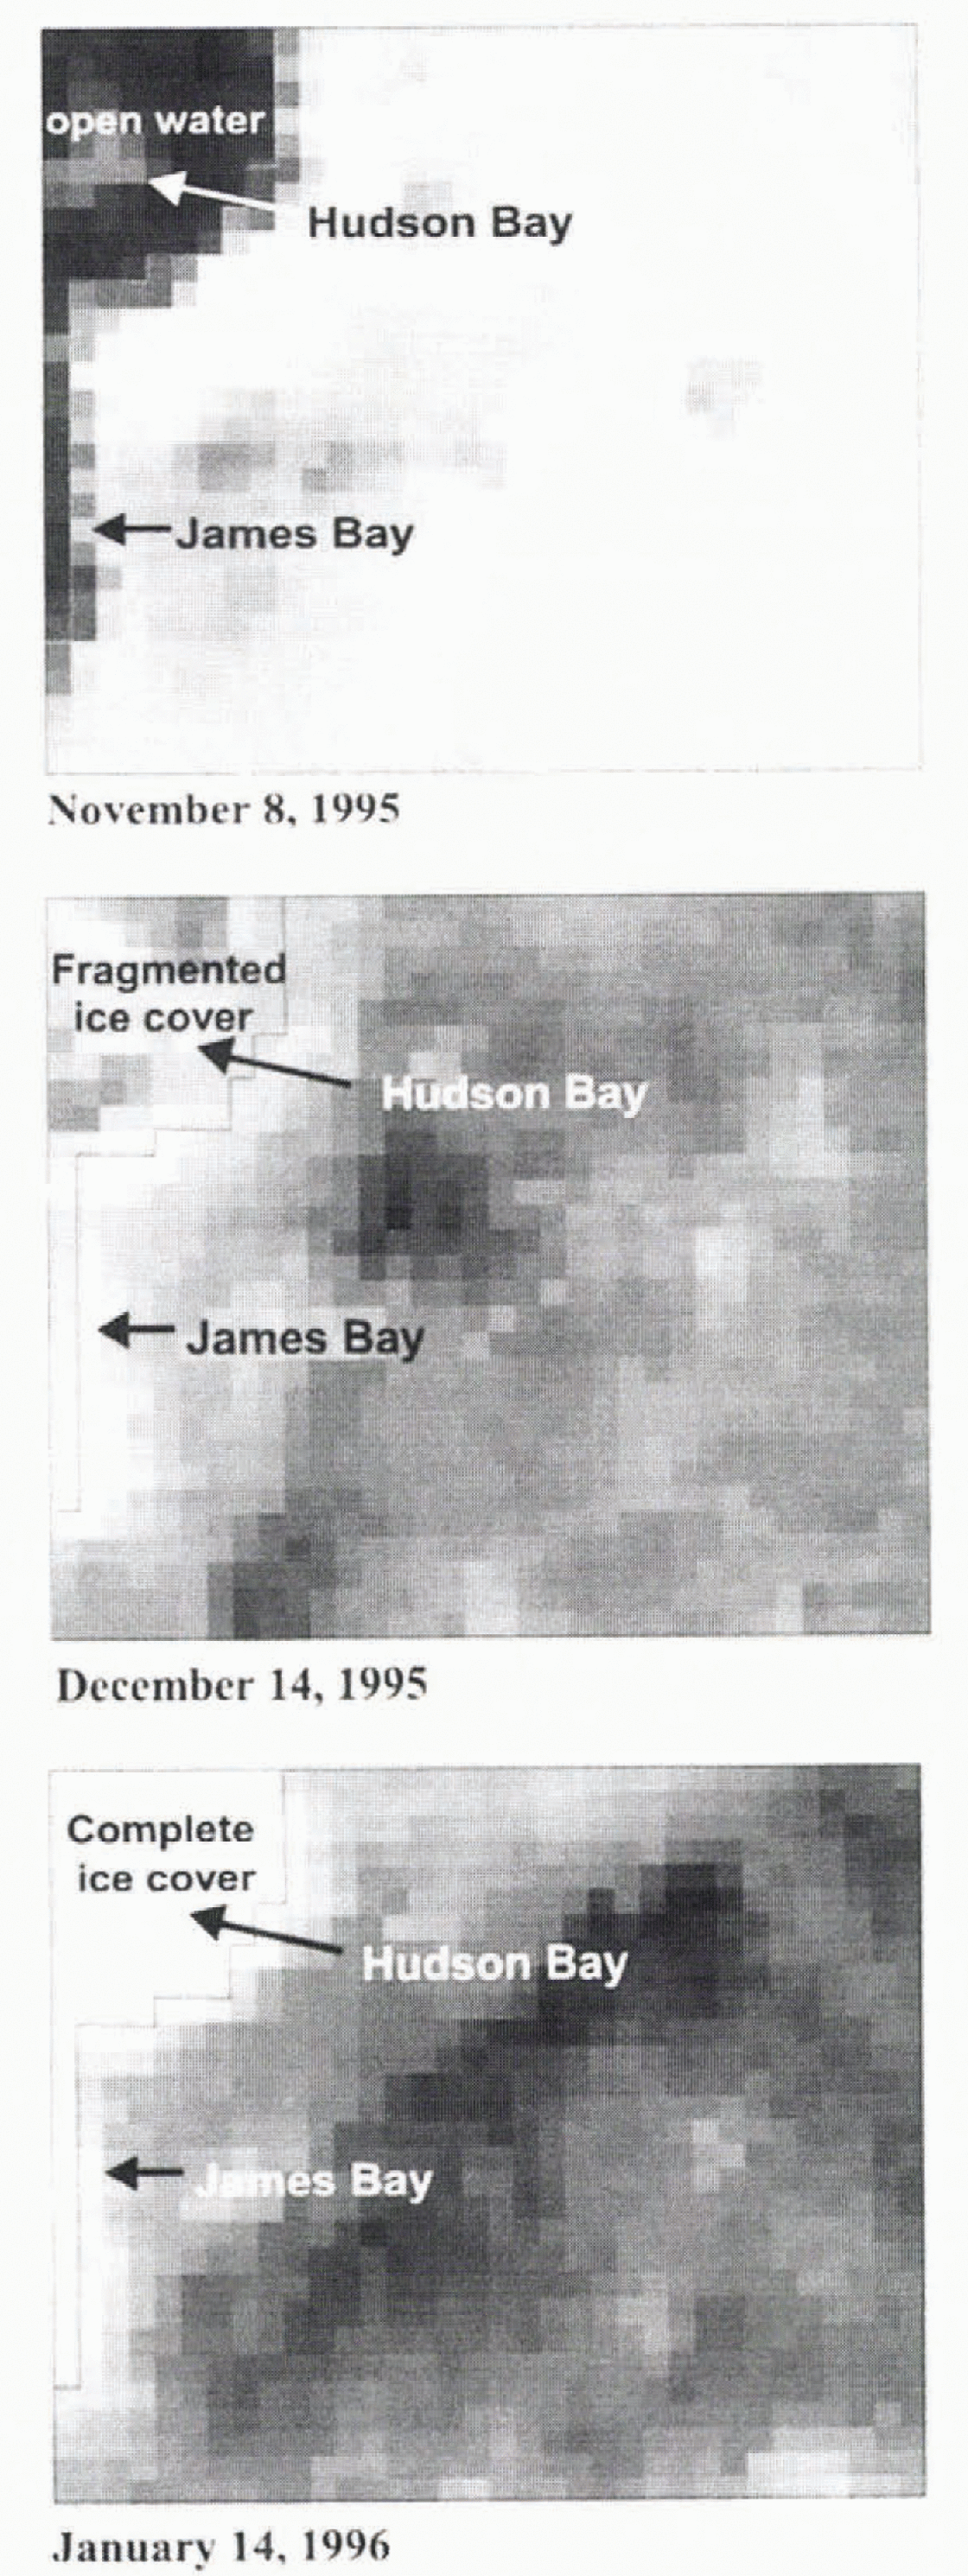
Observations made during the last field campaign (April 1996) indicate that the hydroelectric reservoirs (James Bay and Hudson Bay) are only barely or hardly covered by snow during winter because strong winds continuously remove it. This situation is clearly visible on SSM/I images, as the brightness temperatures (37GHz) are particularly high in relation to the rest of the image. So, when ice-covered hydroelectric reservoirs dominate the land-cover class inside the pixel, brightness temperatures are very high. A similar observation was made by Reference Barry and MaslanikBarry and others (1993) with a time series of Nimbus-7 SMMR images for the Great Slave Lake. In consequence, it was impossible io eval-uate SWE on the reservoirs or die bays. The use of a time series allows the use of SSM/I data to monitor freeze-up and break-up periods (Fig. 5).
Process of ice formation on the Hudson and James Bays for the 1995–96 period. Three dates are shown (a) 8. November 1995—openwater, (b) 14 December 1995—fragmented ice cover, (c) 14 January 1996—complete ice cover.
SWE mapping
As shown in Figure 2, the results from the Goodison and Hallikaïnen algorithms (Equations (2) and (4)) are not in accordance with the experimental data from the La Grande River watershed. Better results are obtained when discriminating between shallow and deep snow covers (Fig. 6.) Considering the snow conditions specific to the James Bay area, two new regressions were obtained for both algorithms—one for a SWE between 0 and 200 mm and another one for SWE >200 mm. The cut-off value between shallow and deep snow covers has been taken from Mätzler curves. The results (Fig. 6a and b) were compared to a simple model (Fig. 6c) called the James Bay model. It consists of the calculation of a brightness-temperature index difference from the results of Goodison and Hallikaïnen, which is simply die difference between a fall image and a winter image at 37 GHz. in vertical polarization. As for the Hallikaïnen algorithm, a fall image was used to minimize the impact of land use:

The following regressions were obtained for values smaller and greater than 200 mm:
Goodison:


Hallikaïnen:


James Bay:


Comparison between Goodison new linear regression (a), Hallikaïnen new regression (b) and James Bay linear regression (c) for shallow and deep snow covers.
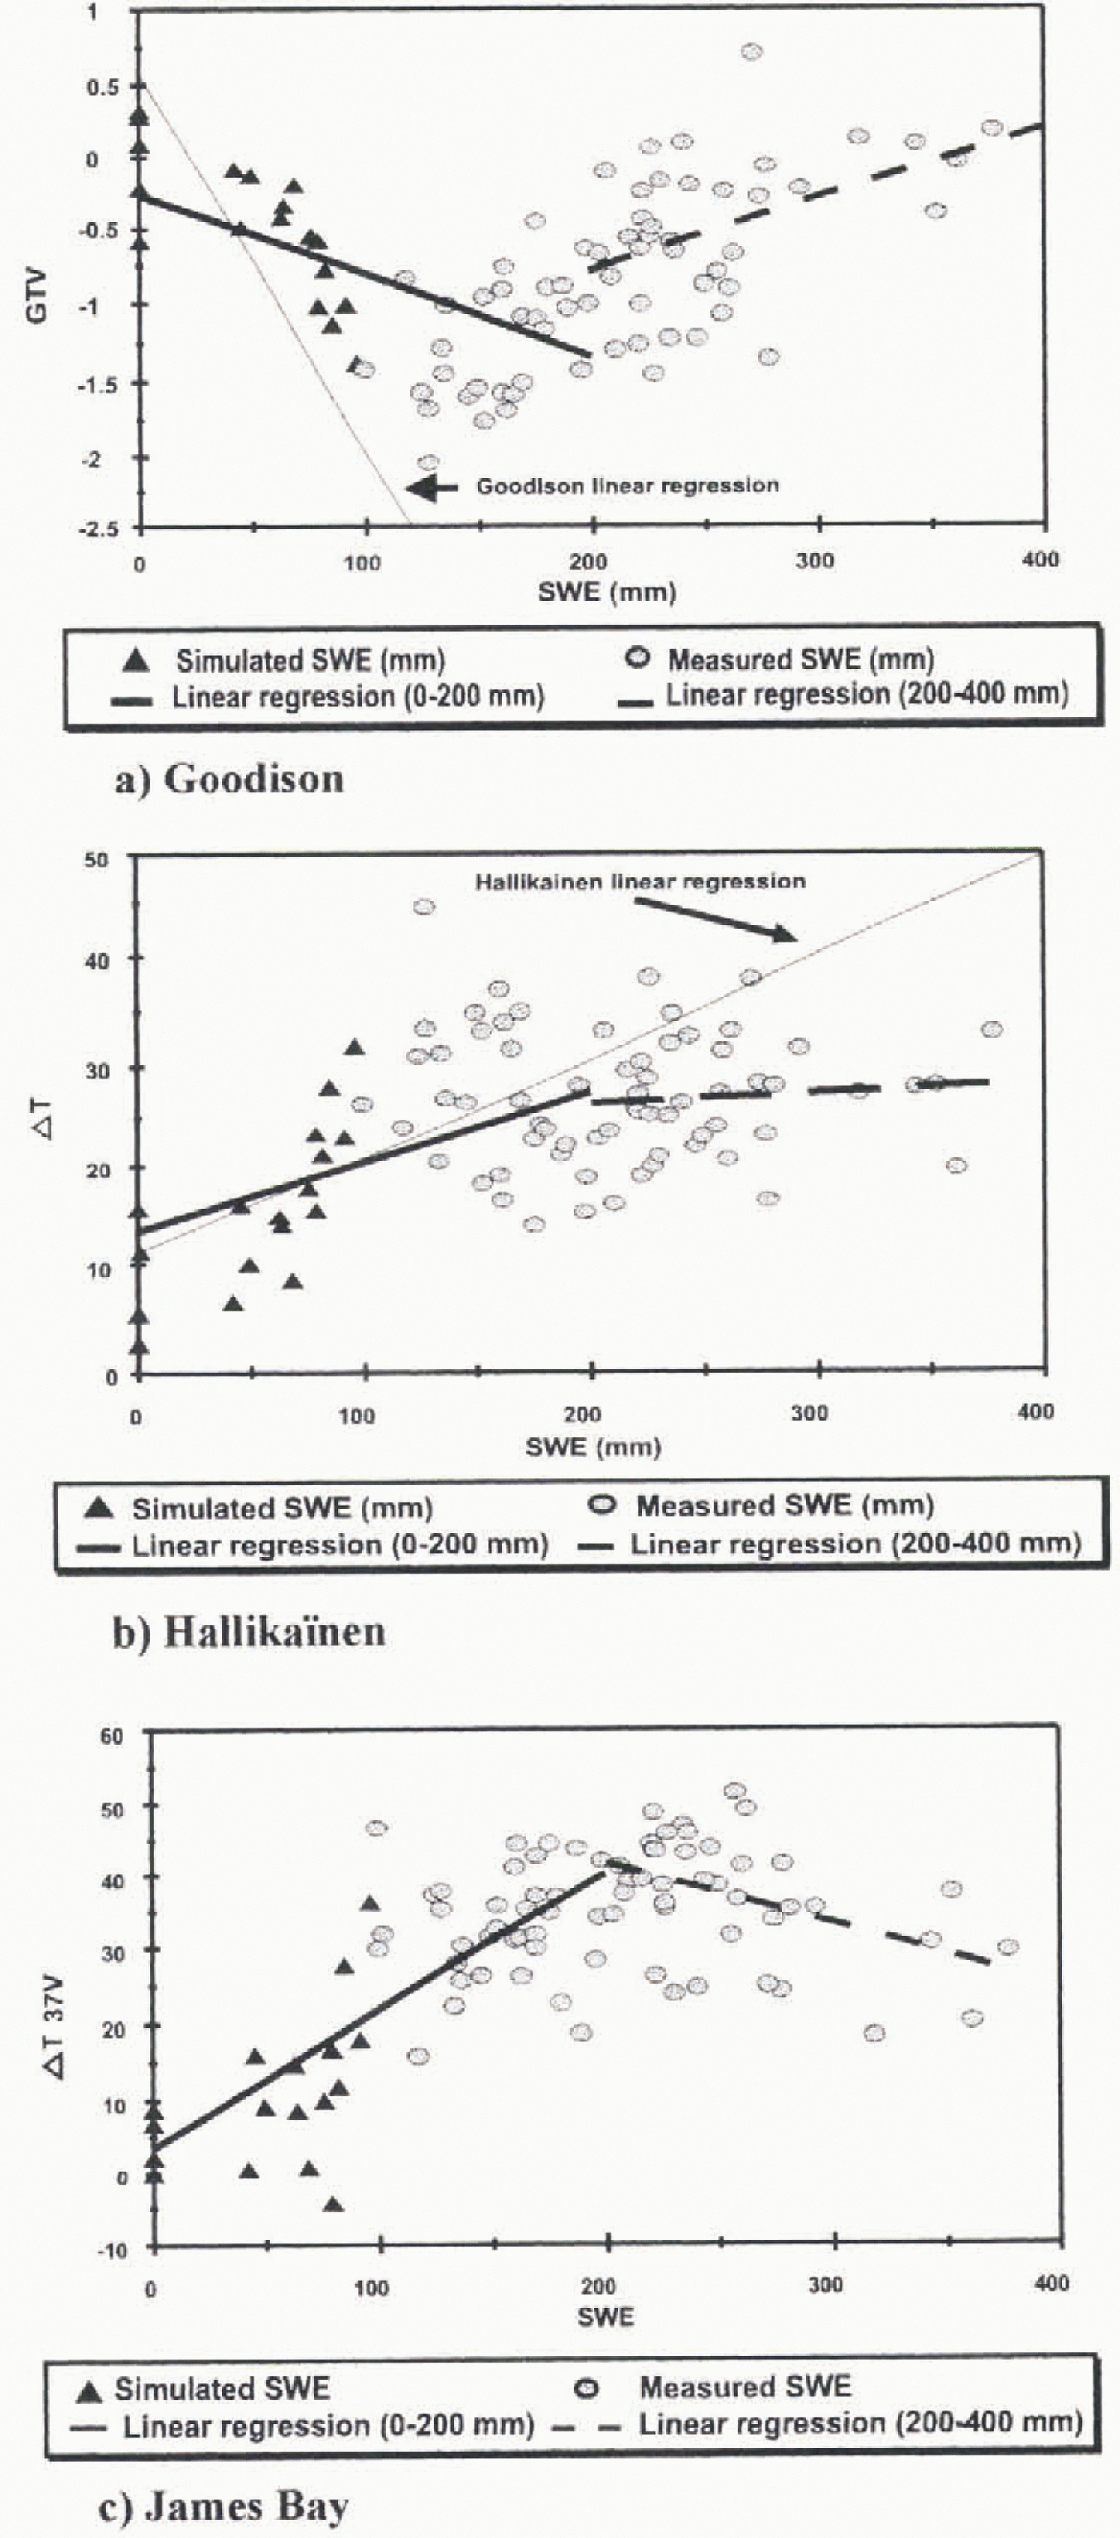
Two points of interest emerge from Figure 6. First, the measured values of the three algorithms are better distributed along the calculated regression lines, since the relationships used are more suitable for the snow cover conditions. Second, the microwave response is particularly more sensi-tive to shallow snow packs (SWE < 200 mm). For values >200 mm, the microwave response is less sensitive to the increase of SWE because of signal saturation. As we explained earlier, this is due to the fact that the depth hoar layer exerts less influence.
In the case of the Goodison algorithm, the new regression line for shallow snow cover has a slope different from that of the original regression. For deeper snow cov ers, the relation is reversed with a smaller slope, so that the Goodison algorithm behaves much like the Mätzler experimental data. The results are different for the Hallikaïnen algorithm, because there is no reversal of the relation, but essentially a decrease in the slope for SWE >200 mm. Also, the regression for deep snow cover is not good. Finally, the James Bay model gives results similar to those of the Goodison algorithm in that the correlation coefficients are good for shallow snow cover (0.76 and 0.61, respectively), but decrease for deeper snow covers (0.44 and 0.43, respectively).
Maps of SWE have been generated for 21 March 1994 using the original Goodison and Hallikaïnen relations and the James Bay relation (Fig. 7). The differences between the SWE estimated by Goodison (Equation (3)) and Hallikaïnen (Equation (5b)), and also by the proposed equation for the James Bay area (Equation (10b)), are obvious. The map produced using the Goodison Equation (3) significantly underestimates SWE. It shows values varying between 25 mm and 100 mm. while measured values of SW E are between 180 mm and !540 mm. In relation to the HalIikainenequation (Equation 5b . figure 7b shows that estimated values for SWE are closer to real values, but are still underestimated. In this case, the values vary from 25 mm to × 300 mm. Finally, Figure 7c shows that the values computed from the James Bay equation (10b) are the most similar to real values, with SWE varving between 200 mm and 300 mm.
SWE maps of 21 March 1994 created with (a) original algorithm from Goodison, (b) original algorithm from Hallikaïnen, (c) James Bay algorithms.

Two reasons explain the weakness of Goodison and Hallikaïnen original relationships to estimate the SWE for the La Grande River watershed. First, the equations were not established from experimental points in this particular area, and second, they were not adapted to the deep snow covers (>200 mm).
Finally, as indicated by Figure 6, the new regression relation for the Goodison algorithm could also furnish good results. The ambiguity arising from the fact that a specific-brightness temperature in the Mätzler, new Goodison and James Bay relations can be associated with two different values of SWE can be easily resolved. The solution comes from a minimal knowledge of the snow season for a particular region. If we are at the beginning of that season, then shallow snow cover is to be expected. If the weather conditions are monitored and the SSM/I data are used in conjunction with a snow-accumulation and melt model, it is even more easy to resolve the ambiguity.
Conclusions
The original relationships established by Goodison and Hallikaïnen underestimate the SWE in the La Grande River watershed. Two reasons explain this: first, the equations were not established from experimental points in this particular area, and second, they were not adapted to the deep snow covers (SWE >200 mm). However algorithms developed by Goddison and Hallikaïnen were able to detect wet snow, particularly the Hallikaïnen algorithm.
Land cover is a parameter that needs to be considered because of its influence on snow emissivity. For the study area, lichen woodland, coniferous forest and frozen lakes Were the land-cover types that had the most influence on the radiometry of the pixels. In the particular case of the reservoirs and James Bay and Hudson Bay, little or no snow was covering the surfaces.
It was found that time series of passive-microwave dala (in this case for the winter of 1995–96) can be used for ice monitoring on the James and Hudson bays as well as on large lakes and reservoirs, as the temperature values differed clearly from the rest of the image.
This study represents an important step in the understanding of the behaviour of deep snow-cover brightness temperatures. In fact, for deep snow covers, the curve shows a positive relationship between SWE and brightness temperature. These findings were used as a reference for the esti-mation of the SWE for the La Grande River watershed. Two regression lines were used to estimate the SWE Ior shallow and deep snow covers. This approach appears to be well adapted to the prevailing snow conditions in this region. However, further studies are needed to validate this approach and improve the algorithm. Future research will concentrate on two major points:
-
1. Analysis of data from other areas to confirm whether the tendency noted when the SWE was >200 mm is maintained. At the same lime, the cut-off value will be reevaluated, since it may have been possible to obtain higher correlation coefficients by lowering the values taken from the Mätzler curve from 200 mm to ~ 150 mm. More data analysis is needed before deciding upon a better cutoff value.
-
2. Analysis of the characieristics of the various land classes on the signal from each pixel, assuming that at least part of the spreading of the experimental points around the regression curves is due to the fact that land-cover characteristics were not taken into account.
Acknowledgements
This research was funded by Environment Canada and the Natural Science and Research Council of Canada. The project was also supported by the Hydro-Québec Society. The authors would like to thank I. Latulippe and M. -C. De Sève for help with the manuscript



