Introduction
In recent years, plaster casts have become a topic of great interest, the subject of conferences, research projects and books, and have revitalised old galleries. Francis Haskell and Nicholas Penny's Reference Haskell and Penny1981 monograph, Taste and the antique, gave new weight to the evaluation of historical casts, paving the way for conferences such as ‘Plaster Casts: Making, Collecting and Displaying from Classical Antiquity to the Present’, held at Oxford University in 2007 (Frederiksen & Marchand Reference Frederiksen and Marchand2010), the renovation of the Cast Gallery at the Ashmolean in 2010, and the 2012 exhibition ‘Cast Contemporaries’, by artist Chris Dorsett and curator Margaret Stewart at the Edinburgh College of Art. The trend continues with the 2018 reopening of the Victoria and Albert Museum's ‘Cast Courts’ display containing the famous cast of Trajan's Column acquired in 1873, as well as the current project between the British Museum and Google Arts and Culture to conserve, digitise and share the nineteenth-century casts of sculptures from ancient Maya sites. Projects such as the latter, involving the three-dimensional (3D) scanning and digitisation of casts, are increasingly common.
Casts are often easier to access than the related original sculptures. Digitisation projects, however, typically assume that casts represent accurate surrogates of the sculptures from which they were moulded. This article seeks to unravel the under-explored relationship between casts and their originals. The most important question for archaeologists using casts as surrogates for the originals concerns their accuracy: do the casts offer a reliable record of the condition of the originals at the time of moulding, and do they contain information now lost from ancient sculptures? To address these questions, this article examines a group of casts and originals of the Parthenon sculptures, employing 3D imaging to examine their surfaces in detail, and to quantify and characterise differences between them.
Casts as surrogates in the nineteenth century
Once dismissed as ‘plaster dinosaurs’, casts made in the nineteenth century are now recognised as significant objects in their own right (Beard Reference Beard1993: 22). Following the lead of Haskell and Penny (Reference Haskell and Penny1981), scholars have explored the range of casts produced, the markets to which they were sold and the ways in which they were created, finished, treated and displayed, revealing a wealth of information relating to nineteenth-century artistic taste, attitudes to sculptural reproduction and the reception of ancient sculpture (e.g. Kurtz Reference Kurtz2000; Wade Reference Wade2018; Payne Reference Payne2019). While their role as surrogates is an important one, there is much more to casts than their ability to reproduce ancient forms. Nevertheless, this reproductive function was central to their creation. Throughout the nineteenth century, plaster-casting, along with photography, was increasingly employed by archaeologists to record and transmit newly discovered ancient works. The German excavations conducted at Olympia from 1875–1881, for example, employed Napoleone Martinelli to make casts (The Times 1876), and when the French School at Athens began major excavations at Delphi in 1892, finds were recorded using photography and through the establishment of a workshop in Athens for the making of moulds (Mulliez Reference Mulliez and Valavanis2007: 151).
Museums and universities became eager to acquire high-quality casts made directly from fresh moulds taken from the originals. The creation of such casts was not just for the purposes of teaching and scholarship, but in many cases formed part of a strategy to record ancient sculptures that were too difficult to move but thought to be at high risk of deterioration. In 1887, for instance, Cecil Harcourt Smith, a curator at the British Museum, marvelled at the ruins of Persepolis, but bemoaned their state of neglect. He wrote to the museum to request funds for the creation of a copy of the sculptures to preserve them “for all time” (Simpson Reference Simpson2000: 28–29). As a result, in 1891 and 1892, Herbert Weld Blundell led an expedition to the city, hiring Lorenzo Giuntini to create the casts (Reports to the Trustees 1887/1888—see Simpson Reference Simpson2000: 28–29).
One of the pioneers in this use of casts, and the inspiration for casting campaigns of the later nineteenth century, was Lord Elgin. The moulds and casts of ancient Greek sculptures that he commissioned during his campaign in Athens were later acquired by the British Museum. These were then supplemented with additional casts of newly discovered, missing pieces of sculpture from the Athenian Acropolis, obtained at various points throughout the nineteenth and twentieth centuries. Their acquisition was inspired both by the desire to show in London the Greek sculptures in their entirety, and out of concern that those originals remaining onsite were rapidly deteriorating (The Illustrated London News 1845; Hawkins Reference Hawkins1852). This nurtured the beginnings of a scheme at the British Museum to use casts to record vulnerable originals.
Elgin's early nineteenth-century casts of the West Frieze of the Parthenon are the primary subject of this article, together with casts of the same section of frieze created later in the same century. The West Frieze is now housed in the Acropolis Museum, but remained in situ on the temple until 1993. It has long been known that the casts derived from Elgin's moulds preserve significantly more detail of the frieze than do the original sculptures. As early as the 1870s, Charles Newton, the Keeper of Greek and Roman Antiquities at the British Museum, noticed differences between the casts and the originals. The relationships, however, between the casts of the 1800s, those of the 1870s and the original sculptures have not been systematically assessed.
Exploring the presence, absence and possible distortions of fine surface details by comparing the casts and originals is an important step in the study of these sculptures. Such research assists in the evaluation of the reliability of the casts and the extent to which detail has truly been lost from the originals. In turn, this information may be used to guide investigation of the state of preservation and the history of deterioration of the originals. Furthermore, it may reveal aspects of the crafting of the sculptures in antiquity, including the tools used, the desired finish and physical characteristics of the subjects rendered.
Creating the Parthenon casts
At the turn of the nineteenth century, the Athenian Acropolis was a hive of activity. Elgin had been appointed as British Ambassador to the Ottoman Empire (1799–1803), and initiated a programme to record the ancient sculptures of Athens. In order to document the monuments and their sculptures in situ, Elgin employed a private secretary, William Richard Hamilton; two artists, Giovanni Battista Lusieri and Theodor Ivanovitch; and two architects, Vincenzo Balestra and Sebastian Ittar. Moreover, following the trend set by eighteenth-century architects (Kockel Reference Kockel, Frederiksen and Marchand2010: 427–30), and paving the way for its widespread adoption by archaeologists, Elgin also appointed two casters (formatori) to make moulds of the sculptures—Bernardino Ledus and Vincenzo Rosati (Smith Reference Smith1916). In this respect, Elgin followed in the footsteps of his French counterpart, the Comte de Choiseul-Gouffier, who had commissioned casts from the antiquary Louis-François-Sébastien Fauvel during his second trip to Asia Minor in 1786 (Zambon Reference Zambon2014).
Controversially, Elgin also removed many original pieces of sculpture from Athens and brought them back to London, where the moulds were cast in plaster in 1808. The subsequent collection was displayed in a London house owned by Elgin. By 1809, Elgin was in financial difficulties and looked to sell the collection to the British government (Smith Reference Smith1916: 297–348). A Select Committee of the House of Commons was convened to discuss the offer. Elgin testified that his primary motivation for removing sculptures from the Acropolis, and for moulding those that remained, was to mitigate the neglect and defacement they were suffering at the hands of the Ottomans. In 1816, Parliament finally agreed to buy the collection and it was transferred to the British Museum (Parliament of Great Britain: House of Commons 1816).
Many of the casts were of the West Frieze of the Parthenon, which was the only whole section of frieze still attached to the building at the time. Elgin removed the first two slabs of the sequence, but the remaining 14 stayed in place until 1993. By 1872, Elgin's early moulds had become worn through continued use, and Newton acquired new casts of the West Frieze, made by Martinelli, from the British Consul Charles Merlin in Athens (Jenkins Reference Jenkins1990: 97). Upon arrival at the British Museum, however, Newton found that a comparison of the Elgin and Merlin casts suggested significant deterioration of the West Frieze during the intervening decades. Following this discovery, the British Museum installed a display of both sets of casts, in which they were deliberately juxtaposed (Jenkins Reference Jenkins1990: 111–12). Public uproar regarding deterioration of the frieze was then provoked in 1929, when The Illustrated London News (1929) published photographs taken by Walter Hege for the German Archaeological Institute in Athens in 1928 of the original in situ frieze, comparing their condition with the corresponding Elgin casts.
3D imaging of originals and casts: methodology
Table 1 lists some of the most significant events to affect the material of the Parthenon and to enable the spread of its sculptures via casts. Together, Newton's testimony and the 1928 photographs strongly suggest that the casts contain valuable archaeological surface information no longer preserved on the originals. These losses to the West Frieze seem to have occurred between 1802, when the Elgin moulds were created, and the 1872 Merlin casts. Given that this part of the frieze remained in situ on the Acropolis for a further 121 years, divergences in the preservation of detail on the originals compared to the casts would now be expected to be even greater. Using comparative 3D imaging, it is possible to investigate these objects in detail.
Salient events in the history of the Parthenon and its West Frieze.

3D imaging facilitates quantitative comparisons of surface morphology between the casts and originals without the interference of external factors, such as lighting, which hinders photographic comparisons (Schwab Reference Schwab and Cosmopoulos2004: 152). A Breuckman smartSCAN with XY (horizontal) resolution of up to 140 microns was used for 3D scanning, and OptoCat software used to process the data and to create stereolithography (STL) files. The smartSCAN is a triangulation-based system that uses structured white light scanning. The configuration employed had a 400mm field-of-view and 1m working distance. Five slabs of Parthenon frieze were identified for comparative 3D imaging, comprising sections of sculpture displaying visible and variable differences between the casts and originals. The original sculptural friezes were scanned at the Acropolis Museum. At the British Museum, where possible, both earlier (Elgin) and later (Merlin) casts of the same original section of frieze were scanned. Sections from four slabs from the West Frieze (III, VIII, XII, XVI) and one from the North Frieze (XXXVI) were imaged. The resulting STL files can be used for standalone visual analysis and can be overlaid to create colour-coded deviation maps, which highlight and quantify differences between corresponding casts and originals. Different maximum deviation limits can be set, revealing varied levels of information.
Comparative analysis is necessarily based on the initial assumption that casts reproduce the originals with a significant degree of accuracy. While some loss of detail inevitably occurs during moulding and casting, Frischer (Reference Frischer, Remondino and Campana2014: 141–44) has demonstrated that a good first-generation cast, from a mould taken directly from the original, will accurately reproduce most of its surface to within 1mm. Although several of the British Museum's Merlin casts are now lost, those remaining are first-generation casts. Upon dismantling the display of Elgin casts at the outbreak of war in 1939, it was discovered that their condition had seriously declined. Consequently, they were moulded in gelatine and two new sets made: one white and one varnished (Jenkins Reference Jenkins1990: 112). As a result, while most of these new casts survive to this day, the ‘Elgin casts’, as they now exist, are no longer first-generation. Gelatine moulds do, however, facilitate extremely close copies and retain the seam lines from the original piece moulds. Based on Frischer's (Reference Frischer, Remondino and Campana2014) findings, it can therefore be hypothesised that deviations from the original of more than 1mm in the Merlin casts and >2mm in the Elgin casts can reasonably be assumed to relate to subsequent deterioration of the originals, or deliberate adaptations by the formatori, rather than loss of detail during the moulding process.
In addition to quantitative comparisons, surface texture was characterised using Gaussian curvature and mean curvature. Gaussian curvature is an algorithmic calculation of curvature used to characterise surface roughness in the 3D models. Zero Gaussian curvature indicates a perfectly smooth surface, whereas positive and negative Gaussian curvature indicate concave and convex features (John Hessler pers. comm.). This is particularly useful for analysing the finish of the sculptures. Mean curvature—the mean of the principal curvatures—can also be used to reveal differences in surface texture. As it involves the calculation of an average, mean curvature is less sensitive than Gaussian curvature. Whereas Gaussian curvature is useful for characterising very fine details, the mean curvature can more effectively illustrate larger features.
Results of 3D imaging
The accuracy of the casts
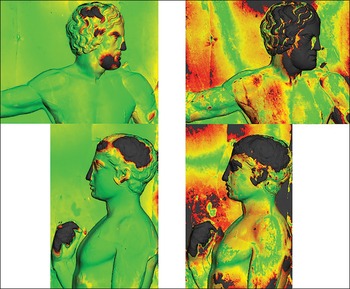
The deviation maps reveal that the casts taken during the nineteenth century were, in most cases, even more accurate than expected, based on Frischer's (Reference Frischer, Remondino and Campana2014) research. Reducing the maximum permitted deviation from 5 to 1mm reveals increasingly fine degrees of difference between the surfaces of the casts and of the originals. Features caused by the moulding process slowly become visible (Figure 1). These include not only the seam lines, but also areas where different sections of the piece-mould are fractionally offset, rather than completely flush. These are, however, very small flaws: the pieces are offset by less than 1mm.
Deviation maps on the left show figures 5 (above) and 6 (below) of West Frieze III at 5mm maximum deviation: greyscale >5mm deviation; red >3mm deviation; yellow >1.5mm deviation; green <1.5mm deviation. Images on the right show the same figures at 1mm maximum deviation: greyscale >1mm; red >0.6 mm; yellow >0.3mm; green <0.3mm. Data applied to Elgin cast (images © E. Payne; 3D imaging conducted courtesy of the Trustees of the British Museum).

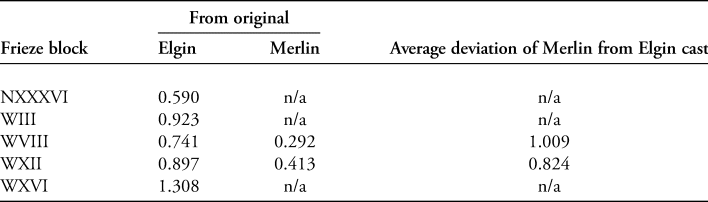
Table 2 shows the average deviation between the casts and the originals. This data excludes substantial changes of more than 5mm, which were probably caused by later damage, rather than poor moulding practice.
Average deviation of analysis areas between the casts and originals (excluding areas >5mm) (mm)

As expected, these results show that the Merlin casts most closely reproduce the original Parthenon sculptures. The Elgin casts, however, are also very accurate, replicating the originals to well within the level of deviation anticipated by Frischer's study. Moreover, the measured levels of deviation in both sets of casts include not only differences caused by the moulding practices of the formatori, but also those resulting from weathering and other damage to the originals that occurred after moulding took place.
The finish of the sculptures
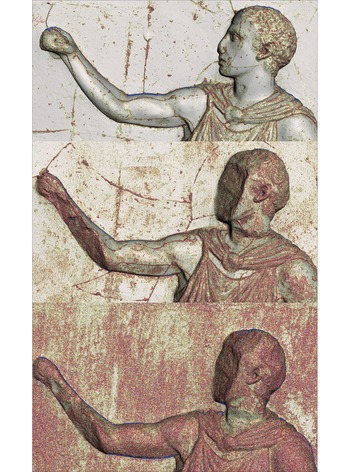
Surface analysis using Gaussian curvature reveals that areas of the original sculptures that were deliberately textured—the hair and clothes of the figures, for example—are noticeably rougher than the smooth planes of skin and background on the frieze. This surface working is more apparent in the casts than the originals, demonstrating not only that fine details of the original sculpture can be closely transmitted to the casts, but also that this change of medium enables textural distinctions to be more effectively analysed. Specular reflection can pose a problem when imaging crystalline, translucent marble surfaces. Plaster is much less reflective and promotes higher-quality 3D models (Frischer Reference Frischer, Remondino and Campana2014: 141) (Figure 2).
3D models of figure 23 (West Frieze XII) with indicated Gaussian curvature: top) Elgin cast; middle) Merlin cast; bottom) original sculpture. In the casts, the textured surface of the clothing and hair is clearly revealed. In the original sculpture, surface noise caused by the reflective quality of the marble prevents effective characterisation of texture. Image key: green-blue) positive Gaussian curvature; yellow-red) negative Gaussian curvature; grey) zero Gaussian curvature (images © E. Payne; 3D imaging conducted courtesy of the Trustees of the British Museum and the Acropolis Museum).

Evidence of deterioration between the casts and originals
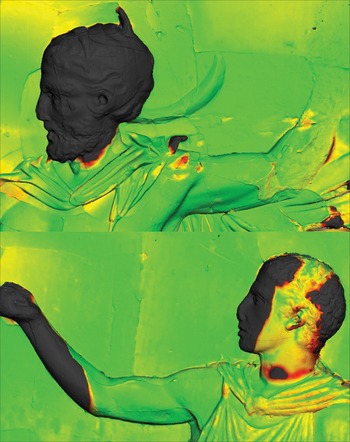
The Elgin cast of West Frieze XVI shows the greatest average deviation from the original. Located at the end of the frieze, this slab appears to have suffered severely from weathering. The Elgin casts all reveal much sharper and crisper features than either the Merlin casts or the originals. This is particularly pronounced in West Frieze VIII and XII. In the former case, the entire head of figure 15 is present in the Elgin cast, but is missing in both the Merlin cast and the original. Similarly, in West Frieze XII, the face of figure 23 is present in the Elgin cast, but is missing in the Merlin cast and the original (Figure 3). While more limited differences in facial features are observed in figures 5 and 6 of West Frieze III, these losses are all greater than 5mm (Figure 1).
Deviation maps of figure 15 (above: West Frieze VIII) and figure 23 (below: West Frieze XII) at 5mm maximum deviation: greyscale >5mm deviation; red >3mm deviation; yellow >1.5mm deviation; green <1.5mm deviation. Data applied to Elgin casts (images © E. Payne; 3D imaging conducted courtesy of the Trustees of the British Museum).

Characterising the differences between the casts and the originals
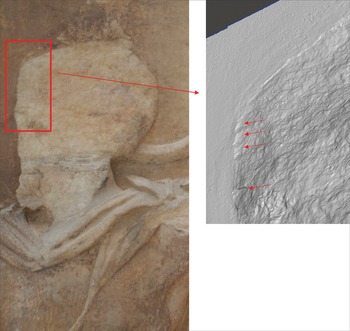
The head of figure 15 in West Frieze VIII appears to have broken cleanly away from the stone. Such fractures can occur naturally, typically because of inclusions within the marble, such as alumino-silicate veins. As these erode differently from the main calcitic matrix, large cracks and fractures can occur, along with exfoliation, in which layers parallel to the surface begin to separate and sheer away. In this instance, however, a deliberate act of vandalism is more likely. The 3D image of the original reveals traces of chisel marks around the edges of the missing area (Figure 4)—evidence that may support Elgin's claim that these heads were specifically targeted for petty attacks, lime production and removal for sale to collectors (Parliament of Great Britain: House of Commons 1816: 41). It is similarly conceivable that at least some of the losses from West Frieze XII are the result of human action. While less pronounced than that of figure 15 on Frieze XIII, the face of figure 23 appears to have sheared off, although the torso remains remarkably intact; there are, however, no clear tool-marks.
Chisel marks on figure 15 (West Frieze VIII). Photograph of original sculpture on the left, with detail from 3D model on the right (images © E. Payne; 3D imaging conducted courtesy of the Acropolis Museum).

An unexpected result of these quantitative comparisons is that there is greater difference between the Elgin and Merlin casts—created 70 years apart, in 1802 and 1872, respectively—than between the Merlin casts and the originals as they are currently preserved, 143 years later at the time of 3D imaging (121 years of which the originals remained in situ on the Acropolis). The obvious conclusion to draw is that the period between 1802 and 1872 was one of particularly rapid deterioration.
The marble of the Parthenon sculptures displays an orange-brown patina, approximately 100–150μm thick. The origins of this patina—whether ancient or modern, natural or manmade—have been disputed. It is, however, stable and uniform, preserving the original surface details. This patina is distinct from the thicker, disfiguring pollution crust (from 200μm to several mm thick) that once covered the sculptures, but has now mostly been removed from the West Frieze by laser cleaning (Papakonstantinou-Ziokis Reference Papakonstantinou-Ziotis, Bouras, Ioannidou and Jenkins2012: 61–62). Such crusts are caused by suspension of atmospheric pollutants in a gypsum matrix, created by the reaction of the marble with sulphur dioxide. The crust, where present, retains the surface details of the original to a certain extent, but is discoloured and highly friable. It is noteworthy, however, that the decay of the sculptures appears to have slowed during the twentieth century—precisely when problems with sulphurous emissions and acid rain were at their most acute. In turn, this leads to the conclusion that the apparently greater rate of deterioration during the nineteenth century can be largely attributed to deliberate defacement as suggested by Elgin, rather than the cumulative effects of long-term environmental conditions. The relative lack of change in detail preserved between the Merlin casts and originals suggests that these attacks subsided following Greek independence in the 1830s and with subsequent restoration efforts.
In summary, comparison of the 3D models indicates:
1) Some very fine differences between the casts and the original sculptures caused by moulding practices.
2) A small amount of general weathering of the original sculptures subsequent to the castings.
3) More significant areas of loss caused by vandalism of the original sculpture.
Interpretation of the casts, their accuracy and their archaeological importance, however, is complicated by the fact that as well as these losses, there are also additions. It is known, for example, that casts of damaged sculptures were sometimes altered to make them appear more complete, calling into question the reliability of the information they preserve. The two documented instances of such additions to the Elgin casts concern figure 98 of North Frieze XXXVI and figure 30 of West Frieze XVI (Smith Reference Smith1910: 59; Jenkins Reference Jenkins1990: 113).
‘Restoring’ the Parthenon sculptures through their casts
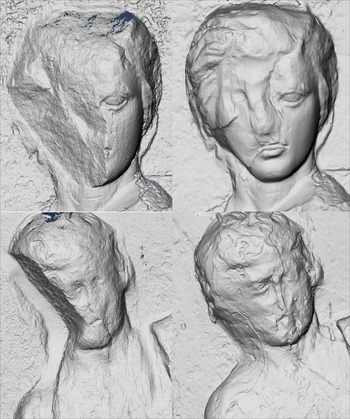
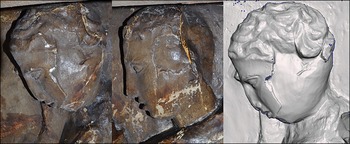
In 1910, Arthur Hamilton Smith noted the abnormal appearance of figure 98 on the Elgin cast, suggesting that the loss to the side of the face observed in the original had already occurred before Elgin's casts were taken, and was instead modelled roughly in clay during the mould-making stage (Smith Reference Smith1910: 59) (Figure 5). This notion was later restated by Stanley Casson (Reference Casson1921: 111), who suggested that the heads of all three riders on this slab were entirely reconstructed. The 3D image shows an area of the head of figure 96 that appears to be clay-like in surface texture (Figure 6). This section probably comprised a combination of original fragments (since lost) with clay additions. The heads of figures 96 and 97 are far more finely crafted than the crudely shaped addition to the head of figure 98. The addition to figure 30 in West Frieze XVI is more carefully modelled, with the edges of the addition being smoother and flusher with the original parts (Jenkins Reference Jenkins1990: 113).
3D models of figure 98 (above: North Frieze XXXVI) and figure 30 (below: West Frieze XVI). Originals on the left, and Elgin casts with additions by the formatori on the right (images © E. Payne; 3D imaging conducted courtesy of the Trustees of the British Museum and the Acropolis Museum).

Left to right) figure 96 (photograph of Elgin cast); figure 97 (photograph of Elgin cast); figure 96 (3D model of Elgin cast). North Frieze XXXVI. Note the clay-like section in the 3D model (images © Emma Payne; 3D imaging conducted courtesy of the Trustees of the British Museum).

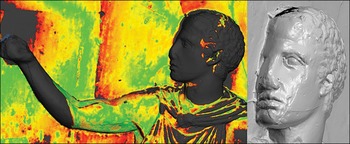
To what extent, therefore, do the casts faithfully represent lost archaeological details and to what extent have they been manipulated? While the sculptures have suffered from the effects of weathering, pollution and vandalism, the presence of additions in the casts indicates that some of the more significant areas of damage may, in fact, pre-date the moulding of the Elgin casts in 1802; the additions mean that the Elgin casts appear to deviate from the Merlin casts more significantly than is actually the case. The Merlin casts do not appear to include any such additions. This hypothesis is further substantiated by examination of the quantitative comparisons in conjunction with the individual 3D models, indicating further examples of possible additions. It is highly probable, for example, that the sections of the face and forearm of figure 23 (West Frieze XII) that are missing in the Merlin cast but present in the Elgin cast were also added by the formatori. The deviation map reveals patterns of change characteristic of intentional additions in the Elgin cast. Although these are visible around the moulding seam lines, there is also clear evidence for intervention around the hand. The 3D model of figure 23’s face also reveals differences in texture between those parts extant and those now lost (Figure 7). This softer texture is not observed in the model of the now-missing head of figure 15 (West Frieze VIII), although loss of the entire head makes it harder to compare missing and extant areas in this case. The deviation map for West Frieze VIII reveals some patterns around the moulding seam lines, but no clear evidence of deliberate additions. It can therefore be concluded that this head was cast from the original, which was then lost between 1802 and 1872.
Deviation map of figure 23 (West Frieze XII) at 1mm maximum deviation: greyscale >1mm; red >0.6mm; yellow >0.3mm; green <0.3mm. Data applied to Elgin cast. 3D model with detail of the face to the right (images © E. Payne; 3D imaging conducted courtesy of the Trustees of the British Museum).

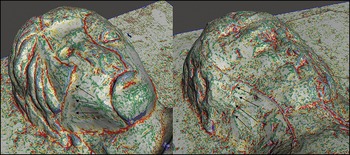
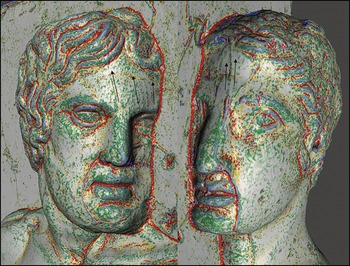
Examination of the mean curvature is particularly useful for identifying clay-smoothing marks on these additions. These marks can be found not only in the known additions of figures 30 and 98, but also in the faces of figures 5 and 6 (West Frieze III) (Figures 8–9). The formatori probably modelled small pieces of clay to reduce the appearance of weathering on the facial features—a hypothesis supported by analysis of casts from the same sections of the West Frieze at the Akademisches Kunstmuseum in Bonn, which derive from those of Fauvel, who took casts from the Parthenon sculptures in the late eighteenth century (Himmelmann & Sinn Reference Himmelmann and Sinn1981: 23; Zambon Reference Zambon2014: 144–45). The Fauvel and Elgin casts were first produced from moulds taken directly from the Parthenon sculptures, within 15 years of each other. The Fauvel casts, being the earlier, should reflect the originals in a (marginally) superior state of preservation. Yet the opposite is true: the noses of figures 5 and 6 (West Frieze III) appear more complete in the Elgin cast than in Fauvel's. These sections are precisely where analysis of the mean curvature in the 3D models of the Elgin cast reveals discrepancies. Later casts derived from those of Fauvel, however, should not all be assumed to be more reliable than those of Elgin: those at the Petite Malmaison in Paris are also known to contain restorations (Pinatel Reference Pinatel2006).
3D models of Elgin casts with indicated mean curvature and arrows signifying clay-smoothing lines. Left) figure 98 (North Frieze XXXVI); right) figure 30 (West Frieze XVI). Image key: green-blue) positive mean curvature; yellow-red) negative mean curvature; grey) zero mean curvature (images © Emma Payne; 3D imaging conducted courtesy of the Trustees of the British Museum).

3D models of Elgin casts with indicated mean curvature and arrows signifying clay-smoothing lines. Left) figure 5; right) figure 6. West Frieze III. Image key: green-blue) positive mean curvature; yellow-red) negative mean curvature; grey) zero mean curvature (images © E. Payne; 3D imaging conducted courtesy of the Trustees of the British Museum).

Conclusions
Analysis of 3D models of the British Museum's Parthenon casts shows that they are, in general, very accurate copies of the original in situ friezes at the time of moulding. This result provides strong support for the use of casts as an—often digitised—archaeological resource. 3D imaging offers an effective tool to measure and visualise differences between originals and casts, and any changes that may subsequently have occurred to the originals. As plaster can be scanned more effectively than the marble surfaces of the originals, these accurate casts provide a particularly useful medium for analysing the sculptures, including investigation of the original finish, which in some cases may no longer survive.
Many of the differences between the casts and originals can be explained by deterioration of the frieze in the years following moulding. This research, however, indicates that this deterioration was less extensive in the nineteenth century than has been commonly assumed. While most of the casts are accurate reproductions, certain sections have been subject to alteration, primarily to complete areas that had already been destroyed before the time of casting. These additions are found in the Elgin casts, but not in the later Merlin casts. Casts containing the Elgin additions, however, were circulated widely. The 1906 catalogue of the New York moulding company, Castelvecchi, for example, includes a cast of Parthenon North Frieze XXXVI, which exhibits the very same addition as that found in the Elgin cast at the British Museum. Given that the Merlin casts do not appear to contain any such additions and are shown to reproduce the originals with great accuracy, it may be surmised that such interventions were deemed less necessary by the nineteenth century. This accords with the more restrictive attitude to restoration that also developed during this period, and that the use of casts to preserve the forms of vulnerable sculptures became an increasingly well-defined aim.
These results have ramifications that extend beyond ancient Greek sculpture. From the nineteenth century onwards, for example, plaster casts were also used to record and disseminate newly discovered fossils, and casts of fossil hominin skulls have been used to investigate the evolution of early humans. This demonstration of the general accuracy of casts is therefore reassuring. That we must, however, continue to look critically at such objects is underlined by recent investigations that indicate interventions and retouching of the plaster body casts at Pompeii (Lazer Reference Lazer.2009: 254–58).
While archaeologists will certainly find great value in nineteenth-century casts and in current attempts to document and digitise them, it is important to be alert to the fact that, just as the originals were often subject to significant programmes of restoration, casts produced in this period were subject to comparable interventions. Casts therefore offer valuable information, but are not unmediated reproductions.
Acknowledgements
This work was made possible by awards from the AHRC and AICON 3D Systems. I would also like to thank the following: my PhD supervisors and examiners, Corinna Riva, Elizabeth Pye, Jeremy Tanner and Will Wootton; for help with the 3D scanning and analysis, Dirk Rieke-Zapp (AICON 3D Systems) and John Hessler (Library of Congress); at the British Museum, Dirk Booms and Andy Liddle, as well as Ian Jenkins for showing me the records that he has gathered relating to casts at the museum; and at the Acropolis Museum, Costas Vasiliadis. Particular thanks go to the British Museum and the Acropolis Museum for permitting the 3D scanning.