

I. Data, PleaseFootnote 1
The situation of women in philosophy has been overlooked due to the field's inclusion in the humanities, a highly feminized area in general terms. This makes the data from the field of philosophy all the more surprising, as it shows an imbalance comparable to that of one of the most male-dominated fields in academia: engineering. Perhaps we should not be overly surprised, though, given that philosophy deals with the occupation of the public sphere, where women have never really been welcome. The great female philosophers of antiquity were forgotten by history and only recently have some of them been recovered, more for their relationship with natural philosophy and science than for their contributions to philosophical thought.
This article deals with gender imbalance in philosophy by means of a statistical analysis of professionals and students in the field in Spain. It has the great advantage, in comparison with other studies, of being able to make use of complete and real data from the entire Spanish educational system, as opposed to sample data; I can thus eliminate possible biases or sample representativeness problems. The standardization of indicators is an indispensable part of the study in order to compare the Spanish situation with that of other countries; I undertook this normalization using the International Standard Classification of Education (OECD 2015); the Canberra manual (OECD 1995), used for analyzing human resources in science and technology; and the normalization proposed by the European Union for academic staff in the report She Figures (European Commission 2009). In this way, other researchers will be able to compare the data with their own national systems. I have also made a small international comparison with data published in the US (Haslanger Reference Haslanger2010), Australia (Goddard Reference Goddard2008a; Reference Goddard2008b), and the UK (Beebee and Saul Reference Beebee and Saul2011), all leading to the conclusion that gender imbalance in philosophy is truly an international phenomenon.
The underrepresentation of women in philosophy has many facets and likely has many different causes. Any analysis of the subject must explain: the low proportion of female philosophy students in comparison to their proportion in humanities baccalaureate programs; the low proportion of women among teaching and research personnel in philosophy majors; and the thicker glass ceiling, which results in women making up only 12% of those at the top level of the field. In all three cases the percentages are substantially inferior, not only with respect to the statistical aggregate (humanities) but with respect to the general average in Spanish universities. Several studies have attempted to describe and explain this gender imbalance in philosophy; I will evaluate some of these in the second part of the article, contrasting them with the Spanish data. One hypothesis involves a difference in cognitive abilities as an explanation for the underrepresentation of women in philosophy (Sesardic and Clercq Reference Sesardic and de Clercq2014). The authors venture that a difference in mathematical abilities, particularly the mental rotation test, explains women's underrepresentation in the field. According to the authors, their hypothesis is valid because there are fewer women in the more technical fields of philosophy such as logic, decision theory, and the philosophy of mathematics. As odd as the idea may seem, I decided to test their hypothesis because the supposed difference in mathematical abilities has become such an entrenched stereotype that there are those who take it at face value. This hypothesis is not confirmed by Spanish data, however, as there are more women than men in the technical areas than in metaphysics, epistemology, and the history of philosophy.
I then examined the hypothesis suggested by Molly Paxton, Carrie Figdor, and Valerie Tiberius, which focuses on the idea that the greatest desertion of women from the field of philosophy occurs after the introductory courses (Paxton et al. Reference Paxton, Figdor and Tiberius2012). Notwithstanding the difficulties comparing two very different ways of organizing the majors in philosophy, as is the case with the US and Spain, I conclude that Spanish data does indeed support this hypothesis. The present study also provides the results of the national examination in philosophy, taken by 21,232 students, in which women outperformed men.
Finally, I analyzed the field-specific abilities belief hypothesis (Leslie et al. Reference Leslie, Andrei Cimpian and Freeland2015). I correlated the data from the American survey with the percentage of doctoral theses presented by women in Spain in the different areas in question and found a strong association.
Although I am aware that no statistical study is going to pinpoint the causes behind these phenomena, this study offers incontestable evidence that can withstand any claim of its being sample-biased, unrepresentative, or anecdotal. Here I present the statistical data of the whole philosophy community in Spain; the findings suggest the presence of discrimination.
II. Normalization of Indicators
The principal contribution of this article is that it provides real data about the total population of teaching and research personnel in Spanish universities. Institutions in the educational system are required by law to provide complete data, which is publicly available in a database. University statistics for the years 1998–2011 can be found on the web page of the Instituto Nacional de Estadística, and from 2011 onwards, on the web page of the Ministerio de Educación.Footnote 2 As a result, this study has the enormous advantage of relying on the total population instead of on samples with uncertain representativeness. Furthermore, due to the data's accessibility, the results presented here are easily replicable.
In recent years, different studies have been carried out in various countries, particularly in the English-speaking world, dealing with the underrepresentation of women in philosophy. However, arriving at general conclusions is difficult, in part due to the peculiarities of each educational system. Here I have used a set of normalized indicators in order to facilitate international comparisons. Regarding the different fields of study, the International Standard Classification of Education (ISCED), developed by UNESCO, distinguishes twenty-one main fields of study. The manual of human resources devoted to science and technology (Canberra Manual) regrouped areas of study into six broad fields: natural sciences; engineering and technology; medical sciences; agricultural sciences; social sciences; and humanities (OECD 1995). These are the sources for the statistical aggregates per field of study that I have used. For the educational system, I used the standardization proposed by UNESCO (ISCED), which divides the educational system into eight levels (OECD 2015). Levels 6, 7, and 8 are those primarily used for this article and are defined as follows: ISCED 6: “Bachelor's or equivalent level, . . . often designed to provide participants with intermediate academic and/or professional knowledge, skills and competencies, leading to a first degree or equivalent qualification. . . . They are traditionally offered by universities and equivalent tertiary educational institutions” (OECD 2015, 51); ISCED 7: “Master's or equivalent level, . . . often designed to provide participants with advanced academic and/or professional knowledge, skills and competencies, leading to a second degree or equivalent qualification. Programmes at this level may have a substantial research component but do not yet lead to the award of a doctoral qualification” (OECD 2015, 55); and ISCED 8: “Doctoral or equivalent level, . . . designed primarily to lead to an advanced research qualification. Programmes at this ISCED level are devoted to advanced study and original research and are typically offered only by research-oriented tertiary educational institutions such as universities” (OECD 2015, 59). This standardization enables researchers to compare their own data with that provided here. Concerning university professors themselves, the data in this study refers to professors in teaching and research positions, which corresponds to the way that academic activity is organized in Spain. For international standardization, I have used the system proposed by the European Commission in She Figures, which classifies university professors into:
Grade A. The single highest grade/post at which research is normally conducted; Grade B: Researchers working in positions not as senior as top position (A) but more senior than newly qualified PhD holders (ISCED 8); Grade C: The first grade/post into which a newly qualified PhD graduate would normally be recruited; Grade D: Either postgraduate students not yet holding a PhD degree who are engaged as researchers, or researchers working in posts that do not normally require a PhD. (European Commission 2009, 129)
This system has proved to be extremely productive in reports on science and gender in the European Community. It allows for the comparison of university systems that are disparate in terms of hiring practices and of the qualifications to belong to each category.
In Spain, all professors belonging to categories A and B are civil servants, and the rest are hired on a permanent or temporary basis.Footnote 3 Promotion into another category is done first through a process of accreditation in which candidates must demonstrate that their curricula meet the requirements for the next level, and then by public examination, where candidates present their curricula, their teaching projects, and their research projects. Tribunals consist of five professors of an equal or superior level to that to which the candidate aspires. Although the process would appear at first glance to be gender-neutral, keep in mind that it is the department that decides what positions are open and who will make up the tribunal, a circumstance that can easily lead to strategies borrowed from the “old boys’ club.” Another figure from the realm of university professors who carry weight in the composition of academic staff is the “profesor asociado” (which corresponds approximately to adjunct professor). In keeping with university norms, these are part-time teachers recruited from professionals in each field who are meant to provide a professional perspective on the subject matter (part-time instructors who hold a parallel job). They are not required to have a PhD or to engage in research, and their salaries are quite modest. The economic crisis has led to the abuse of this position, which has in effect come to constitute a first step of any potential professor's academic career; hence the name “false adjuncts.” Given the impossibility of distinguishing these false adjuncts from the “real” ones who do work outside of the university and serve to provide a professional perspective, we have left them out of this study. The total percentage of adjunct professors in Spanish universities is 24%, of whom 40% are women. In the field of philosophy, adjunct professors make up 16% of all professors, and 27% of these adjunct professors are women.
The Spanish university system comprises eighty-four universities (fifty public and thirty-four private) with about 120,000 teaching and research positions, of which almost 50,000 are held by women. Close to 1,600,000 students are enrolled in a consolidated educational system that is at a similar level to that of other first-world university systems. Twenty-four universities offer undergraduate studies in philosophy and comprise a total of 7,249 students, 2,615 of whom are women.Footnote 4 I do not believe there are significant cultural differences in the domain with regard to other Western countries, and therefore I believe that the normalization strategy is appropriate.
III. Counting Women
Spanish Academic Staff
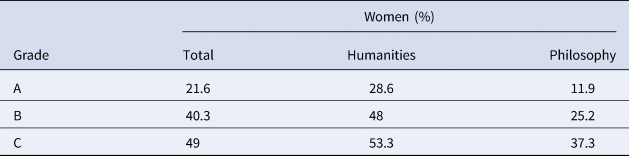
The statistical reports on gender equality in science and research combine the different fields of study into six broad fields: arts and humanities, social science, natural science, agricultural science,Footnote 5 engineering, and health. The assumption is that there are common traits among these fields with respect to the women in the fields comprising them. The general idea is that all of the fields making up, for example, health sciences or humanities are highly feminized, but the data analysis shows that this is not always the case. In this sense, philosophy is a paradigmatic case. Table 1 compares the average percentages of women in philosophy, in humanities, and the total in Spanish universities by grade.
Percentage of women by grade. Academic year 2016–2017

There is a 10 percentage-point difference between the representation of women in philosophy at the grade A level and the overall representation of women at the grade A level in the university system overall. This difference is 16.7 percentage points when comparing the representation of women at the grade A level in philosophy compared to the representation of women at the grade A level in the humanities overall. In general, philosophy is quite distant, not only from the realm of humanities, but from the general average of Spanish universities.
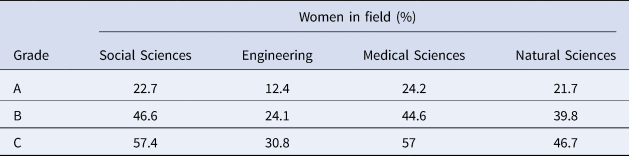
The situation is more similar to engineering, the most masculine of all fields, than it is to the humanities. Women comprise 9.8 percentage points more of professors in the A degree in the natural sciences than in philosophy. The next table shows the percentage of women by grade across the main fields of science.
The data shows that the proportion of women in grade A in philosophy is even lower than in engineering, and in grade B, the proportions are similar (compare Tables 1 and 2). Only in the lowest position of the academic staff (grade C) do women philosophers surpass engineers. In fact, the glass-ceiling index that measures the difficulties of women in progressing in their academic careers is the same in philosophy and engineering (2.9) and lower in the rest of the fields.Footnote 6 On the other hand, it is surprising that the situation in science is much better for women than it is in philosophy. The reason for this is that within the field of science are narrow fields of study with very different proportions of women. In other words, there are fields that stray far from the average. For example, the proportion of female academic staff in science is 37%, but this ranges from 56% in analytical chemistry to 13% in theoretical physics.
Proportion of women by grade and main fields of science (2016–2017)

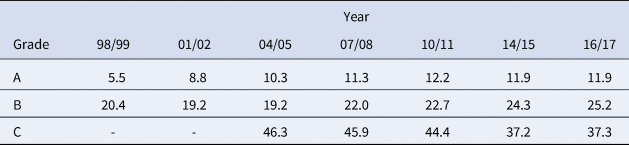
Table 3 shows the evolution of the percentage of women in philosophy over the last twenty years.
Percentage of women in philosophy by academic year and grade

The data (Table 3) shows that for twenty years, the percentage of women increased by seven percentage points for grade A and by five percentage points for grade B. The largest increase occurred around the years 2001/02 for grade A. The increase coincides with the implementation of a new law in 2001 with respect to hiring and promotion at the university level. Under this new law, candidates being considered for hiring or promotion had to be accredited by an external national authority. One possible explanation for the change is that the more objective the process is, the more it favors women since it avoids the old boys’ club system that continues to play an important part in hiring and promotion.
Using historical growth per year to estimate future growth, parity would be achieved in the years 2113 and 2126 for grades A and B, respectively, but parity will never be achieved in grade C because the representation of women there is declining. The situation in philosophy seems not merely conjunctural but a rather static situation and describes a perspective that is totally unacceptable.
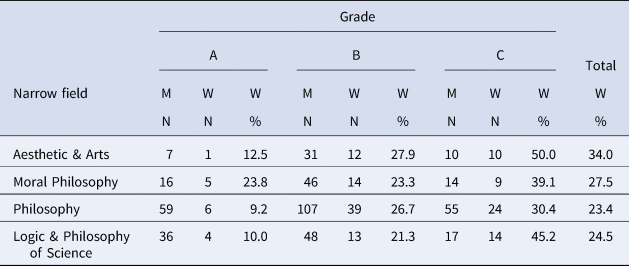
In Spain, philosophy is divided, for administrative and research purposes, into four narrow fields: philosophy; logic and the philosophy of science; moral and political philosophy; and aesthetics and the theory of art.Footnote 7 Some authors have related the number of women in each field with gender characteristics (Sesardic and Clercq Reference Sesardic and de Clercq2014). Prior to debating this hypothesis, I will analyze the data. Below is the percentage of women by grade and area of specialization or narrow field (Table 4). There is no specific field for gender studies, which is approached from different fields.
Percentage and number of women and men by grade and narrow field (2016–2017)

There are no substantial differences across the narrow fields. Moral philosophy seems to be the field with the fewest problems in terms of women's promotion to the highest academic staff positions; in contrast, however, fewer women reach intermediate positions. Only the data for grade C correspond approximately to the university average. We have included here the brute data of the population in order to demonstrate that the resulting percentages are not determined by the small numbers of the relevant population. In other words, given the scant number of women, if we were to include, for example, a single additional woman in aesthetics in grade A, the percentage would double, thus introducing bias into the data. By including the total of the different populations, we are focusing on the relevant information here, the ratio of men to women, which is 7:1.
The International Situation of Women Students
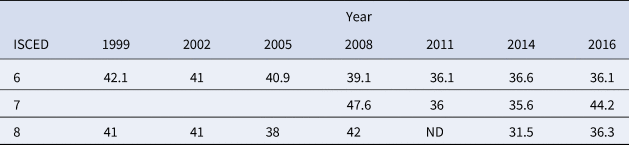
Female students are underrepresented in philosophical studies as the percentage has declined from 42% of women enrolled in bachelor's programs in the 1999–2000 academic year to 36% in 2016–2017. Table 5 shows the data for ISCED 6, 7, and 8 that roughly correspond to the bachelor's, master's, and doctoral levels.
Percentage of women matriculated in philosophy by educational level. ND: No data available

The table shows the percentage of women enrolled, not the percentage who graduated. We believe that the situation of women in philosophy is better reflected by the percentage of enrolled rather than graduated females because the females outperform the males, and therefore more females than males graduate. For example, the percentage of enrolled women was 36% in 2011, but four years later these women constituted 41.6% of those who graduated.Footnote 8
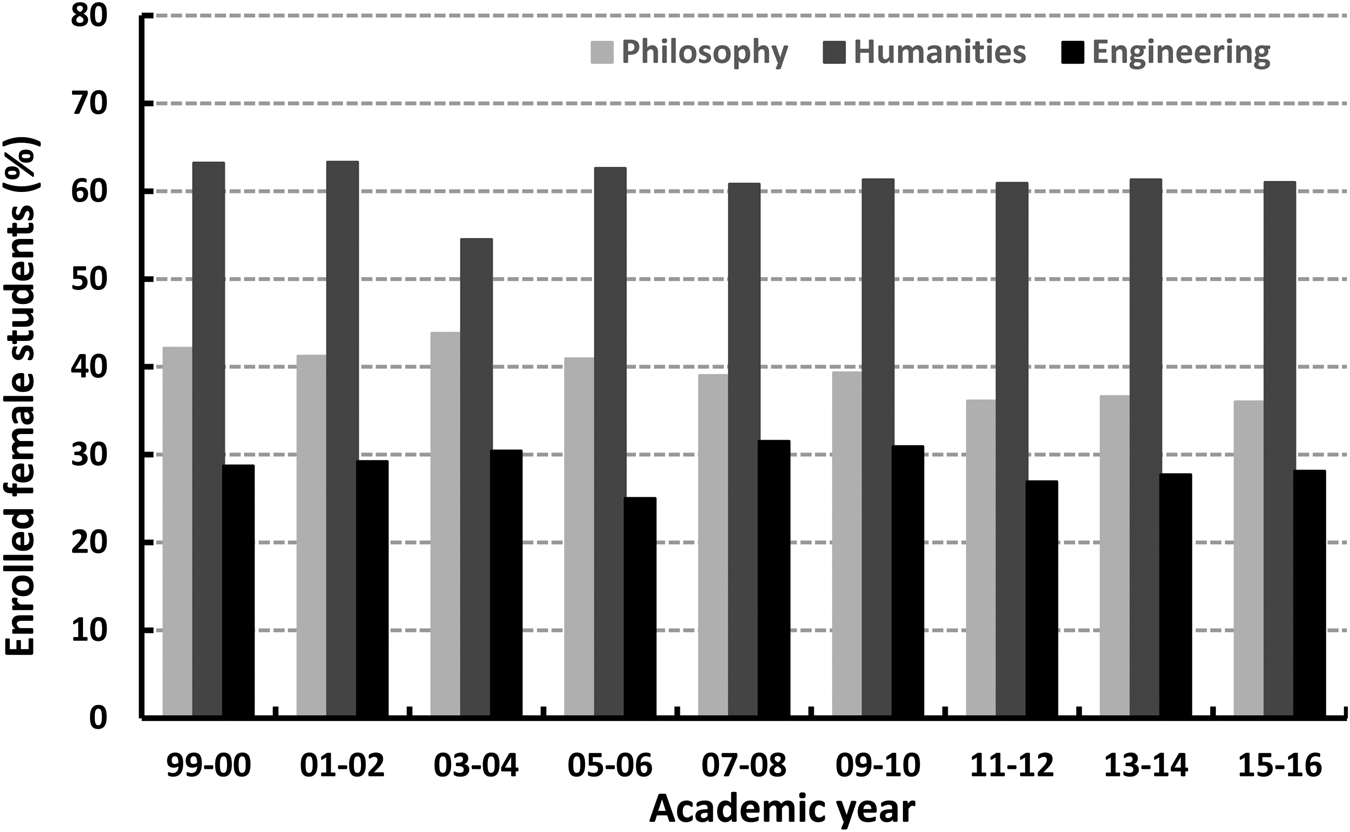
If we compare the percentage of philosophy students with that in humanities and engineering (Figure 1), we see that again the situation is more like that experienced by women in engineering. The data also shows that philosophy is an anomaly in the humanities, with a substantially lower proportion of women.
Evolution of the percentage of women enrolled in philosophy, engineering, and humanities from the academic year 1999–2000 to 2015–2016

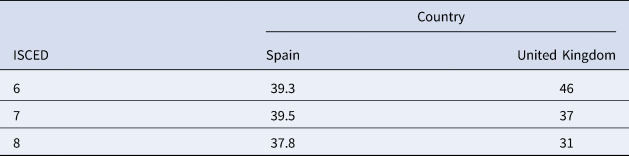
The data is very similar to that from the United States, which indicates that 31% of graduates are women at the ISCED 6 level, 28% at ISCED 7, and 31% at ISCED 8 (American Academy of Arts Sciences 2018). On the other hand, the United Kingdom gives a percentage of 46% of women enrolled in ISCED 6, 37% in ISCED 7, and 31% in ISCED 8 (Beebee and Saul Reference Beebee and Saul2011).Footnote 9 The most noteworthy aspect is that women fall considerably behind over the course of their academic careers with a fifteen-percentage-point difference between the undergraduate and doctoral levels in the UK, whereas in Spain, women's representation remains steady over the course of the three levels (Table 6).
Comparison of percentage of female students between Spain and UKFootnote 10

Female Academic Staff in the International Context
The data and indicators regarding female professors and researchers in the international context enable us to come up with an initial diagnosis of the situation. They provide a vision of a reality not based merely on anecdotal evidence or personal experience that cannot be generalized. Researchers from different countries have compiled this data, from which we can get an idea of the international situation.
Helen Beebee and Jennifer Saul prepared a report for the British Philosophical Association in which the data was collected by means of questionnaires sent to heads of department (or equivalent) between 2008 and 2011 (Beebee and Saul Reference Beebee and Saul2011). Data were gathered from thirty-eight departments. In Table 7, I have normalized their academic staff categories (see section II) and compared them with Spanish data from the same year.
Comparison of percentage of female academic staff between Spain and the UK

A comparison between Spain and the UK shows a similar percentage of female academic staff at grade B, whereas the percentage of women is higher in Spain for grade C but lower for grade A. This suggests that Spanish women have a harder time reaching the upper levels of the hierarchy.
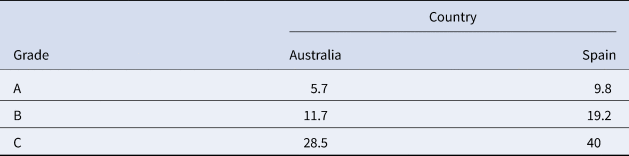
In Australia, the rate of increase in the number of philosophy positions held by women was 0.6 percentage points per year for the period between 1988 and 2006 (an increase from 12% to 23%) (Goddard Reference Goddard2008a, 5). For comparison, in Spain, the rate of increase was 0.3 percentage points per year for the period between 1998 (19.7%) and 2017 (25.8%) (see Table 3). The number of years is practically the same, but the growth rate in Spain was half of that in Australia.
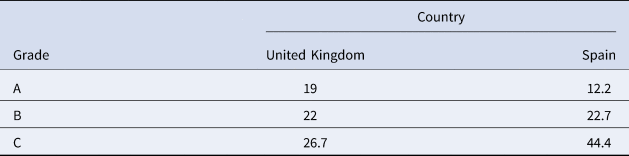
As a way of normalizing the academic staff levels, we have grouped Lecturer and Senior Lecturer positions in grade C, Associate Professor in grade B, and Professor in grade A.Footnote 11 Table 8 shows a comparison with Spain for 2006, the year for which Australian data is available.
Comparison of the percentage of women by grade for Australia and Spain in 2006

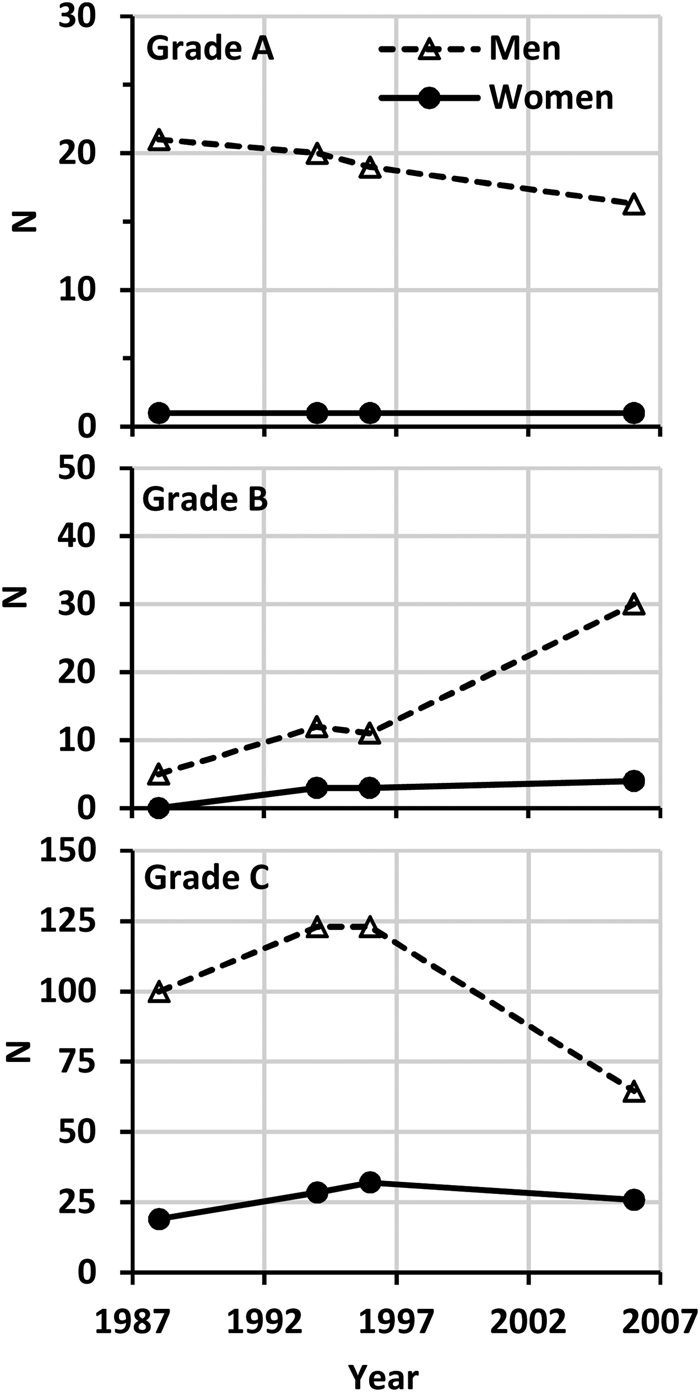
Despite the fact that the rate of increase is double in Australia than in Spain, the percentages are markedly inferior in all categories. Especially noteworthy in the Australian report is the evolution over time of the number of men and women in philosophy (Figure 2). In grades A and C, the increasing percentage of women is not due to an increasing number of women, but rather a decreasing number of men. For grade B, over the course of ten years there was exponential growth in the number of men, whereas that of women stayed constant.
Evolution of the number of women per category (1987–2007) in Australia. This is my own elaboration based on the data in Goddard Reference Goddard2008a.

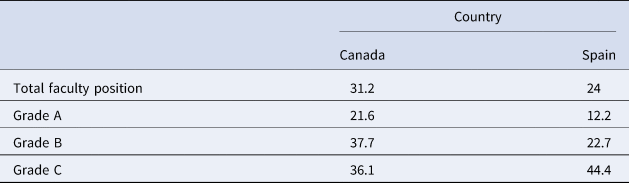
The Canadian report (Doucet and Beaulac Reference Doucet and Beaulac2013) for 2011 gives the following data:Footnote 12
The differences between Spain and Canada are significant, evidencing an almost ten-percentage-point difference for the superior positions, showing once again that the Spanish glass ceiling is thicker (Table 9). For the second position in the hierarchy, the difference is fifteen points, whereas in the lower part of the scale, Spain has a greater percentage of women. In either case, the Canadian data should be treated with caution, given that it is based on a noncompulsory questionnaire and thus contains several sources of possible bias: according to the authors, samples are unlikely to be representative, and the pool of responding departments might not be stable over time. One of the principal origins of bias in the Canadian data—as well as the data of other countries dealt with here—lies in the fact that, being voluntary, it is likely that these surveys were conducted by departments that already harbored a sensitivity to issues of gender, which leads us to suspect that the real situation may well be worse, in terms of equality, than is reflected in the data.
Comparison of the percentage of women faculty in Spain and Canada in 2011

Although data is somewhat sparse at the international level, I believe that this brief glimpse of the situation in Australia, Canada, and the United Kingdom provides good reason to affirm that the phenomenon is not simply circumstantial to one specific national system but rather that it has to do with the characteristics of the discipline or the profession. What especially draws my attention is the fact that in all of the national systems for which I have data, women's presence stands at about 25% (UK 24%; Australia 23%; Spain 27%). In the US, women make up 16.6% of full-time philosophy faculty and 26% of part-time instructors (Norlock Reference Norlock2011). In Brazil they represent 20.7% (Araújo Reference Araújo2016). The glass ceiling is also at a similar level in the cases analyzed here, making it harder for women to reach higher positions in the academic hierarchy. The international data also shows that female students in philosophy are similarly underrepresented as in Spain.
IV. The Gender Gap
It is important to note that when we speak of underrepresentation or a gender gap, we are not referring to a single phenomenon. That is to say, in explaining the scarcity of women in philosophy, we must explain three different phenomena that may have different causes. First, we must explain the low proportion of female students in philosophy majors (36%) in comparison with the percentage of female humanities students in high school (ISCED 3), which for the academic year 2016–2017 was 62%. Second, we must explain the low proportion of women in academic staff positions in philosophy as compared to women who obtain a doctorate, which for 2011 was 38%.Footnote 13 Finally, we must explain the thicker glass ceiling that leads to only 11% of people at grade A being women compared to a 21% average of university full professors.
The hypotheses that tackle the question of the scant presence of women in philosophy can be divided into two large groups: the hypothesis of discrimination, which holds that there are subtle forces acting to dissuade and discourage women from pursuing an academic career in philosophy; and the hypothesis of differences, which claims that there are significant differences between men and women that explain the gender imbalance in philosophy. These supposed differences have been conceptualized in various ways: in cognitive abilities (Sesardic and Clercq Reference Sesardic and de Clercq2014), in philosophical intuition (Buckwalter and Stich Reference Buckwalter, Stich, Knobe and Nichols2014), in interests (Papineau Reference Papineau2015), and in methodology (Buckwalter and Turri Reference Buckwalter and Turri2016).
It is not my goal here to analyze these hypotheses. However, in the following section I will show if and to what degree the Spanish data supports three studies from the literature on the matter: the hypothesis of differences in cognitive abilities proposed by Sesardic and Clercq, the study by Paxton, Figdor, and Tiberius regarding the characteristics of the gender gap in the US, and finally, the field-specific abilities belief hypothesis developed by Sarah Leslie and her colleagues.
Difference in Cognitive Abilities
Some theorists argue that the scarcity of women in philosophy is due to differences in their cognitive abilities, specifically differences in mathematical abilities, differences theorized as making them inferior. This hypothesis would need to address two questions: first, the scarcity of female philosophy students and, second, the underrepresentation of female teachers in academic staffs. Regarding the first question, defenders of this theory need to demonstrate that there is a gender-based difference in mathematical abilities and that mathematical abilities shape the choice of an academic career. Regarding the second question, they would need to show that the cognitive abilities necessary for philosophy are based on mathematical aptitudes and, again, that women are worse at mathematics than men. I will now analyze each of these aspects separately.
The Choice of a Career in Philosophy
Sesardic and Clercq argue that there are differences between the sexes in cognitive abilities (Sesardic and Clercq Reference Sesardic and de Clercq2014, 464). They base their claim on an article by Diane Halpern, Anna S. Beninger, and Carli A. Straight that affirms that on average, “males score higher on some tasks that require transformations in visual-spatial working memory . . . and fluid reasoning, especially in abstract mathematical and scientific domains” (Halpern, Beninger, and Straight Reference Halpern, Beninger, Straight, Sternberg and Kaufman2011). Curiously, Sesardic and Clercq choose to omit a paragraph from a little further in the article:
Although sex differences in mathematics have received widespread attention as a possible reason for the underrepresentation of women in math-intensive careers, these differences depend on the portion of the distribution examined and the data that are used to support a particular conclusion. There are many more mentally retarded males than females. . . . Some tests of quantitative and visuospatial abilities also show more males at the high end of the distribution and miss the greater number of males at the low end because the mentally retarded are rarely included in tests that are administered in school settings. (255)
Clearly, eliminating the mentally disabled (the lower tail of the distribution) may bias the male mean upwards. This fact was omitted by Sesardiq and Clercq when they cited the study, and in fact, precise sample selection is one of the most common biases in the empirical studies on gender differences in cognitive abilities.
In general, literature about differences in cognitive abilities related to mathematics is highly controversial; many biases have been identified, and for every study that purports to show differences there is another demonstrating an absence of differences. As I mentioned above, the samples used by those studies showing differences have tended to be highly selected or have been subject to unusual statistical analyses (Caplan and Caplan Reference Caplan, Caplan, Gallagher and Kaufman2005). Up to this point no one has managed to show, in a broad-scale, replicable study—based on appropriately selected samples considered over an appropriate period of time—that a difference in cognitive abilities does indeed exist.
One type of study that became popular among those attempting to demonstrate differences in cognitive abilities are those based on the SAT mathematics tests. Their popularity may have to do with the fact that such tests offer such a large sample, but they are not especially useful as predictors of the future success in math or science of men or women. Sesardic and Clercq are among those who rely on SAT results. According to them, there is a difference of 6 to 1 in favor of males among those students who attain a score of 800 on the math component of the SAT test. They conclude: “The relevance of this statistical effect for our discussion is obvious, given that academics in exact sciences are recruited from those with exceptionally high mathematical abilities” (Sesardic and Clercq Reference Sesardic and de Clercq2014). Let us for a moment accept that academics are indeed hired from the right tail of the distribution of cognitive abilities as suggested by Sesardic and Clercq and by Jonathan Wai and his colleagues, and analyze gender difference in the right tail. Sesardic and Clercq used the data from the work of Wai and his colleagues, who analyzed SAT scores from the Duke University TIP 7th Grade Talent Search. Participants in the talent program had previously scored in the top 5% of ability for their grade on a standardized test, either on a composite score or on a subtest in the sixteen states from which the sample was taken. As part of the talent program, participants took the SAT test in seventh grade (it is normally taken in eleventh or twelfth grade). The 6:1 ratio of males to females mentioned by Sesardic and Clercq was found by analyzing only the students with the top score (800) on the SAT math test (in an already highly selected sample): seventy-nine males and twelve females for the period 2006–2010 (Wai et al. Reference Wai, Caccio, Putallaz and Makel2010, Table 1 and appendix A). These students represent only 0.014% of the sample, and this may have biased Sesardic and Clercq's conclusions. I suggest studying a larger part of the right tail, as studying approximately twenty students per year is clearly insufficient to satisfy the demand for academics in STEM areas in the sixteen states from which the sample was taken. If we instead assume that STEM academics are recruited from among the top 1% of SAT scores, the ratio of males to females is 1.1 (Wai et al. Reference Wai, Caccio, Putallaz and Makel2010, Table 1), which would correspond to 47% females in the STEM areas—far from the reality. In conclusion, when we analyze the 1% upper-right-tail distribution of SAT math scores instead of the extreme 0.014% analyzed by Sesardic and Clercq, the differences in SAT math scores almost vanishes and seems insufficient to explain the underrepresentation of women in STEM areas.
In many other countries, the differences between male and female test scores are negligible. Studies based on the “Programme for International Student Assessment” (PISA) reports indicate that in some countries (Sweden, Norway, and Iceland) girls attain scores that are as high or higher than those of boys in math (European Commission 2012, 73). In Spain the differences are virtually insignificant. The equivalent Spanish test shows a mean result of 6.2 for girls as opposed to 6.4 for boys. There is also a greater auto-selection of the male sample, because, among graduates of the baccalaureate program (ISCED 3), only 82% of males take the university entrance exam compared to 90% of females. Furthermore, only 71% of male graduates in the science and technology baccalaureate program take the mathematics exam, as opposed to 79% of female graduates. This is noteworthy because this is the only baccalaureate field in which there are more men than women (52% to 48%). I believe that it is very likely that the worst male students have excluded themselves (given the eight percentage points fewer males than females who take the mathematics exam), which leads to an upwardly biased sample of males, and subsequently, the average grade is two-tenths of a point higher for males than females.Footnote 14 In the Spanish case, female and male mean scores are being compared and not scores in the extreme right tail of the distribution. Furthermore, Spanish universities do not hire academics based on the Spanish equivalent of the SAT but rather on performance in the major and doctoral level and later scientific contributions, and hence gender differences in the university access test score do not explain the female under-representation for students and professors in STEM areas and less so in philosophy.
Philosophical Area of Interest and Gender
The most surprising thing about Sesardic and Clercq's article is the argument they resort to in order to explain the scarcity of women in philosophy, pointing at differences in cognitive abilities, specifically at transformations in visual-spatial working memory. According to the authors, proof of this lies in the underrepresentation of women in the more technical areas of philosophy such as logic, decision theory, and the philosophy of mathematics. They attempt to bolster their thesis with a report from the Committee on the Status of Women in the Profession of the American Philosophical Association (Haslanger Reference Haslanger2010). According to this report, the five lowest areas for women with respect to distribution by gender are, in this order: Chinese philosophy, Indian philosophy, logic, decision theory/rational choice/game theory, and philosophy of mathematics, but curiously, none of these are in the five top areas for men, which are: metaphysics, epistemology, philosophy of mind, normative ethics, and metaethics. Furthermore, there is no information about the different percentages between genders in those areas that the authors consider key.
Frivolous as this hypothesis may seem, I would like to examine the degree to which it is supported by Spanish data. In Spain, all the sub-areas considered technical by Sesardic and Clerq (logic, decision theory, and the philosophy of mathematics) are grouped in the narrow field “Logic and Philosophy of Science” (see Table 4). If we compare this with the other nontechnical narrow fields like “Philosophy” (which basically consists of the sub-areas history of philosophy, philosophical anthropology, and metaphysics) or “Moral Philosophy,” there is less than one percentage point more women in “Logic and Philosophy of Science” than in “Philosophy” and only three percentage points less than in “Moral Philosophy,” an area that many authors consider to be favorable to women.Footnote 15 What's more, the glass-ceiling index in the narrow field “Philosophy” surpasses by two-tenths that of “Logic and Philosophy of Science” (2.5 as opposed to 2.3). Consequently, according to Spanish data there is no underrepresentation of women in technical areas (not more than in “Philosophy,” for example). Given that this is the only argument the authors offer, the hypothesis of a difference in cognitive abilities as an explanation for gender imbalance in philosophy is inconsistent with Spanish data.
The Sticky Floor of Introductory Courses
An aspect of the underrepresentation of women in philosophy that we touched upon previously and that needs explaining has to do with the scarcity of female students. Paxton, Figdor, and Tiberius proposed an interesting series of hypotheses regarding this subject that turn out to be supported by our data:
the proportion of females reliably decreases as one moves through each level in the academy, from introductory courses through the faculty population. . . . [There is] a significant drop in the proportion of women between their enrollment in introductory courses and their registration as philosophy majors . . . there is no comparably significant drop between the proportion of philosophy majors who are female and the proportion of philosophy graduate students who are female . . . the difference between the proportion of graduate students who are female and the proportion of philosophy faculty members who are female is not significant. (Paxton, Figdor, and Tiberius Reference Paxton, Figdor and Tiberius2012, 952)
The first consideration here is the decrease in the proportion of females over the course of their philosophy studies. In the Spanish case, the scissor diagram shows a drop from women representing 36% of students to 26% of philosophy faculty and to a mere 12% of full professors, all of which attests to a progressive decline.
Paxton and her colleagues’ second affirmation holds that the greatest decline in the proportion of women occurs between the introductory courses and women's registration as philosophy majors. The structure of the academic career in philosophy in Spain is quite different from that in the United States.Footnote 16 On the one hand, students’ first contact with philosophy in Spain takes place when they are in high school (ISCED 3), where they take an introduction to philosophy in their junior year and history of philosophy as seniors. Although there are some regional differences, in general this first course is compulsory for all studentsFootnote 17—regardless of the career direction they are specializing in—whereas the second course is offered as an elective, but only for those who are specializing in humanities. Women make up a majority of students who opt for humanities in high school: 62% for the academic year 2016–2017. However, of this majority, only a few later choose philosophy as an academic major, where the percentage of female students drops to 36%.
Although the educational stages at which we make the comparisons are different from those used by Paxton and her colleagues (high school vs. first introductory courses in the major), both studies attest to the disproportionate number of women who, after having taken introductory philosophy courses, choose not to continue studying philosophy at the university level.Footnote 18 In the case of Spain, these courses discourage women from choosing philosophy as a career. Here it is important to highlight the fact that women's not choosing philosophy has nothing to do with their performance in the subject. Although the university entrance exams do not include a compulsory exam in philosophy, students do have the option of taking exams in additional subjects to improve their score. Of the 21,232 students who chose to take the philosophy exam, 67% were women. The mean score was 6.26 for women and 6.03 for men; therefore it is not inferior performance that dissuades women from choosing a major in philosophy
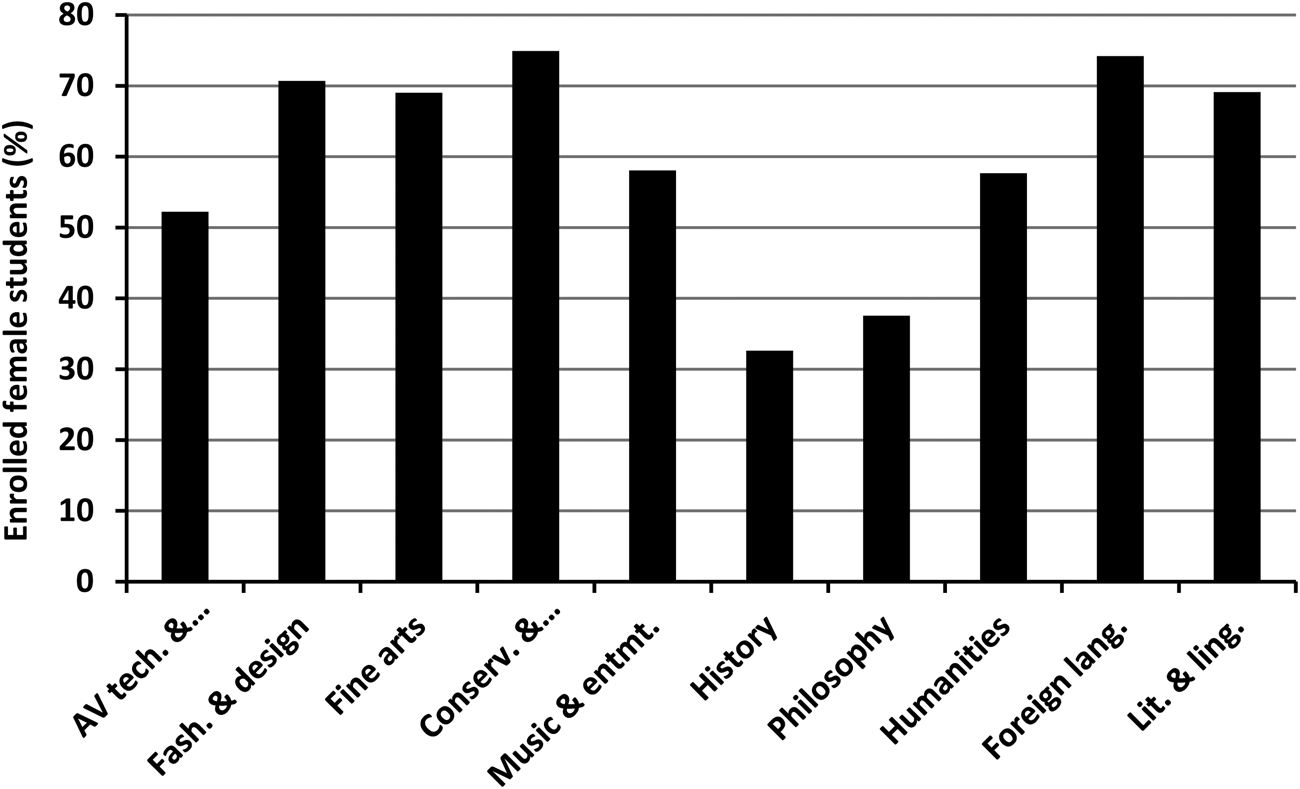
Figure 3 shows the percentage of newly enrolled female students in the different majors falling within the field of humanities. Philosophy and history are anomalies here, as they are the only two humanities majors in which the percentage of female students is below 40%. In the rest of the majors in humanities, women constitute more than half of the students. Although the percentage of women in history is inferior to that of philosophy (32.5%), the ensuing evolution over the course of the major is quite different: in teaching and research positions, the percentage is greater in history (35.5% as opposed to 25.8% in philosophy). In fact, the case of history enables us to eliminate the hypothesis of the scarcity of female students as an explanation for the scant number of women among academic staff, especially in the higher categories. The data for history for grades A, B, and C are 23%, 39%, and 40%, respectively. Grade A is two and a half points above the average for grade A in the university, grade B is one point below, and, curiously enough, grade C presents the largest difference: nine percentage points less.
Percentage of women students in humanities majors (2016–2017)

Regarding the third hypothesis of Paxton and her colleagues, the Spanish data (Table 5) do not show a significant decrease in the proportion of women between ISCED levels 6 and 7. Figures from 2014 show a decrease of one percentage point, whereas those from 2016 show a surprising increase to eight percentage points before falling again to 36% at the doctoral level (ISCED 8).
Concerning the fourth hypothesis, our data do not corroborate the results of Paxton and her colleagues’ study; in Spain we find a difference of ten percentage points between the proportion of students and the proportion of faculty members, which I do consider important.
Field-Specific Abilities Belief Hypothesis
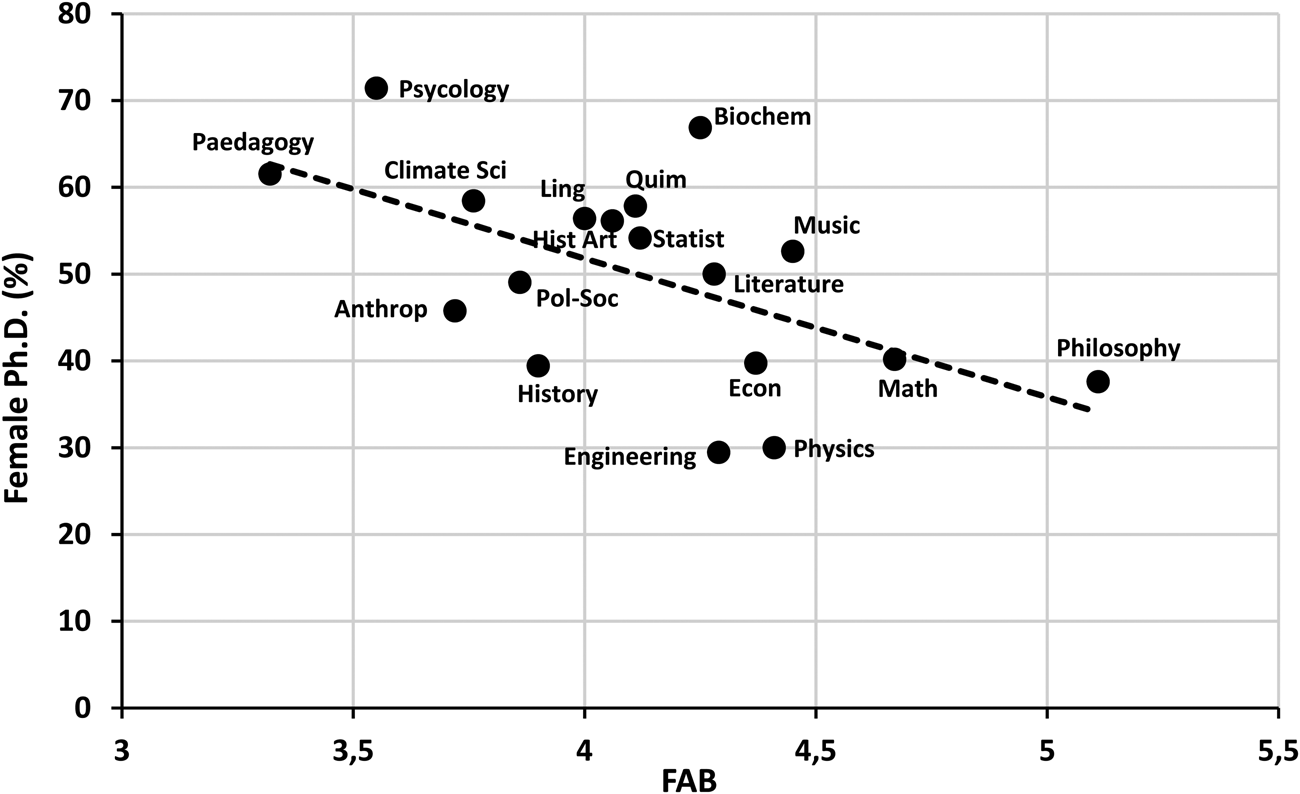
In 2015, Leslie and her colleagues presented a hypothesis that attempted to explain the differences in the representation of women in different majors and careers. The hypothesis was called “field-specific ability belief” (FAB), and it claims that women are underrepresented in those disciplines in which participants believe that they need to be in possession of a specific skill or an innate talent to achieve success (Leslie et al. Reference Leslie, Andrei Cimpian and Freeland2015). Given that cultural stereotypes do not attribute such talents to women, the hypothesis predicts that female representation in a field is associated with a measure of field-specific ability. The researchers carried out a survey to measure belief in requisites for professional practiceFootnote 19 and found a correlation with the percentage of female PhD graduates. I plotted the percentage of Spanish PhD graduates as a function of field-specific ability beliefs from the US data under the assumption that field-specific ability beliefs are similar in Spain and the US.Footnote 20 We can see that, notwithstanding possible cultural differences between the United States and Spain, philosophy is the field for which the greatest number of people believe that a specific talent is required to achieve success. Figure 4 shows a very strong correlation between the number of women in a field of knowledge and the belief of professionals in this field in the need for innate, specific abilities in the area.
Relation between percentage of completed female Spanish PhD theses and the FAB taken from the American survey

This belief in innate, field-specific abilities is probably behind conclusions like that of Sesardic and Clercq analyzed above.
V. Stereotypes, Bias, and Discrimination
Data regarding the presence or absence of women in philosophy is anomalous for several reasons: It is anomalous in its statistical aggregates (humanities) where women have a greater presence. It is anomalous with respect to the number of female students, given that women make up 55% of ISCED 6 students at the university. It is anomalous with regard to women's performance in initial courses in philosophy, where despite being better prepared than their male colleagues, they tend not to choose this discipline. It is anomalous in terms of the proportion of women on the academic staff, not only with respect to its statistical aggregate, humanities, but also with respect to the overall percentage in Spanish universities and with respect to fields that are considered traditionally masculine, like the sciences in which the numbers nonetheless surpass the average of women in philosophy. It is anomalous in the degree to which it is comparable to the differences found in one of the most male-dominated fields of the university, namely, engineering. It is anomalous with regard to the glass ceiling. I noted above that the underrepresentation of women in philosophy is a phenomenon with many facets and probably with many different causes. Regarding female students, a potential cause may be the lack of female role models. According to the data, most of their teachers are male and the studied syllabus consists almost exclusively of male philosophers. Further, the cultural stereotype of a philosopher is not a woman. All these things together may lead female students to perceive that philosophy is not a friendly field for women.
Regarding the underrepresentation of women among faculty members and the glass ceiling that characterizes the academic career of women in philosophy, the best explanation based on the data seems to be the hypothesis of discrimination. Is this discrimination intentional or is it a cultural prejudice? In a meritocratic social system, where discrimination is illegal, the unequal results across sex encourage explanations based on gendered implicit bias and prejudices. Discrimination means unequal treatment of an individual as a result of the influence of certain personal attributes such as sex or race, even when these biases are not consciously endorsed. Regarding the social problem caused by discriminatory treatment, it makes no difference whether it is the result of conscious or unconscious mental processes (Jost et al. Reference Jost, Rudman, Blair, Carney, Dasgupta, Glaser and Hardin2009; Payne and Cameron Reference Payne, Cameron, Gawronski and Keith Payne2010), although it may be different from the point of view of moral responsibility (Washington and Kelly Reference Washington, Kelly, Brownstein and Saul2016). Unconscious discrimination, however, is very difficult to prove.
According to Amy Wax, there are two possible approaches, one prospective and one retrospective. In the first case, “the challenge is to identify the panoply of other possible non-race or sex-based decision making variables, and to use statistical techniques and regression analysis to factor out their influence. . . . [In the second,] one can design experiments to equalize non-protected factors that might affect how a particular person is treated, while varying only that individual's race or sex” (Wax Reference Wax2008, 986).
An example of the first is the classic study by Christine Wenneras and Agnes Wold on the peer review system in the granting of scholarships from the Swedish Medical Research Council (Wenneras and Wold Reference Wenneras and Agnes1997) where it is shown that women had to be 2.5 times more productive than the average man to obtain the same funds. An example of the second is the study by Corinne Moss-Racusin and her colleagues in which identical curriculum vitae were evaluated differently depending on the sex of the candidate, with men valued well above women. These results were independent of the sex of the evaluator, academic rank, scientific field, or age of the evaluator (Moss-Racussin et al. Reference Moss-Racusin, Dovidio, Brescoll, Graham and Handelsman2012), which means that women themselves are not free from implicit bias against women.Footnote 21
Gender norms and stereotypes that permeate our culture lead to discriminatory practices. But it is extremely complex to find a solution to a practice unconsciously maintained by the actors. The first step should be to make the general philosophical community aware of the disparate gender-based results in academic careers within the discipline, the second to disseminate how cultural stereotypes and implicit biases lead to discriminatory practices, even when the actors explicitly hold egalitarian and nonsexist beliefs, so that hiring committee members maintain a vigilant attitude toward their possible implicit sexist biases. As Natalia Washington and Daniel Kelly assert, although people cannot be held morally responsible for actions motivated by unconscious prejudices over which they have no control, they can when that knowledge is available to their community. Their main argument is: “an individual can be open to blame for manifesting implicit biases when knowledge about such mental states is available in her epistemic environment, and that individual occupies a social role to which implicit biases and knowledge about them are clearly relevant” (Washington and Kelly Reference Washington, Kelly, Brownstein and Saul2016, 13).
In appearance, the Spanish system functions as a meritocracy. In order to be hired initially, candidates must meet certain standards, and to be promoted they must have the qualifications and pass an open exam. But forging an academic career depends a great deal on the networks that you belong to. It depends not only on the papers that you publish but on the collective projects in which you participate, on the conferences that you are invited to as a speaker, on the scientific or editorial committees to which you belong, on the journals for which you do reviews. As you are unlikely to obtain these qualifications if you do not belong to the “right” networks, the meritocracy does not eliminate discrimination; often it does just the opposite, reinforcing it. According to Fiona Jenkins, discrimination may be reinforced by meritocracy because entrenched privileges are identified with standards of excellence, and they end up determining the requisites for entering into and moving up within the field (Jenkins Reference Jenkins, Hutchison and Jenkins2013). And this simply leads to the perpetuation of male dominance.
Acknowledgments
This work was supported by the MINECO/FEDER [National Research Project FFI2015-64529-P]. I wish to thank Peter Johannesen for his help with the statistics and fruitful discussions. I would like to thank the three anonymous reviewers for their valuable comments that contributed to improving the final version of the article.
Obdulia Torres-González is an Associate Professor in the Philosophy Faculty of the Salamanca University (Spain). Her research interests are gender and science studies and philosophy of social sciences, with special emphasis on the philosophy of economics, the methodology of social sciences, the theory of social choice, and models of rational action. She is member of a research group dedicated to the analysis of the border between science and politics. She is also co-director of ArtefaCToS, Journal of Science and Technology Studies. omtorres@usal.es