


1. Introduction
1.1. Motivation
Determining insurance premiums is a central part of the underwriting process. In traditional actuarial science, premiums are typically derived using well-established approaches such as the net premium principle, which is based on expected claims and risk loadings (Rolski et al., Reference Rolski, Schmidli, Schmidt and Teugels2009; Teugels and Sundt, Reference Teugels and Sundt2004). However, pricing becomes more complex when competition is introduced. In a highly competitive insurance market, each insurer aims to set its premium level strategically in light of its competitors’ decisions.
Beyond competitive interactions, an additional challenge arises when incorporating risk heterogeneity into this framework. In practice, the pool of potential policyholders is heterogeneous in terms of loss distributions. Individuals of distinct risk types differ in their insurance purchasing behavior. They are aware of their own risk level, whereas such differences are not perfectly observable to insurers (Stiglitz and Rothschild, Reference Rothschild and Stiglitz1976). Consequently, insurers must compete under asymmetric information, which creates frictions that distort the composition of their portfolios. These considerations motivate us to investigate competitive insurance pricing in a heterogeneous market with asymmetric risk information.
1.2. Literature review
Standard actuarial approaches, particularly in non-life insurance, set premiums exclusively based on the distribution of the underlying risk (Kaas et al., Reference Kaas, Goovaerts, Dhaene and Denuit2008). While these principles provide a solid mathematical foundation for pricing, they overlook competitive interactions in practice. To bridge the gap between actuarial pricing and market behavior, Taylor (Reference Taylor1986) provides a pioneering framework that incorporates market competition. He explores the relationship between market behavior and insurers’ optimal response strategies, with the goal of maximizing the expected present value of wealth over a predetermined time horizon. In subsequent work, Taylor (Reference Taylor1987) shows that nonzero expense loadings can lead to significant changes in optimal premiums.
Building on these models, which solve individual optimization problems, the actuarial literature applies game theory to incorporate competition among all market participants. The first cooperative game-theoretic models were developed by Borch (Reference Borch1962, Reference Borch1974), Bühlmann (Reference Bühlmann1980, Reference Bühlmann1984), and Lemaire (Reference Lemaire1984, Reference Lemaire1991). In non-life insurance markets, existing non-cooperative game models can be categorized into two types: (i) the Bertrand oligopoly, in which insurers set premiums, and (ii) the Cournot oligopoly, in which insurers choose business volumes. Emms (Reference Emms2012) proposes both deterministic and stochastic n-player differential games and derives each insurer’s optimal premium strategy from the Nash equilibrium. Dutang et al. (Reference Dutang, Albrecher and Loisel2013) model competition by studying the probabilistic behavior of customers as a function of insurers’ premiums, establishing both the existence and uniqueness of the Nash equilibrium and the existence of a Stackelberg equilibrium in a single-period game. Wu and Pantelous (Reference Wu and Pantelous2017) model customer demand by aggregating all pairwise competitions in the market to determine best-response premium strategies. Mourdoukoutas et al. (Reference Mourdoukoutas, Boonen, Koo and Pantelous2021) propose a static stochastic model to derive equilibrium premium profiles under two exponential demand specifications. More recent work extends the competitive pricing framework to a multi-period repeated-game setting, in which policyholder transitions among insurers follow a discrete-time Markov chain and insurers optimize their one-period-ahead expected utility (Mouminoux et al., Reference Mouminoux, Dutang, Loisel and Albrecher2022). Boonen et al. (Reference Boonen, Koo, Mourdoukoutas and PantelousBoonen et al., 2026) formulate a single-period stochastic insurance duopoly and provide conditions under which the duopolists are more inclined to participate in sequential rather than simultaneous games. However, most models in the literature adopt the simplifying assumption of a homogeneous risk pool.
Asymmetric information is pervasive in real-world markets that buyers possess better information than sellers regarding underlying characteristics or risk types associated with heterogeneous products, which may cause an economic phenomenon called adverse selection. The classic analysis of Akerlof (Reference Akerlof1970) demonstrates that quality uncertainty can lead to market collapse, where “bad” risks drive out “good” risks. In insurance, such heterogeneity is most often reflected in variation in risk levels among potential policyholders. The foundational analysis of adverse selection in insurance is provided by Stiglitz and Rothschild (Reference Rothschild and Stiglitz1976), who show that under asymmetric information, high-risk individuals have a stronger incentive to seek coverage, potentially destabilizing the competitive equilibrium. Complementing this, Grossman (Reference Grossman1979) analyzes “pooling” behavior, in which high-risk buyers strategically hide their identities to imitate low-risk buyers and maintain a risk-pooling structure. However, neither of these works explicitly specifies a competitive game. More recently, Dosis (Reference Dosis2017) studies the existence of a pure strategy Nash equilibrium with adverse selection in a duopoly game. Despite the consideration of heterogeneous risks in strategic competition, the existing literature differs substantially from our framework. In particular, most models either focus on equilibrium existence without explicitly modeling policyholder demand behavior or assume homogeneous demand responses across individuals. In contrast, our model considers a multi-insurer market with heterogeneous loss distributions and type-dependent demand behavior. In addition to the equilibrium existence, it allows us to study how premium competition interacts with heterogeneous policyholder behavior to reshape the risk composition of insurers’ portfolios.
1.3. Our contribution
Building on the previous literature, this paper makes three main contributions to the study of competitive insurance pricing with heterogeneous risks. First, we propose a heterogeneous competitive insurance market model with two distinct risk types of potential policyholders (high and low risk). These two types differ in their loss models and behavioral patterns. Instead of assuming a homogeneous risk pool as in most existing works, our model provides a more realistic description of how potential policyholders react to premium changes by allowing type-specific parameters. With type-dependent behavioral asymmetries, we show how risk heterogeneity gradually affects the competitive pricing.
Second, we develop a stochastic demand model via a Markov chain that captures potential policyholders’ transition behavior explicitly. This model builds directly on the framework of Mouminoux et al. (Reference Mouminoux, Dutang, Loisel and Albrecher2022), who consider customer switching among insurers under homogeneous risk. We extend the framework by incorporating the non-insured state, which yields a richer demand structure including lapse, switching, and re-entry transitions.
Third, while Mouminoux et al. (Reference Mouminoux, Dutang, Loisel and Albrecher2022) replace their Markovian demand by a simplified linear function of premiums to obtain a tractable objective function, we retain the full transition probabilities directly in the insurers’ expected-utility objectives. This allows us to preserve the nonlinear relationship between premiums and exposure flows. As a result, we find sufficient conditions for the existence of a Nash equilibrium.
The remainder of this paper is structured as follows: Section 2 defines our notation, market structure, and loss model. Section 3 presents the demand structure with heterogeneous risk types. In Section 4, we formulate the optimization problem faced by insurers and investigate the existence of a Nash equilibrium. Section 5 illustrates the results with numerical examples. Finally, Section 6 concludes. All proofs are delegated to the Appendix.
2. Notation, market structure, and loss model
2.1. Basic notation
The main model parameters used in this paper are summarized in Table 1, categorized by their roles.
Summary of model parameters.

Table 1. Long description
Seventeen model parameters are grouped into five categories. Risk structure is described by policyholders’ high or low risk type and the proportion of high-risk types. Six behavioral parameters capture sensitivity to premiums in lapse, switching, insurance purchase, and insurer selection, as well as insurer-specific sensitivity and status-quo bias. High-risk policyholders are assumed to be no more premium-sensitive than low-risk policyholders. Four premium variables distinguish insurer-specific and market-average premiums across periods 0 and 1. Four exposure and portfolio variables describe initial, realized, and expected exposures and the Markov transition matrix governing lapse, switching, and insurance entry. The final parameter represents each insurer’s exponential-utility risk aversion.
2.2. Market structure
We consider a competitive insurance market with a finite set of insurers
 $\mathscr{I} = \{1,2,\ldots,m\}$
, which form the set of players in the game. Each insurer determines its best-response premium based on the competitive pressure. The underwriting process is governed by three key components: (i) the loss model to capture how claims occur; (ii) the demand structure to describe how customers transition among market states, and (iii) the insurers’ objectives, which determine how they set their optimal premium strategies.
The risk pool consists of heterogeneous individuals belonging to one of two risk types
 $\lambda \in \{H, L\}$
, where H denotes high-risk individuals and L denotes low-risk individuals. Let
 $\eta\in (0,1)$
denote the proportion of high-risk types in the market; the proportion of low-risk types is
 $1-\eta$
. We assume a constant market exposure size
 $n_{\mathrm{tot}}$
for all periods, which can be decomposed into
 \begin{align*}n_{H} = \eta n_{\mathrm{tot}}, \qquad n_{L} = (1-\eta) n_{\mathrm{tot}},\end{align*}
which are rounded to the nearest integer while preserving
 $n_H+n_L=n_{\mathrm{tot}}$
.
2.3. Loss model with heterogeneous risk types
In this section, we define the collective risk model to capture the claim behavior of policyholders. We incorporate heterogeneous risk types among potential policyholders, with different loss distributions specified.
Let
 $X^{(\lambda)}$
denote a representative non-negative claim amount of a policyholder of risk type
 $\lambda \in \{H,L\}$
. Consider an insurer
 $i \in \{1,2,\dots,m\}$
who underwrites
 $N_{i,\lambda}$
policies during the period to policyholders of type
 $\lambda$
. Conditional on
 $N_{i,\lambda}$
, the total aggregate losses
 $S_i(N_{i,H},N_{i,L})$
faced by insurer i, for the period under consideration, are defined as:
 \begin{equation}S_i(N_{i,H},N_{i,L})= \sum_{j=1}^{N_{i,H}} X_{i,j}^{(H)}+ \sum_{j=1}^{N_{i,L}} X_{i,j}^{(L)},\end{equation}
where
 $X_{i,j}^{(H)}\sim X^{(H)}$
and
 $X_{i,j}^{(L)}\sim X^{(L)}$
.
Throughout this paper, we make the following assumptions for the loss model:
Assumption 1. For each type
 $\lambda \in \{H,L\}$
, the individual claim amounts
 $\{X^{(\lambda)}_{i,j}\}_{j \ge 1}$
are i.i.d. non-negative random variables, independent of the portfolio sizes
 $N_{i,\lambda}$
, and independent across risk types.
Assumption 2. To capture differences in claim behavior between high- and low-risk individuals, assume that
 $X^{(H)}$
first-order stochastically dominates
 $X^{(L)}$
, that is,
 $\mathbb{P}(X^{(H)}\le x)\le \mathbb{P}(X^{(L)}\le x)$
for all
 $x\ge 0$
.
Assumption 2 states that low-risk types have a lower expected claim amount and a greater probability of a zero claim.
3. Demand structure with heterogeneous risk types
In this section, we develop a stochastic demand model that characterizes how the potential policyholders of two risk types respond to premium changes. The model explicitly describes transition probabilities that capture heterogeneous behavioral responses driven by type-specific sensitivity parameters. Extending the demand structure in Dutang et al. (Reference Dutang, Albrecher and Loisel2013), we include transitions between non-insured and insured states in our model. The demand structure ultimately produces an expected exposure flow vector
 $\mathbf{q}_{\lambda}$
for each type of risk
 $\lambda$
, which determines the distribution of the realized number of policies
 $N_{i,\lambda}$
across insurers.
3.1. Markovian demand model
The insurance market is segmented into two independent pools based on two risk types: a high-risk type (H) and a low-risk type (L).Footnote
1
For each risk type
 $ \lambda \in \{H, L\} $
, the system is modeled as a discrete-time Markov chain with state space
 \begin{align*}\mathscr{S} = \{0,1,\ldots,m\},\end{align*}
where state 0 represents the non-insured state, that is, the individual does not hold an active policy. For
 $i = 1, 2,\dots, m $
, state i indicates that the policyholder holds an active policy with insurer i.
The chain evolves over discrete time periods (e.g., from period 0 to period 1), with transition behaviors influenced by premiums
 $ p_{i,0} $
(previous period) and
 $ p_{i,1} $
(current period), as well as market averages
 $ \bar{p}_0 $
and
 $ \bar{p}_1 $
, defined as
 \begin{align*}\bar p_t = \frac{1}{m}\sum_{i=1}^m p_{i,t}.\end{align*}
Moreover, the transition depends on the sensitivity parameters associated with each risk type and with each insurer’s market power. For each risk type
 $\lambda$
, the transition probabilities form an
 $(m+1)\times(m+1)$
transition matrix:
 \begin{align*}P_{\lambda} = (P_{\textit{j,i},\lambda})_{0 \le \,j,i \le m},\end{align*}
where the j-th row sums to 1, as a policyholder currently in state j must transition to exactly one of the
 $m+1$
possible states. For each risk type
 $\lambda$
, the transition matrix
 $P_{\lambda}$
is treated as an exogenously specified behavioral model. Once the premium vector is given, all transition probabilities are fully determined. The Markovian structure is similar to that in Dutang et al. (Reference Dutang, Albrecher and Loisel2013), but it includes additional entry and lapse mechanisms. Figure 1 demonstrates the state transition diagram for the demand Markov chain.
State transition diagram for the demand Markov chain.

Remark 1. The transition probabilities introduced below are intended to represent aggregate demand behavior rather than deterministic policyholder choices. While lower premiums increase the attractiveness of an insurer, policyholders are not assumed to switch instantaneously to the cheapest contract. This specification is intended to capture customer inertia, switching frictions, and other non-price factors commonly observed in insurance markets.
Transitions from Insured States
A policyholder of risk type
 $ \lambda $
who is currently insured with insurer j is assumed to follow a two-stage transition mechanism:
-
(i) Stage 1: Lapse transition: transfer from state j to state 0;
-
(ii) Stage 2: Conditional insurer transition: remain with j or switch to another insurer
 $i\neq j$
.

Stage 1: Lapse Transition
The probability of lapsing (transitioning to non-insured state 0) is formulated as:
 \begin{equation} { P_{j,0, \lambda} =1- \exp\left( -\kappa_{\lambda} \gamma_j \frac{\bar{p}_1}{\bar{p}_0} \right){\!}, }\end{equation}
The lapse probability depends on the ratio
 $\bar p_1/\bar p_0$
, which captures changes in the overall market premium level. Here,
 $\gamma_j$
quantifies the specific premium sensitivity relative to insurer j, driven by some factors such as market power and reputation of the company, and
 $\kappa_{\lambda}$
is a key parameter to distinguish the difference between the two types of risk. We assume
 $\kappa_{H}\leq\kappa_{L}$
since high-risk types are usually more price-tolerant. As insurance becomes more expensive relative to the previous period, policyholders are more likely to leave the market. The exponential form guarantees
 $0 \lt P_{j,0,\lambda}\lt1$
and provides a smooth increasing response to premium increases.
For an individual who is currently insured, the probability of remaining insured (staying active) is
 $1 - P_{j,0, \lambda}$
.
Stage 2: Conditional Insurer Switching
Conditional on staying insured for risk type
 $\lambda$
, probability mass is allocated across the insured states, including the incumbent insurer j and competing insurers
 $i\in\{1,\ldots,m\}\setminus\{\,j\}$
. The allocation is governed by the following relative-premium choice model: We first define a relative-premium choice model to quantify the attractiveness of insurer i relative to j:
 \begin{align*}f_{j,i,\lambda}=\alpha_{\lambda}\gamma_j \frac{p_{j,1}}{p_{i,1}} -h,\qquad i\neq j,\end{align*}
where
 $p_{\cdot,1}$
denotes current-period premiums. The ratio
 $ \frac{p_{j,1}}{p_{i,1}} $
captures the relative current price level of insurer j relative to insurer i. For policyholders currently insured by j, a lower value of
 $p_{i,1}$
relative to
 $p_{j,1}$
increases the attractiveness of insurer i. The parameter
 $\alpha_{\lambda}\gamma_j$
represents the price sensitivity jointly affected by risk type
 $\lambda$
and insurer j. The status-quo bias parameter h introduces stickiness by penalizing switching, which reflects the effect that policyholders tend to stay in their current state.
The conditional transition probability from state j to state i is formulated by:
 \begin{align*}P_{j,i,\lambda \mid i \neq 0 } =\begin{cases}\dfrac{1}{1 + \sum_{l \neq j}\exp(\,f_{\,\textit{j,l,}\lambda})} & \text{if } i = j, \\[15pt]\dfrac{\exp(\,f_{j,i,\lambda}) }{1 + \sum_{l \neq j}\exp(\,f_{\,\textit{j,l,}\lambda})} & \text{if } i \neq j.\end{cases}\end{align*}
The conditional transition probabilities follow a multinomial-logit structure. Insurers offering relatively lower premiums attract a larger share of the transition probability mass, while the parameter h introduces a status-quo effect that favors the incumbent insurer. According to the concept of “status quo bias” in Kahneman et al. (Reference Kahneman, Knetsch and Thaler1991), individuals tend to remain in their current state. Since they tend to overestimate the value of existing policies, they need a significant incentive (i.e., a sharp price reduction) to be willing to pay the conversion cost. At equal premiums,
 $p_{j,1}=p_{i,1}$
, the status-quo bias is present when
 \begin{align*}h\gt\alpha_{\lambda}\gamma_j,\end{align*}
because then
 $f_{j,i,\lambda}\lt0$
for every
 $i\neq j$
, so the incumbent state receives more conditional probability mass than each competing insurer. Consequently, policyholders do not immediately switch to the cheapest insurer, allowing the model to capture customer inertia and switching frictions commonly observed in insurance markets. Combining the two-stage transition mechanism together, the full probability of a policyholder with risk type
 $\lambda$
currently with insurer j to transfer to insurer i is
 \begin{equation}P_{j,i,\lambda} \;=\; \bigl(1 - P_{j,0,\lambda}\bigr)\,P_{j,i,\lambda \mid i \neq 0},\qquad i \neq 0.\end{equation}
Transitions from the Non-Insured State
For an individual of risk type
 $ \lambda $
currently non-insured (state 0), the transition process is modeled analogously to the insured case and consists of two stages:
-
(i) Stage 1: Market entry transition: move from state 0 to the insured market;
-
(ii) Stage 2: Conditional insurer transition: selection to insurer
$i\in\{1,2,\ldots,m\}$
conditional on market entry.

Stage 1: Insurance Entry Transition
The probability of entering the insurance market is modeled by:
 \begin{align*} I_{\lambda} = \exp\left( -\theta_{\lambda} \frac{\bar{p}_1}{\bar{p}_0} \right){\!}, \end{align*}
where
 $\theta_{\lambda}\gt0$
controls the sensitivity of market entry to the aggregate premium change represented by the ratio
 $\bar{p}_1 / \bar{p}_0$
. Such a sensitivity parameter
 $\theta_{\lambda}$
captures behavioral differences between the risk types. High-risk individuals are expected to have a stronger incentive to purchase insurance (Hofmann and Browne, Reference Hofmann and Browne2013). Hence,
 $\theta_H$
is assumed to be lower than
 $\theta_L$
. The exponential specification guarantees a probability in (0,1) and generates a decreasing response to increases in market-wide premium levels.
The entry probability depends on the aggregate premium ratio
 $\bar p_1/\bar p_0$
, which is consistent with the lapse probability introduced before. This reflects the assumption that uninsured individuals will first assess the overall affordability of insurance before considering specific insurance companies. The function
 $I_{\lambda}$
is decreasing in the premium ratio
 $\bar{p}_1 / \bar{p}_0$
, which implies fewer non-insured individuals will buy insurance when the average premium level increases compared with the previous period. When the current average premium is substantially lower than the previous one (i.e.,
 $\bar p_1 \ll \bar p_0$
), we have
 $\bar p_1 / \bar p_0 \approx 0$
and thus
 $I_{\lambda} \approx 1$
. We interpret this as a situation in which almost all currently non-insured individuals find insurance sufficiently attractive to enter the market.
The probability of remaining non-insured is
 \begin{equation}P_{0,0,\lambda}= 1 - I_{\lambda} = 1 - \exp\left( -\theta_{\lambda} \frac{\bar{p}_1}{\bar{p}_0} \right){\!}.\end{equation}
Stage 2: Conditional Insurer Selection
Conditional on entering the market, newly insured individuals are assumed to have no incumbent insurer and therefore no status-quo bias. The individual selects among m insurers based on the following probability function:
 \begin{align*}P_{0,i,\lambda \mid i \neq 0}=\frac{\exp (\!-{\delta_{\lambda}} \gamma_i p_{i,1})}{\sum_{k=1}^m \exp (\!-{\delta_{\lambda}} \gamma_k p_{k,1})},\end{align*}
where
 $ {\delta_{\lambda} \gt 0} $
(
 ${ \delta_H \leq \delta_L }$
) tunes sensitivity to relative premium levels. The multinomial-logit specification allocates entry demand across insurers according to their relative premium attractiveness. Here, we add a negative sign for the formula to ensure that when
 $p_{i,1}$
increases, the conditional probability that insurer i is selected decreases.
Combining the two stages, we obtain the transition probabilities from state 0:
 \begin{equation}P_{0,i,\lambda} = \exp\!\left( -\theta_{\lambda} \frac{\bar{p}_1}{\bar{p}_0} \right)\cdot \frac{\exp\!(\!-{\delta_{\lambda}} \gamma_i p_{i,1})}{\sum_{k=1}^m \exp\!(\!-{\delta_{\lambda}} \gamma_k p_{k,1})},\qquad i \neq 0.\end{equation}
Assumption 3. For each risk type
 $\lambda$
, policyholder demand is represented by a discrete-time Markov chain on the state space
 $\{0,1,\ldots,m\}$
. The transition probabilities are specified exogenously by a matrix
 $P_{\lambda} = (P_{j,i,\lambda})$
, where
 $P_{j,i,\lambda}$
denotes the probability of transitioning from state j to state i. The full transition matrix is
 \begin{align*}P_{\lambda}=\left(\begin{array}{c@{\quad}c@{\quad}c@{\quad}c}P_{0,0,\lambda} & P_{0,1,\lambda} & \cdots & P_{0,m,\lambda} \\P_{1,0,\lambda} & P_{1,1,\lambda} & \cdots & P_{1,m,\lambda} \\\vdots & \vdots & \ddots & \vdots \\P_{m,0,\lambda} & P_{m,1,\lambda} & \cdots & P_{m,m,\lambda}\end{array}\right)\!.\end{align*}
Each row sums to 1, and each entry is given by the model above. Once premiums are fixed, the transition matrix
 $P_{\lambda}$
is fully determined, which characterizes the demand dynamics implied by the model.
3.2. Exposure flow
Based on the Markov transition matrices derived in the previous subsections, the movements of each risk type
 $\lambda \in \{H, L\}$
across the
 $(m+1)$
market states are determined. In the following subsections, we will present the detailed formulas to illustrate the logic of exposure dynamics. There are two levels of portfolio evolution, expected exposures
 $\mathbf{q}_{\lambda}$
and realized portfolios
 $\mathbf{N}_{\lambda}$
, which together describe how premiums influence demand.
3.2.1. Expected exposure
At the beginning of the period, type-
 $\lambda$
individuals are distributed across the
 $(m+1)$
states according to the vector
 $\mathbf{n}_{\cdot,\lambda}=(n_{0,\lambda},n_{1,\lambda},\ldots,n_{m,\lambda})$
. We define the initial exposure vector for risk type
 $\lambda$
:
 \begin{align*}\mathbf{n}_{\cdot,\lambda}=\bigl(n_{0,\lambda},\, n_{1,\lambda},\,\ldots,\,n_{m,\lambda}\bigr),\qquad \sum_{i=0}^m n_{i,\lambda} = n_{\lambda},\end{align*}
where
 $n_{\lambda}$
denotes the total number of type-
 $\lambda$
individuals. As mentioned in Section 2.2, we have
 $n_H = \eta n_{\text{tot}}$
and
 $n_L = (1-\eta) n_{\text{tot}}$
. We assume that the total number of potential policyholders of type
 $\lambda$
remains constant over time.
Given the initial distribution of individuals
 $\mathbf{n}_{\cdot,\lambda}$
and the transition matrix
 $P_{\lambda} = (P_{j, i,\lambda})_{0\le j,i\le m}$
derived from the Markov structure, the vector of expected exposures at period 1 can be obtained as
 \begin{align*}\mathbf{q}_{\lambda}=\mathbf{n}_{\cdot,\lambda} P_{\lambda}.\end{align*}
Specifically, the expected exposure volume of type-
 $\lambda$
individuals insured with the insurer i at period 1 is
 \begin{align*}q_{i,\lambda}=\sum_{j=0}^m n_{j,\lambda} \, P_{j,i,\lambda}.\end{align*}
3.2.2. Realized portfolio
While
 $q_{i,\lambda}$
denotes the deterministic expected exposures, the actual number of policies N sold by insurer i for type-
 $\lambda$
individuals is random. To capture such variations in individuals’ movements across insurers, we model the randomness explicitly. For each risk type
 $\lambda \in \{H,L\}$
, the realized portfolio in period 1 is represented by the random vector:
 \begin{align*}\mathbf{N}_{\lambda}=\bigl(N_{0,\lambda}, N_{1,\lambda}, \ldots, N_{m,\lambda}\bigr),\qquad \sum_{i=0}^m N_{i,\lambda} = n_{\lambda}.\end{align*}
In the game setting, we assume that, for each risk type
 $\lambda$
, transitions among the
 $m+1$
states follow the Markov transition probabilities given by
 $P_{\lambda}$
. The realized allocation is then approximated as a multinomial distribution with parameters
 $n_{\lambda}$
and the probability vector:
 \begin{align*}\boldsymbol{\pi}_{\lambda}=\left(\pi_{0,\lambda},\,\pi_{1,\lambda},\,\ldots,\,\pi_{m,\lambda}\right)\!,\qquad \pi_{i,\lambda}=\frac{q_{i,\lambda}}{n_{\lambda}},\end{align*}
and the approximation is due to Mouminoux et al., (Reference Mouminoux, Dutang, Loisel and Albrecher2022, Proposition 3). Hence, under this multinomial approximation,
 \begin{align*}\mathbf{N}_{\lambda}\;=\bigl(N_{0,\lambda}, N_{1,\lambda}, \ldots, N_{m,\lambda}\bigr)\sim\;\mathrm{Multinomial}\!\left(n_{\lambda},\,\boldsymbol{\pi}_{\lambda}\right)\!,\qquad \sum_{i=0}^m N_{i,\lambda} = n_{\lambda},\end{align*}
which represents the approximating multinomial draw over the
 $(m+1)$
states, where
 $\mathbf{N}_{H}$
and
 $\mathbf{N}_{L}$
are assumed to be independent. The formulation ensures consistency with the expected exposure q:
 \begin{align*}\mathbb{E}[N_{i,\lambda}]=n_{\lambda} \pi_{i,\lambda}=q_{i,\lambda}.\end{align*}
Thus,
 \begin{align*}\mathbf{q}_{\lambda}=\mathbb{E}[\mathbf{N}_{\lambda}].\end{align*}
Under the multinomial distribution approximation, the marginal distribution of the actual number of type-
 $\lambda$
policyholders allocated to insurer i follows a binomial distribution:
 \begin{align*}N_{i,\lambda}\;\sim\;\mathrm{Binomial}\!\left(n_{\lambda},\; \pi_{i,\lambda}\right),\qquad i = 0,1,\ldots,m.\end{align*}
Lemma 1. The probability generating function (PGF) of
 $N_{i,\lambda}$
is given by:
 \begin{align*}\mathbb{E}[s^{N_{i,\lambda}}]=\bigl(1 - \pi_{i,\lambda} + \pi_{i,\lambda}s\bigr)^{n_{\lambda}},\qquad s \in \mathbb{R}.\end{align*}
4. The objectives of the insurers
In this section, we describe the optimization problem faced by each insurer and thus analyze the Nash equilibrium in the competitive insurance market.
4.1. Individual optimization problem
Insurer
 $i \in \{1,2,\ldots,m\}$
sets the insurance contract at a premium level
 $p_{i,1} \gt 0$
. When the period
 $t=1$
is clear from the context, we write
 $p_i$
instead of
 $p_{i,1}$
. With initial capital
 $w_i^0$
, the insurer determines its premium to maximize the expected utility of its terminal wealth
 $W_i^1$
. After collecting premiums and paying claims, the terminal wealth of insurer i is given by
 \begin{equation}W_i^1 = w_i^0 + (N_{i,H}+N_{i,L}) p_i - S_i(N_{i,H},N_{i,L}),\end{equation}
where
 $N_{i,\lambda}$
is the number of policies sold by insurer i to risk-type
 $\lambda$
, and
 $S_i(N_{i,H},N_{i,L})$
is the aggregate claim amount formulated in (1).
We assume that insurer i charges a common premium
 $p_i$
to all policyholders, regardless of their risk type. This assumption is intentional: the objective of the paper is to study how premium competition interacts with heterogeneous claim distributions and type-dependent demand behavior when insurers cannot perfectly separate risk types.
Following Mourdoukoutas et al. (Reference Mourdoukoutas, Boonen, Koo and Pantelous2021), we assume that all insurers are exponential expected-utility maximizers with their own risk aversion parameters
 $\beta_i$
. The utility function is formulated as:
 \begin{equation}u_i(w) = -e^{-\beta_i w}.\end{equation}
Throughout this paper, we make the following assumption.
Assumption 4. Let
 $M_X^{(H)}(\beta_i)=\mathbb{E}[e^{\beta_i X^{(H)}}]\lt\infty$
for all
 $i\in\{1,2,\ldots,m\}$
.
This assumption implies that the risk aversion parameters cannot be too large, so that the relevant expectations exist. Note that by first-order stochastic dominance of
 $X^{(\lambda)}$
(Assumption 2), this implies
 $M_X^{(L)}(\beta_i)\leq M_X^{(H)}(\beta_i)\lt\infty$
. This regularity assumption is needed for the following result.
Proposition 1. Given that insurer i ’s risk aversion parameter is
 $ \beta_i \gt 0 $
and that the number of policies satisfies
 \begin{align*}\mathbf{N}_{\lambda}=(N_{0,\lambda}, N_{1,\lambda}, \ldots, N_{m,\lambda})\;\sim\; \mathrm{Multinomial}\!\left(n_{\lambda},\,\boldsymbol{\pi}_{\lambda}\right)\!,\end{align*}
the expected utility of insurer i ’s terminal wealth is given by
 \begin{equation}\mathbb{E}\big[ u_i\left(W_i^{1}\right) \big]=- e^{-\beta_i w_i^{0}}\left[1 - \pi_{i,H} + \pi_{i,H} e^{-\beta_i p_i} M_X^{(H)}(\beta_i)\right]^{n_{H}}\left[1 - \pi_{i,L} + \pi_{i,L} e^{-\beta_i p_i} M_X^{(L)}(\beta_i)\right]^{n_{L}}\!,\end{equation}
where
 \begin{align*}\pi_{i,\lambda}=\frac{q_{i,\lambda}}{n_{\lambda}}.\end{align*}
Since
 $\mathbb{E}[u_i(W_i^1)] \lt 0$
, we convert the maximization problem into an equivalent minimization problem:
 \begin{align}\max_{p_i} \mathbb{E}\left[u_i\left(W_i^1\right)\right] \quad \Leftrightarrow \quad & \min_{p_i} \left\{ -\mathbb{E}\left[u_i\left(W_i^1\right)\right] \right\}\end{align}
 \begin{align}& \Leftrightarrow \quad \min_{p_i} \left\{ \ln\left(-\mathbb{E}\left[u_i\left(W_i^1\right)\right]\right) \right\}{\!}.\end{align}
Thus, we can rewrite the optimization problem as:
 \begin{equation}-\beta_i w_i^0 \;+\; n_H\; \ln\!\big(1 - \pi_{i,H}(\mathbf{p}) + \pi_{i,H}(\mathbf{p})\,e^{-\beta_i p_i}\,M_X^{(H)}(\beta_i)\big)+\; n_L\; \ln\!\big(1 - \pi_{i,L}(\mathbf{p}) + \pi_{i,L}(\mathbf{p})\,e^{-\beta_i p_i}\,M_X^{(L)}(\beta_i)\big),\end{equation}
where we write
 $\pi_{i,\lambda}(\mathbf{p})$
to indicate the dependence on the premiums in the market. Note that the initial wealth level will not affect the optimal solution since
 $w_i^0$
is a constant that does not depend on the premium, which simplifies the model. Finally, this leads to a minimization problem of the cost function
 $O_i$
:
 \begin{equation}O_i(\,p_i,p_{-i})=\sum_{\lambda \in \{H,L\}} n_{\lambda} \ln\left( 1 - \pi_{i,\lambda}(\mathbf{p}) + \pi_{i,\lambda}(\mathbf{p}) e^{-\beta_i p_i} M_X^{(\lambda)}(\beta_i) \right){\!}.\end{equation}
To derive the insurer’s optimal pricing strategy, we begin by decomposing the cost function to obtain its first-order derivative. Define
 \begin{equation}A_{i,\lambda}(\mathbf{p})=1+\pi_{i,\lambda}(\mathbf{p})\left( B_{i,\lambda}(\,p_i)\right),\qquad B_{i,\lambda}(\,p_i)=e^{-\beta_i p_i}M_X^{(\lambda)}(\beta_i)-1,\end{equation}
so that
 $O_i(\mathbf{p}) = \sum_{\lambda} n_{\lambda} \ln A_{i,\lambda}(\mathbf{p})$
. From an economic perspective, the term
 $B_{i,\lambda}(\,p_i)$
measures the zero-utility equivalent underwriting cost per contract, while
 $\pi_{i,\lambda}(\mathbf{p})$
represents the corresponding probability for insurer i to acquire such a contract.
Differentiating yields the compact first-order derivative:
 \begin{equation}\frac{\partial O_i}{\partial p_i}=\sum_{\lambda}\frac{n_{\lambda}}{A_{i,\lambda}(\mathbf{p})}\left[\frac{\partial \pi_{i,\lambda}}{\partial p_i}\, B_{i,\lambda}(\,p_i)-\pi_{i,\lambda}(\mathbf{p})\,\beta_i e^{-\beta_i p_i} M_X^{(\lambda)}(\beta_i)\right]{\!},\end{equation}
where
 \begin{align*}\frac{\partial \pi_{i,\lambda}}{\partial p_i}=\frac{1}{n_{\lambda}}\frac{\partial q_{i,\lambda}}{\partial p_i}=\frac{1}{n_{\lambda}}\sum_{j=0}^{m}n_{j,\lambda}\frac{\partial P_{j,i,\lambda}}{\partial p_i}.\end{align*}
The derivative
 $\partial P_{j,i,\lambda}/\partial p_i$
depends on the initial state j of the policyholder. To characterize how a marginal change in
 $p_i$
affects market share, the derivative can be naturally divided into the following three components:
 \begin{align*}\frac{\partial \pi_{i,\lambda}}{\partial p_i}=\frac{1}{n_{\lambda}}\left( \mathscr{T}_1^{\ \lambda} + \mathscr{T}_2^{\ \lambda} + \mathscr{T}_3^{\ \lambda} \right),\end{align*}
where each
 $\mathscr{T}_k^{\ \lambda}$
captures a distinct channel through which a marginal increase in
 $p_i$
affects the expected number of type-
 $\lambda$
policies sold by insurer i:
-
(i) Transition from the non-insured state (
$j=0$
).The price sensitivity of the probability for a non-insured to select insurer i is
The term
\begin{align*}\mathscr{T}_1^{\ \lambda}=n_{0,\lambda}\,\frac{\partial P_{0,i,\lambda}}{\partial p_i}=n_{0,\lambda} P_{0,i,\lambda}\left[-\frac{\theta_{\lambda}}{m\bar{p}_0}-{\delta_{\lambda}}\gamma_i\left(1-\frac{e^{-{\delta_{\lambda}}\gamma_i p_{i}}}{\sum_{k=1}^m e^{-{\delta_{\lambda}}\gamma_k p_k}}\right)\right]{\!}.\end{align*}
$\mathscr{T}_1^{\ \lambda}$
captures the impact of pricing on market expansion. It measures how premium changes affect the ability of insurers to attract originally uninsured individuals to enter the insurance market. The first component
$- \frac{\theta_{\lambda}}{m\bar{p}_0}$
reflects the overall affordability of insurance, which depends on the initial average market premium. For a fixed amount of premium increase, the entry probability decreases more sharply when
$\bar p_0$
is lower. The second component reflects the competitive attractiveness across insurers. Both components play an important role when the proportion of uninsured individuals is large.


-
(ii) Transition from other insurers (
$j\neq i$
).For policyholders initially with a different insurer j, the full transition probability is
$P_{j,i,\lambda}=(1-P_{j,0,\lambda})P_{j,i,\lambda\mid i\neq 0}$
. The derivative with respect to
$p_i$
yields
\begin{align*}{\mathscr{T}_2^{\ \lambda}=\sum_{\substack{j=1\\ j\neq i}}^{m}n_{j,\lambda}\frac{\partial P_{j,i,\lambda}}{\partial p_i}=-\sum_{\substack{j=1\\ j\neq i}}^{m}n_{j,\lambda}\gamma_j P_{j,i,\lambda}\left[\left(1-\frac{\exp(\,f_{j,i,\lambda})}{1+\sum_{l\neq j}\exp(\,f_{j,l,\lambda})}\right)\alpha_{\lambda} \frac{p_{j,1}}{p_{i,1}^2}+\frac{\kappa_{\lambda}}{m\bar p_0}\right]{\!}.}\end{align*}
The term
$\mathscr{T}_2^{\ \lambda}$
reflects the competitive switching effect between insurers. The negative sign of
$\mathscr{T}_2^{\ \lambda}$
implies that as insurer i raises its premium, its relative attractiveness decreases, reducing the probability that policyholders transfer from insurer j to insurer i. The magnitude of the effect depends on two key components. The first component
$\alpha_{\lambda} \frac{p_{j,1}}{p_{i,1}^2}$
measures the sensitivity of switching behavior to relative premium level. A larger
$\alpha_{\lambda}$
implies stronger competition responsiveness, while its inverse-square relationship on
$p_{i,1}$
shows that the switching probability is particularly sensitive when insurer i offers relatively low premiums. The second component
$\frac{\kappa_{\lambda}}{m\bar p_0}$
reflects the effect of overall market affordability on switching behavior. Such an effect will be amplified with a greater lapse sensitivity
$\kappa_{\lambda}$
or a lower benchmark premium level
$\bar p_0$
.


-
(iii) Self-retention (
$j=i$
).Regarding a policyholder who is currently with insurer i, the derivative of probability
$P_{\textit{i,i,}\lambda}$
relative to
$p_i$
is
\begin{align*}{\mathscr{T}_3^{\ \lambda}=n_{i,\lambda}\frac{\partial P_{\textit{i,i,}\lambda}}{\partial p_i}=-n_{i,\lambda}\frac{\gamma_i\exp\!\left(\!-\kappa_{\lambda}\gamma_i\frac{\bar p_1}{\bar p_0}\right)}{(1+\sum_{l\neq i}\exp(\,f_{\textit{i,l,}\lambda}))^2}\left[\frac{\kappa_{\lambda} (1+\sum_{l\neq i}\exp(\,f_{\textit{i,l,}\lambda}))}{m\bar p_0}+\alpha_{\lambda}\sum_{l\neq i}\frac{\exp(\,f_{\textit{i,l,}\lambda})}{p_{l,1}}\right]\!.}\end{align*}
The term
$\mathscr{T}_3^{\ \lambda}$
captures the self-retention effect of insurer i. Similarly to
$\mathscr{T}_1^{\ \lambda}$
and
$\mathscr{T}_2^{\ \lambda}$
, the negative sign shows that an increase in insurer i’s premium lowers the probability that its existing policyholders remain with the insurer. The term
$\frac{\kappa_{\lambda}}{m\bar p_0}(1+\sum_{l\neq i}\exp(\,f_{\textit{i,l,}\lambda}))$
indicates the lapse channel. Either a larger lapse sensitivity
$\kappa_{\lambda}$
or a lower benchmark premium level
$\bar p_0$
could magnify the effect. The other term
$\alpha_{\lambda} \sum_{l\neq i} \frac{\exp(\,f_{\textit{i,l,}\lambda})}{p_{l,1}}$
captures the competitive switching channel, where the retention probability becomes more sensitive to premium differences when
$\alpha_{\lambda}$
is higher.


Combining the above yields the following result:
 \begin{align*}\frac{\partial \pi_{i,\lambda}}{\partial p_i}=\frac{1}{n_{\lambda}}\big(\mathscr{T}_1^{\ \lambda}+\mathscr{T}_2^{\ \lambda}+\mathscr{T}_3^{\ \lambda}\big),\end{align*}
which enters directly into the first-order pricing condition (14). It is straightforward to verify that
 $\mathscr{T}_1^{\ \lambda}$
,
 $\mathscr{T}_2^{\ \lambda}$
, and
 $\mathscr{T}_3^{\ \lambda}$
are all negative, which is consistent with the behavior that the willingness to purchase insurance decreases as premiums increase.
Proposition 2. The partial derivative of
 $O_i$
with respect to
 $p_i$
is
 \begin{align}\frac{\partial O_i}{\partial p_i}=\sum_{\lambda\in\{H,L\}}\frac{1}{A_{i,\lambda}(\mathbf{p})}\big\{\big(\mathscr{T}_1^{\ \lambda} + \mathscr{T}_2^{\ \lambda} + \mathscr{T}_3^{\ \lambda}\big)\, B_{i,\lambda}(\,p_i)-n_{\lambda}\,\pi_{i,\lambda}(\mathbf{p})\,\beta_i e^{-\beta_i p_i} M_X^{(\lambda)}(\beta_i)\big\}.\end{align}
4.2. Premium lower and upper bounds
Given the utility function in (7), we introduce a lower bound on the premium to ensure that it is sufficiently high to cover potential claim losses. We choose a lower bound
 $\underline p_i$
satisfying the following constraint:
 \begin{equation}\mathbb{E}\big[ u_i \big( w_i^0 + (N_{i,H}+N_{i,L}) \underline p_i - S_i(N_{i,H},N_{i,L}) \big) \big] \ge u_i \left( w_i^0 \right)\!,\end{equation}
which implies that undertaking the policyholder’s risk will not decrease the expected utility, aligning with the risk aversion of the insurer.
Mourdoukoutas et al. (Reference Mourdoukoutas, Boonen, Koo and Pantelous2021) select the premium lower bound by making the individual rationality constraint binding. For our game, however, it is not known ex ante how many high- and low-risk types will accept the insurance contract. Therefore, we adopt a lower bound on premiums that is sufficient to guarantee individual rationality for any risk composition.
Lemma 2. The individual rationality constraint in (16) is satisfied when
 \begin{align*}p_i \ge \frac{\ln\left(M_X^{(H)}(\beta_i)\right)}{\beta_i}\,:\!=\,\underline p_i,\end{align*}
for any i, where
 $M_X^{(H)}(\beta_i)$
is the moment generating function (MGF) of the high-risk claim distribution evaluated at
 $\beta_i$
.
This bound is sufficient to guarantee individual rationality for any mixture of H and L types; it may be strictly above the certainty-equivalent premium.
We now show that there exists a mathematically and economically meaningful upper bound on the best-response premium of insurer i.
Lemma 3. For every insurer i, there exists a finite constant
 $p_i^U \lt \infty$
such that, for every
 $p_{-i}\in \prod_{k\neq i}[\underline p_k,\infty),$
every minimizer of
 $O_i(\cdot,p_{-i})$
over
 $[\underline p_i,\infty)$
belongs to
 $[\underline p_i,p_i^U]$
.
Lemma 3 shows that
 $p_i^U$
can be chosen uniformly over all
 $p_{-i}$
since the exponential decay rates are uniform, which has a natural economic interpretation. Although raising premiums could improve the underwriting profit margin of each contract, excessive premiums will eventually lead to a significant decline in demand under the Markovian mechanism. Following the result above, we may, without loss of generality, restrict the strategy set of insurer i to the compact interval:
 \begin{align*}P_i \,:\!=\, [\underline p_i,p^U_i].\end{align*}
The setting of upper bound can prevent insurers from choosing arbitrarily high premiums and ensure that optimal pricing remains economically meaningful.
4.3. Equilibrium analysis
The competitive insurance market is modeled as a non-cooperative game with m insurers. Each insurer
 $i \in \{1,2, \dots, m\}$
selects a premium
 $p_i \in P_i =[\underline p_i,p^U_i]$
. The strategy profile is
 $p = (\,p_1, p_2, \ldots, p_m) \in P = \prod_i P_i$
, and
 $p_{-i}$
denotes the premiums of the competitors of insurer i.
Definition 1. A profile
 $p^* = (\,p_1^*, p_2^*, \dots, p_m^*) \in P$
is a pure-strategy Nash equilibrium if, for all
 $i \in \{1,2,\ldots,m\}$
,
 \begin{align*}p_i^* \in \arg\min_{p_i \in P_i} O_i(\,p_i, p_{-i}^*),\end{align*}
or equivalently,
 $p_i^* \in \arg\max_{p_i \in P_i} \mathbb{E}[u_i(W_i^1(\,p_i, p_{-i}^*))]$
.
Given the complexity of the demand model, it is difficult to obtain a closed-form characterization of equilibrium premiums. Instead, we derive sufficient conditions that guarantee the existence of at least one Nash equilibrium.
We next study the quasi-convexity of the function
 $O_i$
. Quasi-convexity is a more general property than convexity, which will be used to show the existence of a pure-strategy equilibrium. Based on the characterization in Greenberg and Pierskalla (Reference Greenberg and Pierskalla1971), the mapping
 $p_i \mapsto O_i(\,p_i, p_{-i})$
is said to be quasi-convex in
 $p_i$
if for any
 $p_i^x, p_i^y$
in the admissible set,
 \begin{align*}O_i\left(\,p_i^y, p_{-i}\right) \le O_i\left(\,p_i^x, p_{-i}\right)\quad \Longrightarrow\quad \frac{\partial O_i\left(\,p_i^x, p_{-i}\right)}{\partial p_i}\,\left(\,p_i^y - p_i^x\right) \le 0.\end{align*}
Lemma 4. Fix insurer i and the competitors’ premiums
 $p_{-i}$
. For each
 $\lambda\in\{L,H\}$
, define
 \begin{align*}O_{i,\lambda}(\mathbf{p})\,:\!=\, n_{\lambda} \ln A_{i,\lambda}(\mathbf{p}),\text{and }O_i(\mathbf{p})\,:\!=\, O_{i,L}(\mathbf{p}) + O_{i,H}(\mathbf{p}).\end{align*}
Assume that on the interior premium interval
 $(\underline p_i,p_i^U]$
, the following conditions hold:
-
1. For each
$\lambda\in\{L,H\}$
and all
$p_i\in (\underline p_i,p_i^U]$
, (17)where
\begin{equation} \frac{\partial \ln\bigl(-\Sigma\mathscr{T}^{\ \lambda}\bigr)} {\partial \ln\bigl(-B_{i,\lambda}(\,p_i)\bigr)} \;\ge \; -2,\end{equation}
$\Sigma\mathscr{T}^{\ \lambda}=\mathscr{T}_1^{\ \lambda} + \mathscr{T}_2^{\ \lambda} + \mathscr{T}_3^{\ \lambda}$
.
-
2. There exists a point
$p_i^{\ast}\in(\underline p_i,p^U_i)$
such that
\begin{align*} \frac{\partial O_{i,L}}{\partial p_i}\left(\,p_i^{\ast},p_{-i}\right) = \frac{\partial O_{i,H}}{\partial p_i}\left(\,p_i^{\ast},p_{-i}\right) = 0. \end{align*}


Then
 $p_i\mapsto O_i(\,p_i,p_{-i})$
is strictly quasi-convex on
 $P_i$
.
The elasticity in (17) compares the price sensitivity of the aggregate transition term
 $\Sigma\mathscr{T}^{\ \lambda}$
to that of the marginal profit term
 $B_{i,\lambda}$
. The denominator reflects the logarithmic variation of the zero-utility underwriting threshold, while the numerator measures the customer attrition generated by a marginal premium increase. Economically, this condition reflects a stable marginal trade-off between premium-driven profit margin expansion and the resulting attrition of market share. It requires that the pressure of competitive demand does not intensify disproportionately fast relative to the improvement of underwriting performance as premiums increase, which leads to an economically meaningful optimum. Lemma 4 thus provides a sufficient condition for quasi-convexity of the cost function
 $O_i$
over the feasible region.
Remark 2 (Special case: locally linear demand). Recall that
 $\Sigma\mathscr{T}^{\ \lambda} = \mathscr{T}_1^{\ \lambda}+\mathscr{T}_2^{\ \lambda}+\mathscr{T}_3^{\ \lambda} \lt 0$
collects the total price effect on insurer i’s demand, and
 $B_{i,\lambda}(\,p_i) = e^{-\beta_i p_i} M_X^{(\lambda)}(\beta_i) - 1 \lt 0$
is the type–
 $\lambda$
margin term. A particularly simple case in which (17) is automatically satisfied is when demand is (locally) linear in
 $p_i$
.
Fix the competitors’ premiums
 $p_{-i}$
and consider insurer i’s market share for type
 $\lambda$
,
 $\pi_{i,\lambda}(\,p_i,p_{-i})$
, as a function of its own premium
 $p_i$
. Suppose that on some interval
 $I\subseteq P_i$
, we have the affine specification
 \begin{align*}\pi_{i,\lambda}(\,p_i,p_{-i})\;=\;\bar\pi_{i,\lambda} - d_{i,\lambda}\,p_i,\qquad d_{i,\lambda} \gt 0,\end{align*}
so that
 $\partial\pi_{i,\lambda}/\partial p_i = -d_{i,\lambda}$
is constant in
 $p_i$
on I. In this case, the derivative of
 $\pi_{i,\lambda}$
does not depend on the premium level, and hence
 \begin{align*}\Sigma\mathscr{T}^{\ \lambda}=\mathscr{T}_1^{\ \lambda} + \mathscr{T}_2^{\ \lambda} + \mathscr{T}_3^{\ \lambda}\end{align*}
is constant in
 $p_i$
as well as in I. Economically, this corresponds to the standard local linear demand approximation: around a given price level, the marginal loss of market share per unit increase in the premium is approximately constant. It follows that
 \begin{align*}\frac{\partial}{\partial p_i}\ln(\!-\Sigma\mathscr{T}^{\ \lambda}) = 0,\end{align*}
and therefore
 \begin{align*}\frac{\partial \ln\!(\!-\Sigma\mathscr{T}^{\ \lambda})}{\partial \ln\!(\!-B_{i,\lambda}(\,p_i))}=\frac{\dfrac{\partial}{\partial p_i}\ln\!(\!-\Sigma\mathscr{T}^{\ \lambda})} {\dfrac{\partial}{\partial p_i}\ln\!(\!-B_{i,\lambda}(\,p_i))}= 0 \;\ge \; -2.\end{align*}
Hence, the inequality (17) holds automatically on any interval where demand is (locally) linear in
 $p_i$
.
Remark 3 (Special case: without risk heterogeneity). Another special case is when
 $X^{(H)}\stackrel{d}{=}X^{(L)}$
, that is, there is no risk heterogeneity. Under such a scenario, if the inequality (17) holds, the cost function
 $O_i(\,p_i,p_{-i})$
is quasi-convex in
 $p_i$
.
This homogeneous special case is related to Dutang et al. (Reference Dutang, Albrecher and Loisel2013), but it does not coincide exactly with their model. First, our demand system retains the full nonlinear Markov transition probabilities, whereas Dutang et al. (Reference Dutang, Albrecher and Loisel2013) use a simplified linear-in-premium demand specification to obtain a closed-form equilibrium. Second, our model includes a non-insured state and therefore allows lapse and re-entry transitions, which are absent from their baseline formulation. Consequently, even in the homogeneous risk case, the equilibrium premiums need not coincide with the explicit equilibrium characterized in Dutang et al. (Reference Dutang, Albrecher and Loisel2013).
We are now ready to show the existence of a pure-strategy Nash equilibrium.
Theorem 1. Suppose that, for every insurer
 $i\in\mathscr{I}$
and every competitor premium vector
 $p_{-i}\in P_{-i}\,:\!=\,\prod_{k\neq i}P_k$
, the two conditions in Lemma 4 hold. Then the game admits at least one pure-strategy Nash equilibrium.
Theorem 1 shows that a competitive insurance market with heterogeneous risks admits at least one stable premium configuration when insurers face a sufficiently regular trade-off between underwriting performance and customer retention. Under the conditions of Lemma 4, the insurers’ best-response correspondences are sufficiently well behaved for standard fixed-point arguments to apply, ensuring the existence of at least one pure-strategy Nash equilibrium. From an economic perspective, this result implies that policyholder switching in the presence of risk heterogeneity does not necessarily destabilize the market. On the contrary, a stable premium structure can emerge when the demand response to the underwriting incentive evolves in a sufficiently controlled manner.
5. Numerical application
In this section, we assume that the two risk types H and L have zero-inflated exponential loss distributions. To capture the empirical prevalence of contracts with no claims, we extend the distribution of a policyholder’s claim amount from a simple exponential to a zero-inflated exponential form.
To illustrate the theoretical findings and demonstrate the practical applicability of our model, we conduct a numerical simulation to investigate the effect of risk heterogeneity. The simulation implements the demand structure with heterogeneous risk types and solves for the Nash equilibrium premiums using best-response dynamics. We consider a market with
 $m=5$
insurers, incorporating risk heterogeneity through high-risk (Type H) and low-risk (Type L) individuals.
5.1. Zero-inflated exponential loss distribution
Let
 $X^{(\lambda)}$
denote a zero-inflated exponential random variable with parameters
 $\rho_{\lambda} \in [0,1]$
and
 $\mu_{\lambda} \gt 0$
. The distribution is a mixture of a discrete mass at zero and a continuous exponential density at
 $(0, \infty)$
, that is,
 \begin{align*}\mathbb{P}(X^{(\lambda)} = 0) = \rho_{\lambda},\qquad X^{(\lambda)} \,\big|\, \{X^{(\lambda)} \gt 0\} \;\sim\; \mathrm{Exponential}(1/\mu_{\lambda}).\end{align*}
The corresponding cumulative distribution function is therefore given by:
 \begin{align*}\mathbb{P}(X^{(\lambda)}\le x)=\begin{cases}1 - (1-\rho_{\lambda})\exp(\!-x/\mu_{\lambda}), & x \ge 0,\\[3pt]0, & x \lt 0.\end{cases}\end{align*}
Assumption 2 is satisfied when
 $\rho_H\le \rho_L$
and
 $\mu_H\ge \mu_L$
. The unconditional expected loss is
 $\mathbb{E}[X^{(\lambda)}] = (1 - \rho_{\lambda}) \mu_{\lambda}$
.
Proposition 3. The MGF of
 $X^{(\lambda)}$
is given by
 \begin{align*}M_X^{(\lambda)}(s) = \rho_{\lambda} + \frac{1-\rho_{\lambda}}{1 - \mu_{\lambda} s}\quad \text{for } s \lt \frac{1}{\mu_{\lambda}}.\end{align*}
In what follows, we assume that individual claim amounts follow a zero-inflated exponential distribution.
5.2. Simulation framework
The numerical simulation, implemented in Python, follows a structured approach to model the competitive insurance market with risk heterogeneity. The code integrates the loss model (Sections 2.3 and 5.1) and demand structure (Section 3) to compute Nash equilibrium premiums via best-response dynamics. The algorithm is as follows:
Nash equilibrium simulation

Algorithm 1 Long description
The algorithm begins with definitions of parameters and initial conditions. It iterates through a series of steps to compute premiums and exposures. The steps include calculating moment generating functions for high-risk and low-risk types, determining initial premiums, and performing a grid search with refinement. The algorithm updates premiums and computes demand based on Markov transitions. It checks for convergence and validates the Nash equilibrium. Each iteration involves synchronous global best response and verification of best response consistency.
Step 7 uses the bound-constrained quasi-Newton method L-BFGS-B to refine the initial guess obtained from the grid search. As a robustness check, step 15 verifies the equilibrium by three complementary criteria: (i) best-response consistency: For each insurer i, we recompute its best-response premium
 $p_i^{\mathrm{BR}}$
to the candidate equilibrium
 $\mathbf{p}^*$
and verify that
 $\max_i |p_i^{\mathrm{BR}} - p_i^*| \lt \varepsilon$
. In the implementation, we set
 $\varepsilon = 10^{-3}$
as the primary tolerance to pass the verification; (ii) grid deviation test: Considering the limitation of discrete grid initialization, we evaluate the objective function on a broader grid. The equilibrium passes this test if the maximum profitable grid deviation is smaller than
 $10^{-3}$
; and (iii) local perturbation analysis: It tests the stability of the equilibrium. After introducing small perturbations
 $\delta$
to
 $p_i^*$
, we check if the objective function
 $O_i$
increases.
5.3. Baseline simulation
5.3.1. Parameter setup
In the baseline specification, we consider a stylized insurance market consisting of five competing insurers. Each insurer i is characterized by a sensitivity parameter
 $\gamma_i$
to reflect its market power. Following Lerner (Reference Lerner1934), Wu and Pantelous (Reference Wu and Pantelous2017), and Boonen et al. (Reference Boonen, Pantelous and Wu2018), we assume that greater market power corresponds to a lower value of
 $\gamma_i$
. In our scenario, insurers 2 and 5 are considered to have the largest market power, while insurer 4 holds the weakest market position. For all insurers, we assume that they share a common constant risk aversion coefficient
 $\beta=0.03$
.
Regarding the market decomposition, the pie charts in Figure 2 provide an illustrative example. The total exposure is fixed at 10,000 with a balanced market composition
 $\eta=0.5$
. The high-risk pool is assumed to have a lower proportion of non-insured individuals initially to capture its stronger willingness to purchase the insurance contract. In addition, low-risk types, who are more price-elastic, are assigned larger sensitivity parameters. Finally, the parameters of the claim distributions are specified in accordance with Assumptions 1 and 2, capturing heterogeneity between these two risk types. All parameters used in the baseline model are summarized in Table 2.
Initial market distribution by risk type.

Baseline model parameters.

Table 2. Long description
The baseline model has five insurers, a total exposure of 10,000, and an equal proportion of high- and low-risk policyholders. In the order of the non-insured state followed by Insurers 1 to 5, the initial high-risk distribution is 15%, 15%, 20%, 15%, 15%, and 20%, while the low-risk distribution is 20%, 15%, 20%, 15%, 10%, and 20%. The status-quo bias parameter is 1.8. For high- and low-risk policyholders, respectively, switching sensitivities are 0.18 and 0.20, lapse sensitivities are 0.10 and 0.22, entry sensitivities are 0.2 and 0.7, and selection sensitivities are 0.004 and 0.006. Insurer-specific sensitivities for Insurers 1 to 5 are 1.20, 1.10, 1.20, 1.40, and 1.10. All insurers have a risk-aversion coefficient of 0.03. The high- and low-risk claim distributions have exponential scale parameters of 25 and 20 and zero-inflation probabilities of 0.10 and 0.15, respectively. Initial premiums for Insurers 1 to 5 are 130, 133, 129, 128, and 132.
5.3.2. Results
Under the baseline parameter specification, our numerical checks indicate that the best-response objective
 $p_i\mapsto O_i(\,p_i,p_{-i})$
is quasi-convex for the relevant competitor premium profiles encountered by the algorithm. The computed best-response dynamics converge to a fixed point, which provides numerical evidence for the existence of a Nash equilibrium in this example. In the baseline and subsequent case studies, we also initialize the best-response dynamics from multiple starting values and combine this with a grid search. In each case, the algorithm converges to the same fixed point, providing numerical evidence that the equilibrium is unique in these examples. The convergence of premiums is illustrated in Figure 3.
Convergence of premiums to Nash equilibrium, where the premiums are determined via iterative best responses to the competitors.

Finally, the total expected exposure for insurer i is the sum across both risk types
 $\lambda$
:
 \begin{align*}q_{i}^*=q_{i,H} + q_{i,L}.\end{align*}
Such a deterministic quantity represents the movement of each risk type across
 $m+1$
states, showing the expected exposure volume of insurer i. The equilibrium premium and demand changes are listed in Table 3. Notably, insurer 3 increases its price by
 $0.6\%$
but gains a market share of
 $2.5\%$
. This shows that, due to competition, policyholder transition probabilities depend not only on absolute price levels but also on relative premium attractiveness across competing insurers and on market-wide premium changes. Moreover, the market responses also depend on the value of
 $\gamma_i$
. As shown in Table 3, although insurers 2 and 5 have the highest Nash equilibrium premiums, they have the largest exposure in the market. This is driven by their high market power, which makes them more attractive than their competitors.
Nash equilibrium results for the baseline parameter set.

Table 3. Long description
The table compares initial premiums and exposures with Nash-equilibrium premiums and expected demand for five insurers. Insurer 1 lowers its premium from 130.00 to 129.73, a decrease of 0.27 or 0.2%, while demand rises from 1,500 to 1,537.93, an increase of 2.5%. Insurer 2 raises its premium from 133.00 to 133.52, an increase of 0.52 or 0.4%, while demand falls from 2,000 to 1,740.61, a decrease of 13.0%. Insurer 3 raises its premium from 129.00 to 129.73, an increase of 0.73 or 0.6%, while demand rises from 1,500 to 1,537.93, an increase of 2.5%. Insurer 4 lowers its premium from 128.00 to 127.05, a decrease of 0.95 or 0.7%, and experiences the largest demand gain, from 1,250 to 1,413.05, or 13.0%. Insurer 5 raises its premium from 132.00 to 133.52, an increase of 1.52 or 1.2%, while demand falls from 2,000 to 1,740.61, a decrease of 13.0%. Overall, Insurers 1 and 4 reduce their premiums and gain demand, whereas Insurers 2 and 5 increase their premiums and lose demand.
To intuitively study the probability structure of lapse and switching behaviors, we display the transition probability matrix for both risk types separately. The two transition probability matrices in Tables 4 and 5 reveal several consistent behavioral patterns within the competitive insurance market. First, both the high-risk (Table 4) and low-risk (Table 5) matrices display a clear diagonal-dominant structure. It indicates that policyholders tend to remain in their current state regardless of their risk type, aligning with the behavioral pattern in reality that an individual switches from insurer j to insurer i only when insurer i offers a sufficiently attractive current premium relative to insurer j. Additionally, when we compare the two risk types, it is notable that high-risk and low-risk types react differently to the same premiums. For instance, the probability in the first column of the low-risk transition matrix is higher than that of the high-risk counterpart, showing that low-risk types have a higher probability of remaining in or transitioning to the non-insured state.
High-risk transition probability matrix.

Table 4. Long description
The matrix reports one-period transition probabilities for high-risk individuals among the non-insured state and five insurers. A non-insured individual has an 18.2% probability of remaining non-insured and a probability of between 15.0% and 17.0% of joining each insurer, with Insurer 4 receiving the lowest entry probability. Currently insured policyholders have a probability of between 47.1% and 49.5% of remaining with their existing insurer, approximately 9.9% to 10.1% of switching to each competing insurer, and between 10.4% and 13.1% of becoming non-insured. Insurer 4 has the lowest retention probability, 47.1%, and the highest lapse probability, 13.1%. Insurers 2 and 5 have the highest retention probability, 49.5%, and the lowest lapse probability, 10.4%. Insurers 1 and 3 have identical transition patterns, including retention of 48.7% and lapse of 11.3%. Each row sums to one.
Low-risk transition probability matrix.

Table 5. Long description
The matrix reports one-period transition probabilities for low-risk individuals among the non-insured state and five insurers. A non-insured individual has a 50.4% probability of remaining non-insured and a probability of between 8.7% and 10.5% of joining each insurer, with Insurer 4 receiving the lowest entry probability. Currently insured policyholders have a probability of between 39.3% and 42.9% of remaining with their existing insurer, approximately 8.5% to 8.9% of switching to each competing insurer, and between 21.5% and 26.6% of becoming non-insured. Insurer 4 has the lowest retention probability, 39.3%, and the highest lapse probability, 26.6%. Insurers 2 and 5 have the highest retention probability, 42.9%, and the lowest lapse probability, 21.5%. Insurers 1 and 3 have identical transition patterns, including retention of 41.7% and lapse of 23.3%. Each row sums to one.
The changes in expected state proportions are illustrated by the pie charts in Figure 4. The Nash equilibrium leads to a loss of low-risk policyholders and a relative retention of high-risk policyholders. This increases the average risk level of the insured market after one period, which is consistent with the classical insight of Stiglitz and Rothschild (Reference Rothschild and Stiglitz1976) that asymmetric risk information can worsen the composition of the insured pool and reduce market efficiency. In particular, insurer 4 finds a relatively attractive premium level. It is neither so low as to cause excessive attraction of high-risk policyholders nor so high as to price out low-risk policyholders. Its risk pool structure maintains a relative balance while expanding its market share, showing an effective competitive result. In contrast, although insurers 2 and 5 already charge relatively high premiums, they choose to further increase their premiums by
 $0.4\%$
and
 $ 1.2\%$
, respectively. As a result, a large number of low-risk types switch to other insurers or simply lapse since they are more price-sensitive. The aggregate insured pool becomes more concentrated in high-risk types, suggesting a deterioration in the overall risk composition of the market.
Expected state composition changes.

The results shown in Table 6 demonstrate the effect of risk heterogeneity as well. The aggregate number of insureds decreases slightly from 8250 to 7970, while the internal risk exposure deteriorates as well. The proportion of high-risk policyholders in the insured market increased from 51.5% to 55.0%, quantifying the heterogeneity-driven selection effectin a one-period game. This result is driven by heterogeneity between the two risk types. The policy offered by each insurer is fixed at a single premium level since the insurer cannot capture the heterogeneity perfectly. Thus, the policy contract will be more attractive to those at a higher risk.
Risk-specific demand summary statistics.

Table 6. Long description
The table compares initial and final insurance demand by risk type. The number of insured high-risk policyholders increases from 4,250 to 4,387, a rise of 3.2%, while the number of insured low-risk policyholders decreases from 4,000 to 3,583, a decline of 10.4%. Consequently, the total insured population falls from 8,250 to 7,970, a decrease of 3.4%. Despite the reduction in total demand, the proportion of high-risk policyholders in the insured portfolio rises from 51.5% to 55.0%, an increase of 3.5 percentage points.
5.4. Competition intensity and equilibrium premiums
To further reveal the strategic response characteristics of insurers in a non-cooperative game, this section analyzes the relationship between competition intensity and equilibrium premiums. We implement a sequential market-reduction simulation based on the previous baseline model with five insurers (
 $m=5$
). Starting from the most competitive market structure in our framework, we remove insurers from the market one by one. Insurer 5 is removed first, followed by Insurers 4, 3, and 2 in sequence. The initial exposure proportion previously held by the exiting insurer is evenly reallocated among the remaining insurers, keeping the size of the non-insured pool constant. Table 7 shows that the Nash equilibrium premiums are negatively correlated with the number of competitors in the market. For instance, insurer 1 chooses the lowest Nash equilibrium premium
 $129.73$
when the market is highly competitive with
 $m=5$
. As other insurers withdraw from the market, insurer 1’s Nash premium increases monotonically, reaching a maximum of
 $141.76$
when the market becomes a monopoly with
 $m=1$
. The underlying reason is that individuals have more alternative options when there are more insurers in the market. Any insurer’s increase in premiums will trigger an outflow of policyholders. Consequently, insurers are compelled to lower their premiums to defend their market share.
Nash equilibrium premiums by insurer for different numbers of competitors.

Table 7. Long description
The table reports Nash-equilibrium premiums as the number of active insurers decreases from five to one. With five insurers, premiums are 129.73, 133.52, 129.73, 127.05, and 133.52 for Insurers 1 to 5, respectively, with an average of 130.71. With four insurers, the premiums for Insurers 1 to 4 are 131.17, 134.77, 131.17, and 128.44, with an average of 131.38. With three insurers, premiums are 133.91, 137.27, and 133.91, averaging 135.03. With two insurers, premiums are 136.75 and 139.70, averaging 138.23. Under monopoly, Insurer 1 charges 141.76. Overall, the average Nash-equilibrium premium rises from 130.71 to 141.76 as the number of insurers falls from five to one, indicating that reduced competition leads to higher premiums. “NA” indicates that an insurer is not active in the corresponding market structure.
5.5. Sensitivity analysis
5.5.1. Sensitivity analysis in
$\eta$

To study the impact of the risk composition in the insurance market, we conduct a sensitivity analysis by adjusting the value of
 $\eta \in \{0.00,0.25,0.50,0.75,1.00\}$
. The change in
 $\eta$
directly affects the expected cost of the insurers, which in turn drives the changes in Nash equilibrium premiums and the market structure. For the boundary cases
 $\eta=0$
and
 $\eta=1$
, one of the two risk pools is absent. In the numerical implementation, the corresponding type-specific terms are omitted from the objective function rather than evaluated with
 $n_{\lambda}=0$
and
 $\pi_{i,\lambda}=q_{i,\lambda}/n_{\lambda}$
. Thus, the cases
 $\eta=0$
and
 $\eta=1$
are interpreted as limiting one-type markets.
Table 8 shows the Nash equilibrium premiums for various values of
 $\eta$
. It is clear that the Nash equilibrium premiums are affected by
 $\eta$
. For the same insurer, the larger
 $\eta$
, the higher the final Nash equilibrium premium. A larger
 $\eta$
means a higher proportion of high-risk types, who have a larger expected claim size, which leads to higher premiums in our competitive market.
Nash equilibrium premiums by
 $\eta$
(high-risk proportion).

Table 8. Long description
The table reports Nash-equilibrium premiums for five insurers as the high-risk proportion, η, increases from 0 to 1. For Insurers 1 and 3, premiums rise identically from 112.27 at η=0 to 121.67, 129.73, 136.69, and 142.76 as η increases in increments of 0.25. For Insurers 2 and 5, premiums rise identically from 116.06 to 125.44, 133.52, 140.53, and 146.67. Insurer 4 charges the lowest premium at every risk composition, increasing from 107.15 to 118.24, 127.05, 134.18, and 140.06. Thus, all insurers charge progressively higher equilibrium premiums as the proportion of high-risk policyholders increases. Insurers 2 and 5 consistently charge the highest premiums, Insurers 1 and 3 charge equal intermediate premiums, and Insurer 4 consistently charges the lowest premiums.
Additionally, the trend of average premiums in the market is shown in Figure 5. The pattern is consistent with the findings for each insurer. It implies that with a larger proportion of high-risk types in the market, insurers need to raise their premiums to cover the increasing expected claim amount. In particular, the relationship is concave in Figure 5, implying that equilibrium premiums are not simply a linear weighting of claim risks with heterogeneous risks. Since high-risk policyholders are more prone to staying insured, the risk pool is gradually dominated by these individuals. Consequently, the Nash equilibrium will be higher than the linear weighted level.
Average premium over
 $\eta$
(with
 $\beta=0.03$
).

In addition to Nash equilibrium premiums, the results of the sensitivity analysis for market structure are summarized in Table 9. This table shows that the number of insureds increases only when
 $\eta$
is large. This is partially due to the higher price sensitivities of low-risk types, which makes them more likely to lapse or remain uninsured when premiums rise. The change in the high-risk proportion in the insured market (
 $\Delta H\%$
) shows that the intensity of the effect of risk heterogeneity does not increase linearly with
 $\eta$
. Instead, such a relationship shows an inverted U-type trend, reaching a peak (+3.5%) when
 $\eta=0.5$
. At
 $\eta \approx 0.5$
, risk-type dispersion is highest. The mismatch between the fair price for low-risk types and the actual price in the market prompts them to lapse. At the same time, the price is still attractive to high-risk types. This difference between low-risk insurance withdrawal and high-risk retention leads to the most significant effect of risk heterogeneity. However, when
 $\eta$
is close to an extreme value, the effect of risk heterogeneity trivially disappears.
Sensitivity of market outcomes to high-risk proportion. Here, “Total” refers to the number of insureds and H refers to the number of high-risk types that are insured.

Table 9. Long description
The table compares initial and final insurance demand for five high-risk proportions. When η=0, total insureds fall from 8,000 to 7,490, a decrease of 6.4%. At η=0.25, total insureds fall from 8,125 to 7,696, or 5.3%, while the high-risk share rises from 26.2% to 28.7%. At η=0.5, total insureds fall from 8,250 to 7,970, or 3.4%, while the high-risk share rises from 51.5% to 55.0%. At η=0.75, total insureds fall from 8,375 to 8,295, or 0.9%, while the high-risk share rises from 76.1% to 78.8%. When η=1, total insureds increase from 8,500 to 8,660, or 1.9%. Overall, the decline in total demand weakens and eventually reverses as the high-risk proportion increases, while mixed-risk insured portfolios become more concentrated in high-risk policyholders.
5.5.2. Sensitivity analysis in
$\beta$

With respect to the insurers’ risk aversion parameter
 $\beta_i$
, we examine how the risk preferences of insurers affect equilibrium premiums. Specifically, we set
 $\beta_i=\beta$
and conduct a sensitivity analysis for values of
 $\beta$
between
 $0.022$
and
 $0.038$
. Figure 6 displays a non-monotonic relationship between the average Nash premium and the risk aversion parameter
 $\beta$
. When
 $\beta$
is very low (
 $0.022$
–
 $0.032$
), the average Nash equilibrium premium drops sharply with the increase of risk aversion. Around
 $\beta=0.032$
, the premium reaches the lowest point, marking the transformation of the market pricing strategy. The curve begins to rebound when
 $\beta\gt0.032$
, with premiums rising as insurers become more risk-averse.
Average premium for various values of
 $\beta$
.

At low
 $\beta$
levels, insurers give priority to diversifying the risk pool by reducing premiums. When insurers are highly risk-averse, pricing becomes more conservative to obtain a higher profit margin per contract. This finding highlights that the optimal premium strategy is not a simple linear function of the average claim cost but rather reflects a trade-off between the risk-pooling effect and the risk-premium effect.
5.6. Repeated one-period myopic game
In this subsection, we extend the baseline one-period game to a finite-horizon repeated one-period myopic game (in short, repeated game), evaluated for T periods. Over multiple periods, the insurers optimize their one-period-ahead expected utility (and are hence interpreted as “myopic”). We index all relevant quantities by t and use the following state variables:
 \begin{align*}\bigl(\mathbf{N}^t,\,\mathbf{W}^t,\,\mathbf{p}_t\bigr) = \bigl((N_{j,\lambda}^t)_{j,\lambda},\,(W_{j}^t)_j,\,(\,p_{j,t})_j\bigr).\end{align*}
Definition 2. Repeated game.
Let
 $\mathscr{I} = \{1, 2, \ldots, m\}$
denote the set of insurers, and let
 $\Lambda = \{H, L\}$
denote the set of risk types. At time
 $t = 0$
, we initialize for each insurer
 $j\in \mathscr{I}$
and type
 $\lambda\in\Lambda$
 \begin{align*}\mathbf{n}_{\lambda}^0 = (n_{0,\lambda},n_{1,\lambda},\ldots,n_{m,\lambda}) \in \mathbb{N}^{m+1},\qquad \sum_{j=0}^m n_{j,\lambda} = n_{\lambda},\end{align*}
which represents the initial exposures (policyholder counts) of each insurer. Also, we initialize the wealth level
 $w_{i}^0 \gt 0$
of each insurer.
For periods
 $t = 1, 2, \ldots, T$
, repeat
-
1. Premium equilibrium determination: Insurers in
$\mathscr{I}$
minimize their cost functions subject to the premium constraints: Here,
\begin{align*} \min_{p_{i,t} \in \left[\underline p_{i}, p^U_i\right]} O_i^t(\,p_{i,t}, p_{-i,t}). \quad \end{align*}
$O_i^t$
is the one-period cost function evaluated using the current state
$\mathbf N^{t-1}$
and the transition probabilities
$P_{\lambda}(\mathbf p_t,\mathbf p_{t-1}^*)$
.
-
2. Transitions: Given
$\mathbf{p}_t^*$
, individuals of type
$\lambda$
update their transition probability according to a time-inhomogeneous Markov chain with transition matrix
$P_{\lambda}(\mathbf{p}_t^*,\mathbf{p}_{t-1}^*)$
. The expected exposure volume conditional on all information available at period
$t-1$
is and the realized portfolio sizes follow
\begin{align*} q_{i,\lambda}^{t} = \mathbb{E}\left[N_{i,\lambda}^{t} \left| N_{\cdot,\lambda}^{t-1},\mathbf{p}_{t}^*,\mathbf{p}_{t-1}^*\right.\right]= \sum_{j=0}^{m} N_{j,\lambda}^{t-1} P_{j,i,\lambda}(\mathbf{p}_t^*,\mathbf{p}_{t-1}^*), \end{align*}
where
\begin{align*} \mathbf{N}^t_{\lambda} = \left(N_{0,\lambda}^{t},N_{1,\lambda}^{t}, \ldots, N_{m,\lambda}^{t}\right) \;\sim\; \mathrm{Multinomial}\!\left(n_{\lambda},\,\boldsymbol{\pi}^t_{\lambda}(\mathbf{p}_t^*)\right)\!, \end{align*}
$\pi_{i,\lambda}^t(\mathbf{p}_t^*)=q_{i,\lambda}^t/n_{\lambda}$
is the market share vector induced by the equilibrium premiums.
-
3. Claim simulation: Aggregate claim amounts are randomly drawn based on the portfolio composition and size
$N_{i,\lambda}^t$
. -
4. Underwriting result calculation: The underwriting result for insurer i is computed as:
\begin{align*} UW_{i}^t = \big(N_{i,H}^t+N_{i,L}^t\big)p_{i,t}^* - S_i\!\left(N_{i,H}^t,N_{i,L}^t\right){\!}. \end{align*}
-
5. Wealth update: The wealth of each insurer is updated via:
where
\begin{align*} W_{i}^{t} = W_{i}^{t-1} + UW_i^t=W_{i}^{t-1} + \big(N_{i,H}^t+N_{i,L}^t\big)p_{i,t}^* - S_i\!\left(N_{i,H}^t,N_{i,L}^t\right){\!}, \end{align*}
$W^0_i=w^0_i$
.


Definition 3. Leadership probability.
Following Dutang et al. (Reference Dutang, Albrecher and Loisel2013), we define the leadership probability for insurer i at period t to measure market dominance over time:
 \begin{align*}\phi_{i,t}(\mathbf w^0,\mathbf n^0)=\mathbb{P}\!\left(\big(N_{i,H}^t+N_{i,L}^t\big)p_{i,t}^*\;\ge \;\big(N_{k,H}^t+N_{k,L}^t\big)p_{k,t}^*\quad \forall k\neq i\;\middle|\;w_{i}^0,\mathbf{n}_{\lambda}^{0}\right){\!}.\end{align*}
This represents the probability that insurer i has the highest premium revenue at period t, conditional on initial conditions.
From the repeated-game extension, we aim to track effects of risk heterogeneity in long-term market dynamics, especially with respect to the following aspects. First, we will investigate the evolution of premium strategies. For example, we will look at whether there is any cycle or volatility due to competition. In addition to premium evolution, we will study the evolution of the risk pool portfolio to detect spirals of the effect of risk heterogeneity. Finally, based on the definition of leadership probability, we aim to track which insurers dominate the market over time. In this section, we conduct a multi-period repeated-game simulation to illustrate insurers’ behavior in the long run. Based on the previous baseline model in a one-period game, we perform a Monte Carlo experiment using a set of 50 independent runs. Each run represents a single, randomly sampled path of the market over the desired time horizon from 0 to 5. The behavior of each risk type and each insurer is based only on the information from the previous period. The simulation tracks the joint evolution of premiums, exposures, and insured state compositions over five periods.
Premium and exposure paths for insurers 1–5 over time. We show the means and 95% confidence intervals.

Figure 7 displays the premium and exposure paths for the five insurers in the repeated-game Nash equilibrium. Across most sample paths, Nash equilibrium premiums show a clear stabilization pattern over the repeated periods
 $t=0 \to 1 \to 2 \to 3 \to 4 \to 5$
. It indicates that for most realizations of policy distribution, the repeated game process tends to move insurers toward a stable equilibrium level. These levels differ slightly from those in the baseline model due to accumulated selection effects. Generally, the behavior of insurers reveals a consistent pattern in the long-term dynamics. Across all five insurers, the mean Nash equilibrium premium exhibits a downward trend, especially after
 $t=2$
. As a result, there is a general upward trend in exposures for all insurers.
In addition to premiums, the evolution of the composition of insured policies provides insight into the competitive structure of the market. We display this composition over time in Figure 8(a) and find that the proportion of the non-insured state declines significantly. This indicates that the market strategy remains sufficiently attractive for high-risk types, who are strongly inclined to obtain coverage. By contrast, the proportion of low-risk individuals in the non-insured state increases markedly (Figure 8(b)). As a result, the concentration of high-risk policyholders in the insured pool rises, ultimately pushing up the risk exposure of the entire insurance market. Moreover, this deterioration becomes more pronounced in the repeated-game setting compared with the baseline model, indicating that the effect of risk heterogeneity accumulates over multiple periods of competition.
State composition evolution over time by risk pool.

The heatmap in Figure 9 demonstrates changes in leadership probabilities over time. We calculate the empirical leadership probability based on the number of dominant occurrences among 50 runs. As a result, insurer 2 holds the largest premium revenue at the beginning with a high-price strategy. However, such a strategy is difficult to maintain in a repeated game with a steadily declining leadership probability. As the game progresses, the dominance of insurer 2 begins to be diluted, gradually falling from 1.00 to 0.34 in period 4. At the same time, the leadership probability of insurer 5 climbs rapidly and reaches 0.56, temporarily reversing the leadership ranking. In the end, both insurers 2 and 5 hold similar leadership probabilities. Other insurers, however, have nearly zero chance of dominating the game over time. Such a dominance result is mainly driven by the value of
 $\gamma_i$
, and a lower value indicates greater market power. Insurers 2 and 5 hold the lowest value of
 $\gamma={1.1}$
, indicating a high market power in the insurance market. This makes them the only insurers able to participate in the “rotation” of leadership in the repeated game, while insurers with lower market power are marginalized in the long run.
Leadership evolution over time.

6. Conclusion
This paper studies competitive insurance pricing with heterogeneous risks. By integrating a heterogeneous loss model and a Markovian demand structure within a non-cooperative game-theoretic framework, we construct a comprehensive model. The theoretical model is illustrated through numerical simulations, providing several practical insights.
We establish a collective risk model that incorporates risk heterogeneity through different loss distributions for high- and low-risk types. To reflect the behavioral differences between the two risk types of potential policyholders, we develop a discrete-time Markovian demand model to explicitly characterize their lapse, switching, and entry transitions. Under the non-cooperative game, we analyze the best-response premium for each insurer with exponential utility preferences. A lower bound on premiums is provided to ensure appropriate incentives for insurers, and we derive an upper bound for optimal premiums. We prove the existence of the pure-strategy Nash equilibrium under specific conditions. Finally, we conduct numerical simulations to illustrate the findings and the effect of our model parameters on the Nash equilibrium portfolio. In the baseline one-period simulation, high-risk uptake increases, while low-risk types are priced out with competition among five insurers, illustrating the effect of risk heterogeneity. Following the baseline simulation, sensitivity analyses show that changes in the market risk composition and behavioral parameters alter equilibrium outcomes. Furthermore, the results shown in the repeated one-period myopic game simulation reveal a selection-driven deterioration of the risk pool. The dynamics over multiple periods reflect the joint impact of competitive pricing and risk heterogeneity in the long run.
This framework can be extended in several directions. Since the current repeated game is the iteration of multiple single-period games, it can be developed into a fully dynamic game-theoretic framework where insurers optimize for long-term terminal wealth. Additionally, it would be valuable to relax the assumption of a constant total market size. By introducing an exogenous market size factor, we may capture potential market expansion or contraction driven by demographic or macroeconomic shocks. Furthermore, future work could integrate insurer learning mechanisms into the repeated-game setting. By constantly updating the perception of policyholders’ risk through the claim experience and portfolio evolution, insurers could gradually implement risk-based pricing strategies. Such an extension would allow us to study whether a competitive market will mitigate or aggravate the effect of risk heterogeneity once partial risk classification becomes feasible.
Appendix A
Proof of Lemma 1. The marginal distribution is given by
 \begin{align*}\mathbb{P}(N_{i,\lambda}=k)= \binom{n_{\lambda}}{k}\,\pi_{i,\lambda}^k (1-\pi_{i,\lambda})^{n_{\lambda}-k},\qquad k=0,1,\dots,n_{\lambda}.\end{align*}
From the definition of PGF, we obtain
 \begin{align*}\mathbb{E}[s^{N_{i,\lambda}}]= \sum_{k=0}^{n_{\lambda}} s^k \binom{n_{\lambda}}{k}\,\pi_{i,\lambda}^k (1-\pi_{i,\lambda})^{n_{\lambda}-k}.\end{align*}
Applying the binomial theorem to the sum, it can be rewritten as
 \begin{align*}\mathbb{E}[s^{N_{i,\lambda}}]= (1-\pi_{i,\lambda} + \pi_{i,\lambda}s)^{n_{\lambda}}.\end{align*}
This completes the proof.
Proof of Proposition 1.
 \begin{align*}\mathbb{E}\big[ u_i\left(W_i^1\right) \big] & = \mathbb{E}\Big[ -\exp\big(\!-\beta_i \left(w_{i}^{0} + p_i (N_{i,H}+N_{i,L})- S_i(N_{i,H},N_{i,L})\right)\big) \Big] \\ & = -e^{-\beta_i w_{i}^{0}}\,\mathbb{E}\left[e^{ -\beta_i p_i (N_{i,H}+N_{i,L})+ \beta_i S_i(N_{i,H},0) + \beta_i S_i(0,N_{i,L}) }\right]{\!}.\end{align*}
Since the high-risk and low-risk allocations are independent, we first factorize the inner expectation by
 \begin{align*}\mathbb{E}\left[e^{ -\beta_i p_i (N_{i,H}+N_{i,L})+ \beta_i S_i(N_{i,H},0) + \beta_i S_i(0,N_{i,L}) }\right]=\mathbb{E}\big[e^{-\beta_i p_i N_{i,H}}e^{\beta_i \sum_{j=1}^{N_{i,H}} X_j^{(H)}}\big]\cdot\mathbb{E}\big[e^{-\beta_i p_i N_{i,L}}e^{\beta_i \sum_{j=1}^{N_{i,L}} X_j^{(L)}}\big].\end{align*}
Next, we will separate the analysis for the high-risk component. For a fixed
 $n_{i,H}$
, conditional on
 $N_{i,H}=n_{i,H}$
,
 \begin{align*}\mathbb{E}\big[e^{-\beta_i p_i N_{i,H}}e^{\beta_i \sum_{j=1}^{N_{i,H}} X_j^{(H)}}\mid N_{i,H}=n_{i,H}\big]=e^{-\beta_i p_i n_{i,H}}\left[M_X^{(H)}(\beta_i)\right]^{n_{i,H}}{\!}.\end{align*}
Since
 $N_{i,H}\sim\mathrm{Binomial}(n_H,\pi_{i,H})$
with
 $n_H=\eta n_{\text{tot}}$
, the unconditional expectation
 \begin{align*}\mathbb{E}\big[e^{-\beta_i p_i N_{i,H}}e^{\beta_i \sum_{j=1}^{N_{i,H}} X_j^{(H)}}\big]\end{align*}
is given by
 \begin{align*}\sum_{k=0}^{n_{H}}\binom{n_{H}}{k}(\pi_{i,H})^{k}(1-\pi_{i,H})^{n_H-k}\left[e^{-\beta_i p_i} M_X^{(H)}(\beta_i)\right]^{k}{\!}.\end{align*}
The expression above is equivalent to the PGF of a binomial distribution evaluated at
 $s=e^{-\beta_i p_i} M_X^{(H)}(\beta_i)$
, we obtain
 \begin{align*}\mathbb{E}\big[e^{-\beta_i p_i N_{i,H}}e^{\beta_i \sum_{j=1}^{N_{i,H}} X_j^{(H)}}\big]=\left[1-\pi_{i,H}+\pi_{i,H} e^{-\beta_i p_i} M_X^{(H)}(\beta_i)\right]^{n_{H}}{\!}.\end{align*}
Similarly, for low-risk types, the unconditional expectation is
 \begin{align*}\mathbb{E}\big[e^{-\beta_i p_i N_{i,L}}e^{\beta_i \sum_{j=1}^{N_{i,L}} X_j^{(L)}}\big]=\left[1-\pi_{i,L}+\pi_{i,L} e^{-\beta_i p_i} M_X^{(L)}(\beta_i)\right]^{n_L}{\!}.\end{align*}
Therefore, we can obtain the expectation of terminal wealth
 $W_i^1$
by combining both components:
 \begin{align*}\mathbb{E}\left[ u_i(W_i^1) \right]=- e^{-\beta_i w_i^{0}}\left[1-\pi_{i,H}+\pi_{i,H} e^{-\beta_i p_i} M_X^{(H)}(\beta_i)\right]^{n_H}\left[1-\pi_{i,L}+\pi_{i,L} e^{-\beta_i p_i} M_X^{(L)}(\beta_i)\right]^{n_L}{\!}.\end{align*}
This completes the proof.
Proof of Proposition 2. The cost function for insurer i is
 \begin{align*}O_i(\mathbf{p})= \sum_{\lambda\in\{H,L\}}n_{\lambda} \ln A_{i,\lambda}(\mathbf{p}),\qquad A_{i,\lambda}(\mathbf{p})= 1 + \pi_{i,\lambda}(\mathbf{p})B_{i,\lambda}(\,p_i)=1 + \pi_{i,\lambda}(\mathbf{p})\Big(e^{-\beta_i p_i}M_X^{(\lambda)}(\beta_i)-1\Big).\end{align*}
Differentiating yields
 \begin{align*}\frac{\partial O_i}{\partial p_i}= \sum_{\lambda\in\{H,L\}}\frac{n_{\lambda}}{A_{i,\lambda}(\mathbf{p})}\,\frac{\partial A_{i,\lambda}}{\partial p_i},\qquad \frac{\partial A_{i,\lambda}}{\partial p_i}=\frac{\partial\pi_{i,\lambda}}{\partial p_i} B_{i,\lambda}(\,p_i)-\pi_{i,\lambda}(\mathbf{p})\,\beta_i e^{-\beta_i p_i}M_X^{(\lambda)}(\beta_i),\end{align*}
where
 $B_{i,\lambda}(\,p_i)=e^{-\beta_i p_i}M_X^{(\lambda)}(\beta_i)-1$
. Thus,
 \begin{align*}\frac{\partial O_i}{\partial p_i}=\sum_{\lambda\in\{H,L\}}\frac{n_{\lambda}}{A_{i,\lambda}(\mathbf{p})}\!\left[\frac{\partial\pi_{i,\lambda}}{\partial p_i} B_{i,\lambda}(\,p_i)-\pi_{i,\lambda}(\mathbf{p})\,\beta_i e^{-\beta_i p_i}M_X^{(\lambda)}(\beta_i)\right]{\!}.\end{align*}
Step 1. Derivative of market share. By definition, it holds that
 \begin{align*}\pi_{i,\lambda}(\mathbf{p})=\frac{q_{i,\lambda}}{n_{\lambda}},\qquad q_{i,\lambda}=\sum_{j=0}^m n_{j,\lambda} P_{j,i,\lambda}(\,p).\end{align*}
Since
 $n_{\lambda}$
is fixed and does not depend on
 $p_i$
, we obtain
 \begin{align*}\frac{\partial\pi_{i,\lambda}}{\partial p_i}=\frac{1}{n_{\lambda}}\sum_{j=0}^m n_{j,\lambda}\frac{\partial P_{j,i,\lambda}}{\partial p_i}.\end{align*}
The following derivative is computed separately for
 $j=0$
,
 $j=i$
, and
 $j\neq i$
.
Step 2. Transition from the non-insured state (
 $j=0$
). The transition probability is
 \begin{align*}P_{0,i,\lambda}=\exp\!\left(\!-\theta_{\lambda}\frac{\bar p_1}{\bar p_0}\right)\frac{\exp(\!-{\delta_{\lambda}}\gamma_i p_{i,1}) }{\sum_{k=1}^{m}\exp(\!-{\delta_{\lambda}}\gamma_k p_{k,1}) }.\end{align*}
Differentiating gives
 \begin{align*}\frac{\partial P_{0,i,\lambda}}{\partial p_i}=P_{0,i,\lambda}\left[-\frac{\theta_{\lambda}}{m\bar p_0}-{\delta_{\lambda}}\gamma_i\left(1-\frac{\exp(\!-{\delta_{\lambda}}\gamma_i p_{i,1})}{\sum_{k=1}^m \exp(\!-{\delta_{\lambda}}\gamma_k p_{k,1})}\right)\right]{\!}.\end{align*}
Thus, the contribution to
 $\partial\pi_{i,\lambda}/\partial p_i$
is
 \begin{align*}\mathscr{T}_1^{\ \lambda}=n_{0,\lambda}\,\frac{\partial P_{0,i,\lambda}}{\partial p_i}.\end{align*}
Step 3. Transition from other insurers (
 $j\neq i$
). For insured states (
 $j\ge 1$
),
 \begin{align*}P_{j,i,\lambda}= (1-P_{j,0,\lambda})\frac{\exp(\,f_{j,i,\lambda})}{D_j},\qquad D_j=1+\sum_{l\neq j}\exp(\,f_{j,l,\lambda}){\!},\end{align*}
where
 \begin{align*}P_{j,0, \lambda} =1- \exp\left( -\kappa_{\lambda} \gamma_j \frac{\bar{p}_1}{\bar{p}_0} \right),\qquad f_{j,l,\lambda}=\alpha_{\lambda}\gamma_j\frac{p_{j,1}}{p_{l,1}}-h.\end{align*}
When
 $j\neq i$
, the derivative is
 \begin{align*}\frac{\partial P_{j,i,\lambda}}{\partial p_i}=- \gamma_jP_{j,i,\lambda}\left[\left(1-\frac{\exp(\,f_{j,i,\lambda})}{D_j}\right)\alpha_{\lambda}\frac{p_{j,1}}{p_{i,1}^2}+\frac{\kappa_{\lambda}}{m\bar p_0}\right]{\!}.\end{align*}
Thus,
 \begin{align*}\mathscr{T}_2^{\ \lambda}=\sum_{\substack{j\neq i \\ j\ge 1}}n_{j,\lambda}\frac{\partial P_{j,i,\lambda}}{\partial p_i}.\end{align*}
Step 4. Self-transition of insurer i
(
 $j=i$
).
 \begin{align*}P_{\textit{i,i,}\lambda}= (1-P_{i,0,\lambda})\frac{1}{D_i}.\end{align*}
Differentiating yields
 \begin{align*}\frac{\partial P_{\textit{i,i,}\lambda}}{\partial p_i}=-\frac{\gamma_i\exp\!\left(-\kappa_{\lambda}\gamma_i\frac{\bar p_1}{\bar p_0}\right)}{D_i^2}\left[\frac{\kappa_{\lambda} D_i}{m\bar p_0}+\alpha_{\lambda}\sum_{l\neq i}\frac{\exp(\,f_{\textit{i,l,}\lambda})}{p_{l,1}}\right]{\!}.\end{align*}
Hence,
 \begin{align*}\mathscr{T}_3^{\ \lambda} =n_{i,\lambda}\frac{\partial P_{\textit{i,i,}\lambda}}{\partial p_i}.\end{align*}
Final aggregation. Combining Steps 1–4,
 \begin{align*}\frac{\partial\pi_{i,\lambda}}{\partial p_i}=\frac{1}{n_{\lambda}}\big(\mathscr{T}_1^{\ \lambda}+\mathscr{T}_2^{\ \lambda}+\mathscr{T}_3^{\ \lambda}\big).\end{align*}
Substituting this into the derivative of
 $O_i$
produces
 \begin{align*}\begin{aligned}\frac{\partial O_i}{\partial p_i}&=\sum_{\lambda\in\{H,L\}}\frac{1}{A_{i,\lambda}(\mathbf{p})}\Bigg\{\Big[\mathscr{T}_1^{\ \lambda}+\mathscr{T}_2^{\ \lambda}+\mathscr{T}_3^{\ \lambda}\Big]B_{i,\lambda}(\,p_i)-n_{\lambda}\,\pi_{i,\lambda}(\mathbf{p})\,\beta_i e^{-\beta_i p_i}M_X^{(\lambda)}(\beta_i)\Bigg\},\end{aligned}\end{align*}
which is the desired expression.
Proof of Lemma 2. From Assumption 2, it follows that
 $X^{(H)}$
first-order stochastically dominates (FOSD)
 $X^{(L)}$
. Consequently, for any
 $\beta_i\gt0$
,
 \begin{align*}M_X^{(H)}(\beta_i) \;\ge \; M_X^{(L)}(\beta_i).\end{align*}
Suppose that the premium
 $p_i$
satisfies
 \begin{align*}p_i \;\ge \; \frac{\ln\!\left(M_X^{(H)}(\beta_i)\right)}{\beta_i}.\end{align*}
Then we have
 \begin{align*}e^{-\beta_i p_i} M_X^{(L)}(\beta_i)\;\le\;e^{-\beta_i p_i} M_X^{(H)}(\beta_i)\;\le\; 1.\end{align*}
We now verify the individual rationality constraint (16). Using the exponential utility function
 $u_i(x)=-e^{-\beta_i x}$
, we consider
 \begin{align*}\mathbb{E}\!\left[u_i\!\left(w_i^0 + (N_{i,H}+N_{i,L}) \underline p_{\,i} - S_i(N_{i,H},N_{i,L})\right)\right]{\!}.\end{align*}
Conditioning on
 $(N_{i,H},N_{i,L})$
and using independence of claims across policies and types, we obtain
 \begin{align*}&\mathbb{E}\!\left[u_i\!\left(w_i^0 + (N_{i,H}+N_{i,L}) \underline p_i - S_i(N_{i,H},N_{i,L})\right)\right] \\&=\mathbb{E}\Big[- e^{-\beta_i\left(w_i^0+ \sum_{j=1}^{N_{i,H}} \left(\underline p_i - X_{ij}^{(H)}\right)+ \sum_{k=1}^{N_{i,L}} \left(\underline p_i - X_{ik}^{(L)}\right)\right)}\Big] \\&=- e^{-\beta_i w_i^0}\mathbb{E}\!\left[\left(e^{-\beta_i \underline p_i} M_X^{(H)}(\beta_i)\right)^{N_{i,H}}\left(e^{-\beta_i \underline p_i} M_X^{(L)}(\beta_i)\right)^{N_{i,L}}\right]{\!}.\end{align*}
Since both
 $e^{-\beta_i \underline p_i} M_X^{(H)}(\beta_i) \le 1$
and
 $e^{-\beta_i \underline p_i} M_X^{(L)}(\beta_i) \le 1$
, and
 $N_{i,H},N_{i,L}\ge 0$
, it follows that
 \begin{align*}\mathbb{E}\!\left[\left(e^{-\beta_i \underline p_i} M_X^{(H)}(\beta_i)\right)^{N_{i,H}}\left(e^{-\beta_i \underline p_i} M_X^{(L)}(\beta_i)\right)^{N_{i,L}}\right]\;\le\; 1.\end{align*}
Therefore,
 \begin{align*}\mathbb{E}\!\left[u_i\!\left(w_i^0 + (N_{i,H}+N_{i,L}) \underline p_i - S_i(N_{i,H},N_{i,L})\right)\right]\;\ge \;- e^{-\beta_i w_i^0}=u_i(w_i^0),\end{align*}
which implies the individual rationality constraint (16) is satisfied. This completes the proof.
Derivation of the Terms
 $\mathscr{T}_1^{\ \lambda}$
,
 $\mathscr{T}_2^{\ \lambda}$
, and
 $\mathscr{T}_3^{\ \lambda}$
We next provide a detailed derivation of the derivative of
 $\partial \pi_{i,\lambda}(\mathbf{p})/\partial p_i$
, which is used in subsequent proofs. Recall that the derivative of the market share is
 \begin{align*}\frac{\partial \pi_{i,\lambda}(\mathbf{p})}{\partial p_i}= \frac{1}{n_{\lambda}}\sum_{j=0}^{m} n_{j,\lambda}\frac{\partial P_{j,i,\lambda}}{\partial p_i},\end{align*}
which naturally decomposes into three parts:
 \begin{align*}\mathscr{T}_1^{\ \lambda}\,:\,j=0,\qquad \mathscr{T}_2^{\ \lambda}\,:\,j\neq i,\qquad \mathscr{T}_3^{\ \lambda}\,:\,j=i.\end{align*}
(1) Derivation of
 $\mathscr{T}_1^{\ \lambda}$
(transition from
 $j=0$
). The non-insured-to-i transition probability is
 \begin{align*}P_{0,i,\lambda}(\,p)=\exp\!\left(\!-\theta_{\lambda}\frac{\bar{p}_1}{\bar{p}_0}\right)\cdot\frac{\exp\!(\!-{\delta_{\lambda}}\gamma_i p_{i,1})}{\sum_{k=1}^m \exp\!(\!-{\delta_{\lambda}}\gamma_k p_{k,1})}.\end{align*}
Let
 \begin{align*}C(\,p)=\exp\!\left(\!-\theta_{\lambda}\frac{\bar p_1}{\bar p_0}\right){\!},\qquad R(\,p)=\frac{\exp\!(\!-{\delta_{\lambda}}\gamma_i p_{i,1})}{\sum_{k=1}^m\exp\!(\!-{\delta_{\lambda}}\gamma_k p_{k,1})},\end{align*}
so that
 $P_{0,i,\lambda}=CR$
. Then,
 \begin{align*}\frac{\partial P_{0,i,\lambda}}{\partial p_i}= C'R + CR'.\end{align*}
Derivative of C. Since
 $\bar p_t = \frac{1}{m}\sum_{i=1}^m p_{i,t}$
,
 \begin{align*}C'(\,p)=C(\,p)\left(\!-\frac{\theta_{\lambda}}{m\bar p_0}\right).\end{align*}
Derivative of R. Let
 $\mathrm{num}=e^{-{\delta_{\lambda}}\gamma_i p_{i,1}}$
and
 $S=\sum_k e^{-{\delta_{\lambda}}\gamma_k p_{k,1}}$
. The quotient rule yields
 \begin{align*}R'(\,p)= -{\delta_{\lambda}}\gamma_i\,R(1-R).\end{align*}
Combining the parts:
 \begin{align*}\frac{\partial P_{0,i,\lambda}}{\partial p_i}=P_{0,i,\lambda}\left[-\frac{\theta_{\lambda}}{m\bar p_0}-{\delta_{\lambda}}\gamma_i\left(1-R\right)\right]{\!}.\end{align*}
Multiplying by exposure yields the first component:
 \begin{align*}\mathscr{T}_1^{\ \lambda}=n_{0,\lambda}\,P_{0,i,\lambda}\left[-\frac{\theta_{\lambda}}{m\bar p_0}-{\delta_{\lambda}}\gamma_i\left(1-\frac{\exp(\!-{\delta_{\lambda}}\gamma_i p_{i,1})}{\sum_{k=1}^m \exp(\!-{\delta_{\lambda}}\gamma_k p_{k,1})}\right)\right]{\!}.\end{align*}
Derivation of
 $\mathscr{T}_2^{\ \lambda}$
and
 $\mathscr{T}_3^{\ \lambda}$
For a policyholder currently with insurer
 $j\ge 1$
, the transition rule is
-
• Stage 1 (lapse):
\begin{align*}P_{j,0,\lambda}=1-\exp\left(\!-\kappa_{\lambda}\gamma_j \frac{\bar p_1}{\bar p_0}\right),\qquad \bar p_1=\frac1m\sum_{k=1}^m p_k.\end{align*}
-
• Stage 2 (conditional switch):
where
\begin{align*}P_{j,i,\lambda\mid i\neq 0}=\begin{cases}\dfrac{1}{D_j}, & i=j,\\[4pt]\dfrac{\exp(\,f_{j,i,\lambda})}{D_j}, & i\neq j,\end{cases},\end{align*}
\begin{align*}D_j=1+\sum_{l\neq j}\exp(\,f_{j,l,\lambda}),\qquad f_{j,i,\lambda}=\alpha_{\lambda}\gamma_j\frac{p_{j,1}}{p_{i,1}}-h.\end{align*}
-
• Full transition:
\begin{align*}P_{j,i,\lambda}= (1-P_{j,0,\lambda})P_{j,i,\lambda\mid i\neq 0}.\end{align*}


Derivative of
 $f_{j,l,\lambda}$
. Recall that for the switching behavior, the relative attractiveness term is defined only for competitors distinct from the current insurer, namely
 \begin{align*}f_{j,l,\lambda}=\alpha_{\lambda}\gamma_j\frac{p_{j,1}}{p_{l,1}}-h,\qquad l\neq j.\end{align*}
Hence, throughout this subsection we always assume
 $l\neq j$
. Using direct differentiation:
 \begin{align*}\frac{\partial f_{j,l,\lambda}}{\partial p_i}=\alpha_{\lambda}\gamma_j\left(\mathbf{1}_{\{i=j\}}\frac{1}{p_{l,1}}-\mathbf{1}_{\{i=l\}}\frac{p_{j,1}}{p_{l,1}^2}\right),\qquad l\neq j.\end{align*}
That is, the derivative is nonzero only in two cases:
-
• when
$i=j$
, since
$p_i$
appears in the numerator; -
• when
$i=l$
, since
$p_i$
appears in the denominator.


In particular, for
 $j\neq i$
,
 \begin{align*}\frac{\partial f_{j,i,\lambda}}{\partial p_i}=-\alpha_{\lambda}\gamma_j\frac{p_{j,1}}{p_{i,1}^2},\end{align*}
since here
 $i=l$
.
Similarly, for
 $l\neq i$
,
 \begin{align*}\frac{\partial f_{\textit{i,l,}\lambda}}{\partial p_i}=\alpha_{\lambda}\gamma_i\frac{1}{p_{l,1}},\end{align*}
since here
 $i=j$
.
Derivative of lapse probability. Since
 \begin{align*}\qquad \frac{\partial \bar p_1}{\partial p_i}=\frac1m,\end{align*}
we obtain
 \begin{align*}\frac{\partial \frac{\bar p_1}{\bar p_0}}{\partial p_i}=\frac{1}{m\bar p_0}.\end{align*}
Hence,
 \begin{align*}\frac{\partial P_{j,0,\lambda}}{\partial p_i}=\exp(\!-\kappa_{\lambda}\gamma_j \frac{\bar p_1}{\bar p_0})\,\kappa_{\lambda}\gamma_j\frac{1}{m\bar p_0}.\end{align*}
(2) Derivation of
 $\mathscr{T}_2^{\ \lambda}$
(switches from other insurers,
 $j\neq i$
). For
 $j\neq i$
,
 \begin{align*}P_{j,i,\lambda}=(1-P_{j,0,\lambda})\frac{\exp(\,f_{j,i,\lambda})}{D_j}=\frac{\exp(\,f_{j,i,\lambda})\exp(\!-\kappa_{\lambda}\gamma_j \frac{\bar p_1}{\bar p_0})}{D_j}.\end{align*}
Differentiate using the product rule:
 \begin{align*}\frac{\partial P_{j,i,\lambda}}{\partial p_i}=(1-P_{j,0,\lambda})\frac{\partial}{\partial p_i}\left(\frac{\exp(\,f_{j,i,\lambda})}{D_j}\right)-\frac{\exp(\,f_{j,i,\lambda})}{D_j}\frac{\partial P_{j,0,\lambda}}{\partial p_i}.\end{align*}
Now,
 \begin{align*}\frac{\partial}{\partial p_i}\left(\frac{\exp(\,f_{j,i,\lambda})}{D_j}\right)=\frac{\exp(\,f_{j,i,\lambda})}{D_j}\left(1-\frac{\exp(\,f_{j,i,\lambda})}{D_j}\right)\frac{\partial f_{j,i,\lambda}}{\partial p_i}.\end{align*}
Therefore,
 \begin{align*}\frac{\partial P_{j,i,\lambda}}{\partial p_i}=-(1-P_{j,0,\lambda})\frac{\exp(\,f_{j,i,\lambda})}{D_j}\left(1-\frac{\exp(\,f_{j,i,\lambda})}{D_j}\right)\alpha_{\lambda}\gamma_j\frac{p_{j,1}}{p_{i,1}^2}-\frac{\exp(\,f_{j,i,\lambda})}{D_j}\exp(\!-\kappa_{\lambda}\gamma_j \frac{\bar p_1}{\bar p_0})\kappa_{\lambda}\gamma_j\frac{1}{m\bar p_0}.\end{align*}
We can further simplify it by:
 \begin{align*}\frac{\partial P_{j,i,\lambda}}{\partial p_i}=-\gamma_j P_{j,i,\lambda}\left[\left(1-\frac{\exp(\,f_{j,i,\lambda})}{D_j}\right)\alpha_{\lambda}\frac{p_{j,1}}{p_{i,1}^2}+\frac{\kappa_{\lambda}}{m\bar p_0}\right],\qquad j\neq i,\ j\ge 1,\end{align*}
Thus,
 \begin{align*}{\mathscr{T}_2^{\ \lambda}=\sum_{\substack{j\neq i \\ j\ge 1}}n_{j,\lambda}\frac{\partial P_{j,i,\lambda}}{\partial p_i}.}\end{align*}
(3) Derivation of
 $\mathscr{T}_3^{\ \lambda}$
(self-transition,
 $j=i$
). Here,
 \begin{align*}P_{\textit{i,i,}\lambda}=(1-P_{i,0,\lambda})\frac{1}{D_i}.\end{align*}
Differentiate
 \begin{align*}\frac{\partial P_{\textit{i,i,}\lambda}}{\partial p_i}=-\frac{\partial P_{i,0,\lambda}}{\partial p_i}\frac{1}{D_i}+(1-P_{i,0,\lambda})\left(\!-\frac{1}{D_i^2}\frac{\partial D_i}{\partial p_i}\right){\!}.\end{align*}
Now,
 \begin{align*}\frac{\partial D_i}{\partial p_i}=\sum_{l\neq i}\exp(\,f_{\textit{i,l,}\lambda})\frac{\partial f_{\textit{i,l,}\lambda}}{\partial p_i}=\alpha_{\lambda}\gamma_i\sum_{l\neq i}\frac{\exp(\,f_{\textit{i,l,}\lambda})}{p_{l,1}}.\end{align*}
Hence,
 \begin{align*}\frac{\partial P_{\textit{i,i,}\lambda}}{\partial p_i} & =-\frac{\exp(\!-\kappa_{\lambda}\gamma_i \frac{\bar p_1}{\bar p_0})\kappa_{\lambda}\gamma_i}{m\bar p_0 D_i}-(1-P_{i,0,\lambda})\frac{\alpha_{\lambda}\gamma_i\sum_{l\neq i}\exp(\,f_{\textit{i,l,}\lambda})/p_{l,1}}{D_i^2} \\ & =-\frac{\gamma_i\exp\!\left(\!-\kappa_{\lambda}\gamma_i\frac{\bar p_1}{\bar p_0}\right)}{D_i^2}\left[\frac{\kappa_{\lambda} D_i}{m\bar p_0}+\alpha_{\lambda}\sum_{l\neq i}\frac{\exp(\,f_{\textit{i,l,}\lambda})}{p_{l,1}}\right]{\!}.\end{align*}
Therefore,
 \begin{align*}\mathscr{T}_3^{\ \lambda}=n_{i,\lambda}\frac{\partial P_{\textit{i,i,}\lambda}}{\partial p_i}.\end{align*}
The total derivative can therefore be written as:
 \begin{align*}\frac{\partial O_i}{\partial p_i}&=\sum_{\lambda\in\{H,L\}}\frac{1}{A_{\lambda}}\Bigg\{\Bigg[\underbrace{n_{0,\lambda}P_{0,i,\lambda}\left(\!-\frac{\theta_{\lambda}}{m\bar p_0}-\delta_{\lambda}\gamma_i\left(1-\frac{\exp(\!-\delta_{\lambda}\gamma_i p_{i,1})}{\sum_{k=1}^{m}\exp(\!-\delta_{\lambda}\gamma_k p_{k,1})}\right)\right)}_{\mathscr{T}_1^{\ \lambda}}\\[8pt]&\quad -\underbrace{\sum_{\substack{j\neq i \\ j\ge 1}}n_{j,\lambda}\,\gamma_j P_{j,i,\lambda}\left[\alpha_{\lambda}\frac{p_{j,1}}{p_{i,1}^2}\left(1-\frac{\exp(\,f_{j,i,\lambda})}{D_j}\right)+\frac{\kappa_{\lambda}}{m\bar p_0}\right]}_{\mathscr{T}_2^{\ \lambda}}\\[8pt]&\quad -\underbrace{n_{i,\lambda}\frac{\gamma_i\exp\!\left(\!-\kappa_{\lambda}\gamma_i\frac{\bar p_1}{\bar p_0}\right)}{D_i^2}\left[\frac{\kappa_{\lambda} D_i}{m\bar p_0}+\alpha_{\lambda}\sum_{l\neq i}\frac{\exp(\,f_{\textit{i,l,}\lambda})}{p_{l,1}}\right]}_{\mathscr{T}_3^{\ \lambda}}\Bigg]B_{i,\lambda}(\,p_i)\\[8pt]&\quad -n_{\lambda}\,\pi_{i,\lambda}(\mathbf p)\,\beta_i e^{-\beta_i p_i}M_X^{(\lambda)}(\beta_i)\Bigg\}.\end{align*}
Proof of Lemma 3. Fix insurer i and risk type
 $\lambda\in\{H,L\}$
. Recall that
 \begin{align*}\pi_{i,\lambda}(\mathbf p)=\frac{1}{n_{\lambda}}\sum_{j=0}^m n_{j,\lambda}P_{j,i,\lambda}(\mathbf p).\end{align*}
We first show that the market share of insurer i decreases at least proportionally to itself when
 $p_i$
increases.
For transitions from the non-insured state,
 \begin{align*}P_{0,i,\lambda}=\exp\!\left(\!-\theta_{\lambda}\frac{\bar p_1}{\bar p_0}\right)\frac{\exp(\!-\delta_{\lambda}\gamma_i p_i)}{\sum_{k=1}^m \exp(\!-\delta_{\lambda}\gamma_k p_k)}.\end{align*}
Differentiating with respect to
 $p_i$
gives
 \begin{align*}\frac{\partial P_{0,i,\lambda}}{\partial p_i}=P_{0,i,\lambda}\left[-\frac{\theta_{\lambda}}{m\bar p_0}-\delta_{\lambda}\gamma_i\left(1-\frac{\exp(\!-\delta_{\lambda}\gamma_i p_i)}{\sum_{k=1}^m \exp(\!-\delta_{\lambda}\gamma_k p_k)}\right)\right]{\!}.\end{align*}
Hence,
 \begin{align*}-\frac{\partial P_{0,i,\lambda}}{\partial p_i}\ge \frac{\theta_{\lambda}}{m\bar p_0}P_{0,i,\lambda}.\end{align*}
For transitions from insured states, we distinguish the cases
 $j\neq i$
and
 $j=i$
. If
 $j\neq i$
, then
 \begin{align*}P_{j,i,\lambda}=\exp\!\left(\!-\kappa_{\lambda}\gamma_j\frac{\bar p_1}{\bar p_0}\right)\frac{\exp(\,f_{j,i,\lambda})}{D_j}.\end{align*}
Using the derivative computed in Proposition 2,
 \begin{align*}\frac{\partial P_{j,i,\lambda}}{\partial p_i}=-\gamma_jP_{j,i,\lambda}\left[\left(1-\frac{\exp(\,f_{j,i,\lambda})}{D_j}\right)\alpha_{\lambda}\frac{p_{j,1}}{p_{i,1}^2}+\frac{\kappa_{\lambda}}{m\bar p_0}\right]{\!}.\end{align*}
Hence,
 \begin{align*}-\frac{\partial P_{j,i,\lambda}}{\partial p_i}\ge \frac{\kappa_{\lambda}\gamma_j}{m\bar p_0}P_{j,i,\lambda},\qquad j\neq i.\end{align*}
If
 $j=i$
, then
 \begin{align*}P_{\textit{i,i,}\lambda}=\exp\!\left(\!-\kappa_{\lambda}\gamma_i\frac{\bar p_1}{\bar p_0}\right)\frac{1}{D_i}.\end{align*}
Again using Proposition 2,
 \begin{align*}\frac{\partial P_{\textit{i,i,}\lambda}}{\partial p_i}=-\frac{\gamma_i\exp\!\left(\!-\kappa_{\lambda}\gamma_i\frac{\bar p_1}{\bar p_0}\right)}{D_i^2}\left[\frac{\kappa_{\lambda} D_i}{m\bar p_0}+\alpha_{\lambda}\sum_{l\neq i}\frac{\exp(\,f_{\textit{i,l,}\lambda})}{p_{l,1}}\right]{\!}.\end{align*}
Since
 $P_{\textit{i,i,}\lambda}=\exp(\!-\kappa_{\lambda}\gamma_i\bar p_1/\bar p_0)/D_i$
, this implies
 \begin{align*}-\frac{\partial P_{\textit{i,i,}\lambda}}{\partial p_i}\ge \frac{\kappa_{\lambda}\gamma_i}{m\bar p_0}P_{\textit{i,i,}\lambda}.\end{align*}
Therefore, for every
 $j=1,\ldots,m$
,
 \begin{align*}-\frac{\partial P_{j,i,\lambda}}{\partial p_i}\ge \frac{\kappa_{\lambda}\gamma_j}{m\bar p_0}P_{j,i,\lambda}.\end{align*}
Define
 \begin{align*}c_{\lambda}\,:\!=\,\min\left\{\frac{\theta_{\lambda}}{m\bar p_0},\frac{\kappa_{\lambda}\gamma_1}{m\bar p_0},\ldots,\frac{\kappa_{\lambda}\gamma_m}{m\bar p_0}\right\} \gt 0.\end{align*}
Then, for every
 $j=0,1,\ldots,m$
,
 \begin{align*}-\frac{\partial P_{j,i,\lambda}}{\partial p_i}\ge c_{\lambda} P_{j,i,\lambda}.\end{align*}
Consequently,
 \begin{align*}\frac{\partial \pi_{i,\lambda}}{\partial p_i}=\frac{1}{n_{\lambda}}\sum_{j=0}^m n_{j,\lambda}\frac{\partial P_{j,i,\lambda}}{\partial p_i}\le-c_{\lambda}\frac{1}{n_{\lambda}}\sum_{j=0}^m n_{j,\lambda}P_{j,i,\lambda}=-c_{\lambda}\pi_{i,\lambda}.\end{align*}
Recall that
 \begin{align*}O_i(\mathbf p)=\sum_{\lambda\in\{H,L\}}n_{\lambda}\ln A_{i,\lambda}(\mathbf p),\end{align*}
where
 \begin{align*}A_{i,\lambda}(\mathbf p)=1+\pi_{i,\lambda}(\mathbf p)B_{i,\lambda}(\,p_i),\qquad B_{i,\lambda}(\,p_i)=M_X^{(\lambda)}(\beta_i)e^{-\beta_i p_i}-1.\end{align*}
For
 $p_i \ge \underline p_i$
, Assumption 2 and the definition of
 $\underline p_i$
imply
 \begin{align*}B_{i,\lambda}(\,p_i)\le0.\end{align*}
Moreover,
 \begin{align*}A_{i,\lambda}(\mathbf p)=1-\pi_{i,\lambda}(\mathbf p)+\pi_{i,\lambda}(\mathbf p)M_X^{(\lambda)}(\beta_i)e^{-\beta_i p_i}\gt0.\end{align*}
The derivative of
 $O_i$
is
 \begin{align*}\frac{\partial O_i}{\partial p_i}=\sum_{\lambda\in\{H,L\}}\frac{n_{\lambda}}{A_{i,\lambda}(\mathbf p)}\left[\frac{\partial\pi_{i,\lambda}}{\partial p_i}B_{i,\lambda}(\,p_i)-\pi_{i,\lambda}(\mathbf p)\beta_i e^{-\beta_i p_i}M_X^{(\lambda)}(\beta_i)\right]{\!}.\end{align*}
Using
 \begin{align*}\frac{\partial\pi_{i,\lambda}}{\partial p_i}\le-c_{\lambda}\pi_{i,\lambda}\quad\text{and}\quad B_{i,\lambda}(\,p_i)\le0,\end{align*}
we obtain
 \begin{align*}\frac{\partial\pi_{i,\lambda}}{\partial p_i}B_{i,\lambda}(\,p_i)\ge c_{\lambda}\pi_{i,\lambda}(\mathbf p)\bigl(-B_{i,\lambda}(\,p_i)\bigr).\end{align*}
Therefore, the expression inside the square brackets is bounded below by
 \begin{align*}\pi_{i,\lambda}(\mathbf p)\left[c_{\lambda}\bigl(-B_{i,\lambda}(\,p_i)\bigr)-\beta_i e^{-\beta_i p_i}M_X^{(\lambda)}(\beta_i)\right]{\!}.\end{align*}
Since
 \begin{align*}-B_{i,\lambda}(\,p_i)=1-M_X^{(\lambda)}(\beta_i)e^{-\beta_i p_i}\to1\end{align*}
and
 \begin{align*}\beta_i e^{-\beta_i p_i}M_X^{(\lambda)}(\beta_i)\to0\end{align*}
as
 $p_i \to \infty$
, there exists
 $p_i^{U} \lt \infty$
such that, for all
 $p_i\ge p_i^U$
and all
 $\lambda\in\{H,L\}$
,
 \begin{align*}c_{\lambda}\bigl(-B_{i,\lambda}(\,p_i)\bigr)-\beta_i e^{-\beta_i p_i}M_X^{(\lambda)}(\beta_i)\gt0.\end{align*}
Hence,
 \begin{align*}\frac{\partial O_i}{\partial p_i}(\,p_i,p_{-i})\gt0\end{align*}
for all
 $p_i\ge p_i^U$
and all
 $p_{-i}\in \prod_{k\neq i}[\underline p_k,\infty),$
Thus,
 $p_i\mapsto O_i(\,p_i,p_{-i})$
is strictly increasing on
 $[p_i^U,\infty)$
. Therefore, no minimizer of
 $O_i(\cdot,p_{-i})$
over
 $[\underline p_i,\infty)$
can lie above
 $p_i^U$
. Since
 $O_i(\cdot,p_{-i})$
is continuous on the compact interval
 $[\underline p_i,p_i^U]$
, a minimizer exists and every minimizer lies in
 $[\underline p_i,p_i^U]$
.
Proof of Lemma 4. Fix i and
 $p_{-i}$
and suppress
 $p_{-i}$
in the notation. For each
 $\lambda\in\{L,H\}$
, we have
 \begin{align*}A_{i,\lambda}(\,p_i)= 1 + \pi_{i,\lambda}(\,p_i) B_{i,\lambda}(\,p_i),\end{align*}
so
 \begin{align*}O_{i,\lambda}'(\,p_i)= n_{\lambda}\,\frac{ A_{i,\lambda}'(\,p_i)}{A_{i,\lambda}(\,p_i)},\qquad A_{i,\lambda}'(\,p_i)= \pi_{i,\lambda}'(\,p_i) B_{i,\lambda}(\,p_i)+ \pi_{i,\lambda}(\,p_i) B_{i,\lambda}'(\,p_i).\end{align*}
By definition of
 $\Sigma\mathscr{T}^{\ \lambda}$
,
 \begin{align*} \pi_{i,\lambda}'(\,p_i) = \frac{1}{n_{\lambda}}\,\Sigma\mathscr{T}^{\ \lambda},\end{align*}
so
 \begin{align*} A_{i,\lambda}'(\,p_i)= \frac{\Sigma\mathscr{T}^{\ \lambda}}{n_{\lambda}}\,B_{i,\lambda}(\,p_i)+ \pi_{i,\lambda}(\,p_i) B_{i,\lambda}'(\,p_i).\end{align*}
Hence,
 \begin{equation} O_{i,\lambda}'(\,p_i)= \frac{\Sigma\mathscr{T}^{\ \lambda} B_{i,\lambda}(\,p_i)+ n_{\lambda} \pi_{i,\lambda}(\,p_i) B_{i,\lambda}'(\,p_i)}{A_{i,\lambda}(\,p_i)}.\end{equation}
For convenience, let
 $Q_{i,\lambda}(\,p_i) \,:\!=\, n_{\lambda} \pi_{i,\lambda}(\,p_i) \gt 0$
and define
 \begin{align*}E_{\lambda}(\,p_i)\,:\!=\, \Sigma\mathscr{T}^{\ \lambda} B_{i,\lambda}(\,p_i)+ Q_{i,\lambda}(\,p_i) B_{i,\lambda}'(\,p_i),\end{align*}
so that
 \begin{align*}O_{i,\lambda}'(\,p_i) = \frac{E_{\lambda}(\,p_i)}{A_{i,\lambda}(\,p_i)}.\end{align*}
Step 1: Monotonicity of
 $E_{\lambda}$
. Differentiating
 $E_{\lambda}$
gives
 \begin{align*} E_{\lambda}'(\,p_i)&=\left(\frac{\partial}{\partial p_i}\Sigma\mathscr{T}^{\ \lambda}(\,p_i)\right) B_{i,\lambda}(\,p_i)+ \Sigma\mathscr{T}^{\ \lambda} B_{i,\lambda}'(\,p_i)+ Q_{i,\lambda}'(\,p_i) B_{i,\lambda}'(\,p_i)+ Q_{i,\lambda}(\,p_i) B_{i,\lambda}''(\,p_i).\end{align*}
Since
 $ Q_{i,\lambda}'(\,p_i) = n_{\lambda} \pi_{i,\lambda}'(\,p_i)= \Sigma\mathscr{T}^{\ \lambda}$
, we can rewrite this as
 \begin{equation} E_{\lambda}(\,p_i)'=\left(\frac{\partial}{\partial p_i}\Sigma\mathscr{T}^{\ \lambda}\right) B_{i,\lambda}(\,p_i)+ 2\,\Sigma\mathscr{T}^{\ \lambda} B_{i,\lambda}'(\,p_i)+ Q_{i,\lambda}(\,p_i) B_{i,\lambda}''(\,p_i).\end{equation}
By the definition of
 $B_{i,\lambda}$
, we have
 \begin{align*}B_{i,\lambda}'(\,p_i)= -\beta_i e^{-\beta_i p_i} M_X^{(\lambda)}(\beta_i) \lt 0,\qquad B_{i,\lambda}''(\,p_i)= \beta_i^2 e^{-\beta_i p_i} M_X^{(\lambda)}(\beta_i) \gt 0.\end{align*}
Hence,
 $Q_{i,\lambda}(\,p_i) B_{i,\lambda}''(\,p_i) \gt 0$
for all
 $p_i\in P_i$
.
Next, use the elasticity condition in (i). Define
 \begin{align*}\eta_{\lambda}(\,p_i)\,:\!=\, \frac{\partial \ln(\!-\Sigma\mathscr{T}^{\ \lambda}{\bigr)}} {\partial \ln(\!-B_{i,\lambda}(\,p_i))}= \frac{\frac{\partial}{\partial p_i}\Sigma\mathscr{T}^{\ \lambda}}{\Sigma\mathscr{T}^{\ \lambda}} \Big/ \frac{B_{i,\lambda}'(\,p_i)}{B_{i,\lambda}(\,p_i)}.\end{align*}
Then
 \begin{align*}\frac{\partial}{\partial p_i}\Sigma\mathscr{T}^{\ \lambda}= \eta_{\lambda}(\,p_i)\,\Sigma\mathscr{T}^{\ \lambda}\, \frac{B_{i,\lambda}'(\,p_i)}{B_{i,\lambda}(\,p_i)}.\end{align*}
Multiplying by
 $B_{i,\lambda}(\,p_i)$
yields
 \begin{align*}\left(\frac{\partial}{\partial p_i}\Sigma\mathscr{T}^{\ \lambda}\right) B_{i,\lambda}(\,p_i)= \eta_{\lambda}(\,p_i)\,\Sigma\mathscr{T}^{\ \lambda} B_{i,\lambda}'(\,p_i).\end{align*}
Thus, the sum of the first two terms in (19) becomes
 \begin{align*}\left(\frac{\partial}{\partial p_i}\Sigma\mathscr{T}^{\ \lambda}\right) B_{i,\lambda}(\,p_i)+ 2\,\Sigma\mathscr{T}^{\ \lambda} B_{i,\lambda}'(\,p_i)=\Sigma\mathscr{T}^{\ \lambda} B_{i,\lambda}'(\,p_i)\bigl(\eta_{\lambda}(\,p_i) + 2\bigr).\end{align*}
By assumption (i),
 $\Sigma\mathscr{T}^{\ \lambda}\lt0$
and
 $B_{i,\lambda}'(\,p_i)\lt0$
, so
 $\Sigma\mathscr{T}^{\ \lambda} B_{i,\lambda}'(\,p_i) \gt 0$
. Moreover,
 $\eta_{\lambda}(\,p_i)\ge -2$
implies
 $\eta_{\lambda}(\,p_i) + 2 \ge 0$
. Hence,
 \begin{align*}\left(\frac{\partial}{\partial p_i}\Sigma\mathscr{T}^{\ \lambda}\right) B_{i,\lambda}(\,p_i)+ 2\,\Sigma\mathscr{T}^{\ \lambda} B_{i,\lambda}'(\,p_i)\ge 0.\end{align*}
Together with
 $Q_{i,\lambda}(\,p_i) B_{i,\lambda}''(\,p_i) \gt 0$
, this yields
 \begin{align*} E_{\lambda}'(\,p_i) \gt 0,\end{align*}
so
 $p_i\mapsto E_{\lambda}(\,p_i)$
is strictly increasing on
 $P_i$
.
Step 2: Sign pattern of
 $ O_{i,\lambda}'(\,p_i)$
. From (18), we have
 \begin{align*}A_{i,\lambda}(\,p_i) \gt 0\quad \Rightarrow\quad \operatorname{sign}\bigl( O_{i,\lambda}'(\,p_i)\bigr)= \operatorname{sign}\bigl(E_{\lambda}(\,p_i)\bigr).\end{align*}
Assumption (ii) states that there exists
 $p_i^{\ast}\in P_i$
such that
 $ O_{i,\lambda}'(\,p_i^{\ast})=0$
for both
 $\lambda=L,H$
. Thus,
 \begin{align*}E_{\lambda}(\,p_i^{\ast}) = 0\quad \text{for }\lambda\in\{L,H\}.\end{align*}
Since each
 $E_{\lambda}$
is strictly increasing in
 $p_i$
, this zero is unique, and we obtain
 \begin{align*}p_i \lt p_i^{\ast} \;\Rightarrow\; E_{\lambda}(\,p_i) \lt 0\;\Rightarrow\; O_{i,\lambda}'(\,p_i) \lt 0,\end{align*}
 \begin{align*}p_i = p_i^{\ast} \;\Rightarrow\; E_{\lambda}(\,p_i^{\ast}) = 0\;\Rightarrow\; O_{i,\lambda}'(\,p_i) = 0,\end{align*}
 \begin{align*}p_i \gt p_i^{\ast} \;\Rightarrow\; E_{\lambda}(\,p_i) \gt 0\;\Rightarrow\; O_{i,\lambda}'(\,p_i)\gt 0.\end{align*}
Thus, each
 $p_i\mapsto O_{i,\lambda}(\,p_i)$
is strictly decreasing on
 $[\underline p_i,p_i^{\ast})$
and strictly increasing on
 $(\,p_i^{\ast},p^U_i]$
.
Step 3: Quasi-convexity of the sum. For
 $p_i \lt p_i^{\ast}$
, we have
 $ O_{i,L}'(\,p_i)\lt0$
and
 $ O_{i,H}'(\,p_i)\lt0$
, hence
 \begin{align*} O_{i}'(\,p_i) = O_{i,L}'(\,p_i) + O_{i,H}'(\,p_i) \lt 0.\end{align*}
Similarly, for
 $p_i \gt p_i^{\ast}$
both derivatives are positive, so
 \begin{align*} O_{i}'(\,p_i) \gt 0,\end{align*}
and at
 $p_i^{\ast}$
we have
 \begin{align*} O_{i}'(\,p_i^{\ast})= O_{i,L}'(\,p_i^{\ast}) + O_{i,H}'(\,p_i^{\ast})= 0.\end{align*}
Therefore,
 $p_i\mapsto O_i(\,p_i)$
is strictly decreasing on
 $[\underline p_i,p_i^{\ast})$
and strictly increasing on
 $(\,p_i^{\ast},p^U_i]$
. A continuously differentiable function that is strictly decreasing up to a point and strictly increasing thereafter is strictly quasi-convex on its domain. Hence,
 $O_i(\cdot,p_{-i})$
is strictly quasi-convex on
 $P_i$
.
Proof of Theorem 1. By construction, the strategy space
 $P_i$
for each insurer is a nonempty, compact, and convex set. Moreover, the function
 $O_i$
is continuous. Under the two conditions in Lemma 4, the continuous cost function
 $O_i$
is quasi-convex over the feasible region. According to Theorem 1.2 in Fudenberg and Tirole (Reference Fudenberg and Tirole1991), there exists a pure-strategy Nash equilibrium.
Proof of Proposition 3. To derive the MGF of
 $ X^{(\lambda)} $
, we start with the definition of the MGF:
 \begin{align*}M_X^{(\lambda)}(s) = \mathbb{E}[e^{s X^{(\lambda)}}].\end{align*}
Using the law of total expectation, we can condition on the event that
 $ X^{(\lambda)} = 0 $
:
 \begin{align*}M_X^{(\lambda)}(s) = \mathbb{E}[e^{s X^{(\lambda)}} \mid X^{(\lambda)} = 0] \mathbb{P}(X^{(\lambda)} = 0) + \mathbb{E}[e^{s X^{(\lambda)}} \mid X^{(\lambda)} \gt 0] \mathbb{P}(X^{(\lambda)} \gt 0).\end{align*}
This simplifies to
 \begin{align*}M_X^{(\lambda)}(s) = \rho_{\lambda} + (1 - \rho_{\lambda}) \mathbb{E}[e^{s X^{(\lambda)}} \mid X^{(\lambda)} \gt 0].\end{align*}
Next, we need to evaluate
 $ \mathbb{E}[e^{s X^{(\lambda)}} \mid X^{(\lambda)} \gt 0] $
. Given that
 $ X^{(\lambda)} \mid \{X^{(\lambda)} \gt 0\} \sim \text{Exponential}(1/\mu_{\lambda}) $
, the expected value can be computed as follows:
 \begin{align*}\mathbb{E}[e^{s X^{(\lambda)}} \mid X^{(\lambda)} \gt 0] = \int_0^\infty e^{sx} \cdot \frac{1}{\mu_{\lambda}} e^{-x/\mu_{\lambda}} \, dx,\end{align*}
which is the integral of the exponential density multiplied by
 $ e^{sx} $
.
Calculating the integral:
 \begin{align*} \frac{1}{\mu_{\lambda}} \int_0^\infty e^{(s - 1/\mu_{\lambda})x} \, dx = \frac{1}{\mu_{\lambda}} \cdot \frac{1}{1/\mu_{\lambda} - s} \quad \left(s \lt \frac{1}{\mu_{\lambda}}\right),\end{align*}
yielding
 \begin{align*} \frac{1}{\mu_{\lambda} (1/\mu_{\lambda} - s)}.\end{align*}
Substituting this back into our expression for the MGF gives
 \begin{align*}M_X^{(\lambda)}(s) = \rho_{\lambda} + (1 - \rho_{\lambda}) \cdot \frac{1/\mu_{\lambda}}{1/\mu_{\lambda} - s} = \rho_{\lambda} + \frac{(1 - \rho_{\lambda})}{1 - \mu_{\lambda} s}.\end{align*}
Thus, the final result for the MGF is
 \begin{align*}M_X^{(\lambda)}(s) = \rho_{\lambda} + \frac{1 - \rho_{\lambda}}{1 - \mu_{\lambda} s}, \quad \text{for } s \lt \frac{1}{\mu_{\lambda}}.\end{align*}
This completes the proof.
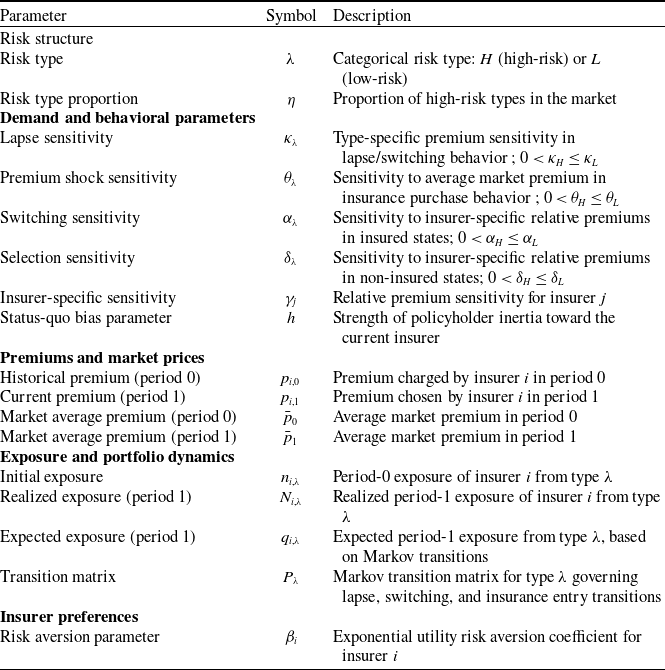
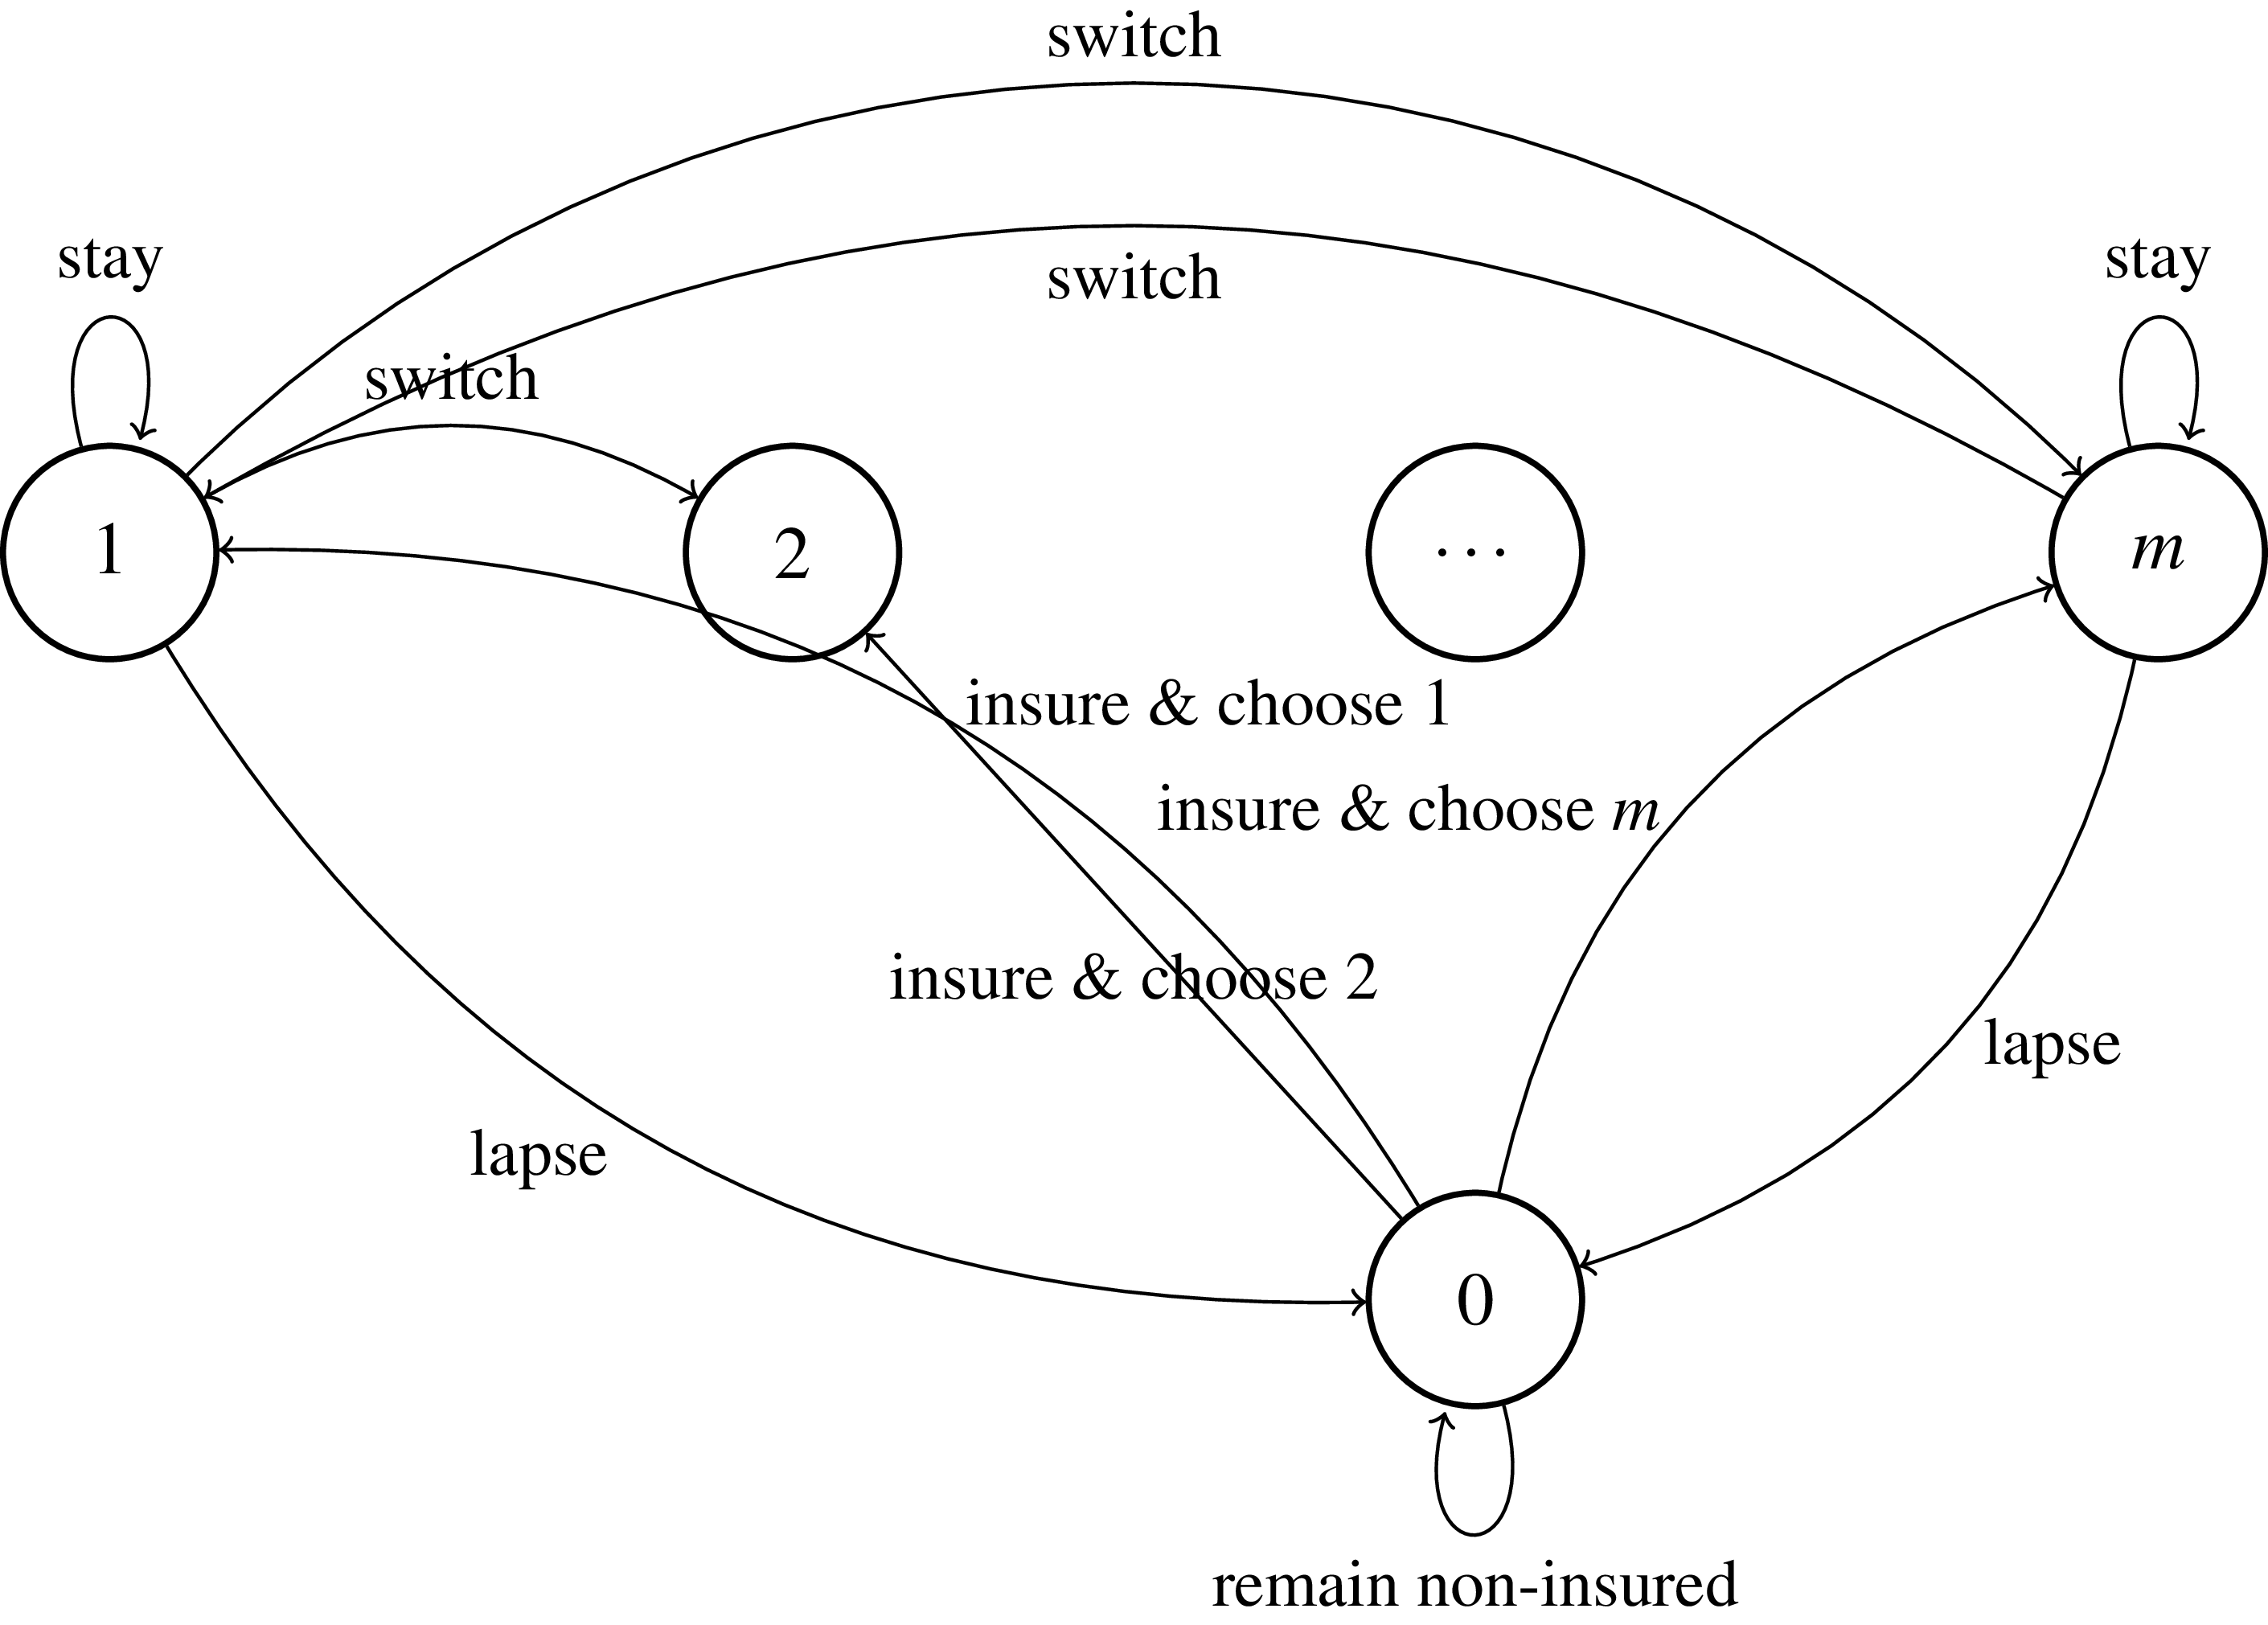
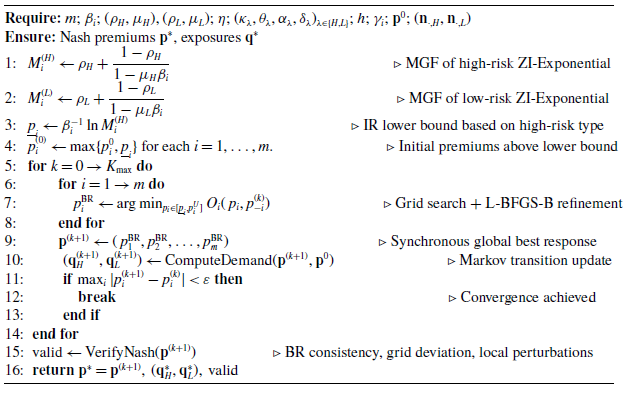
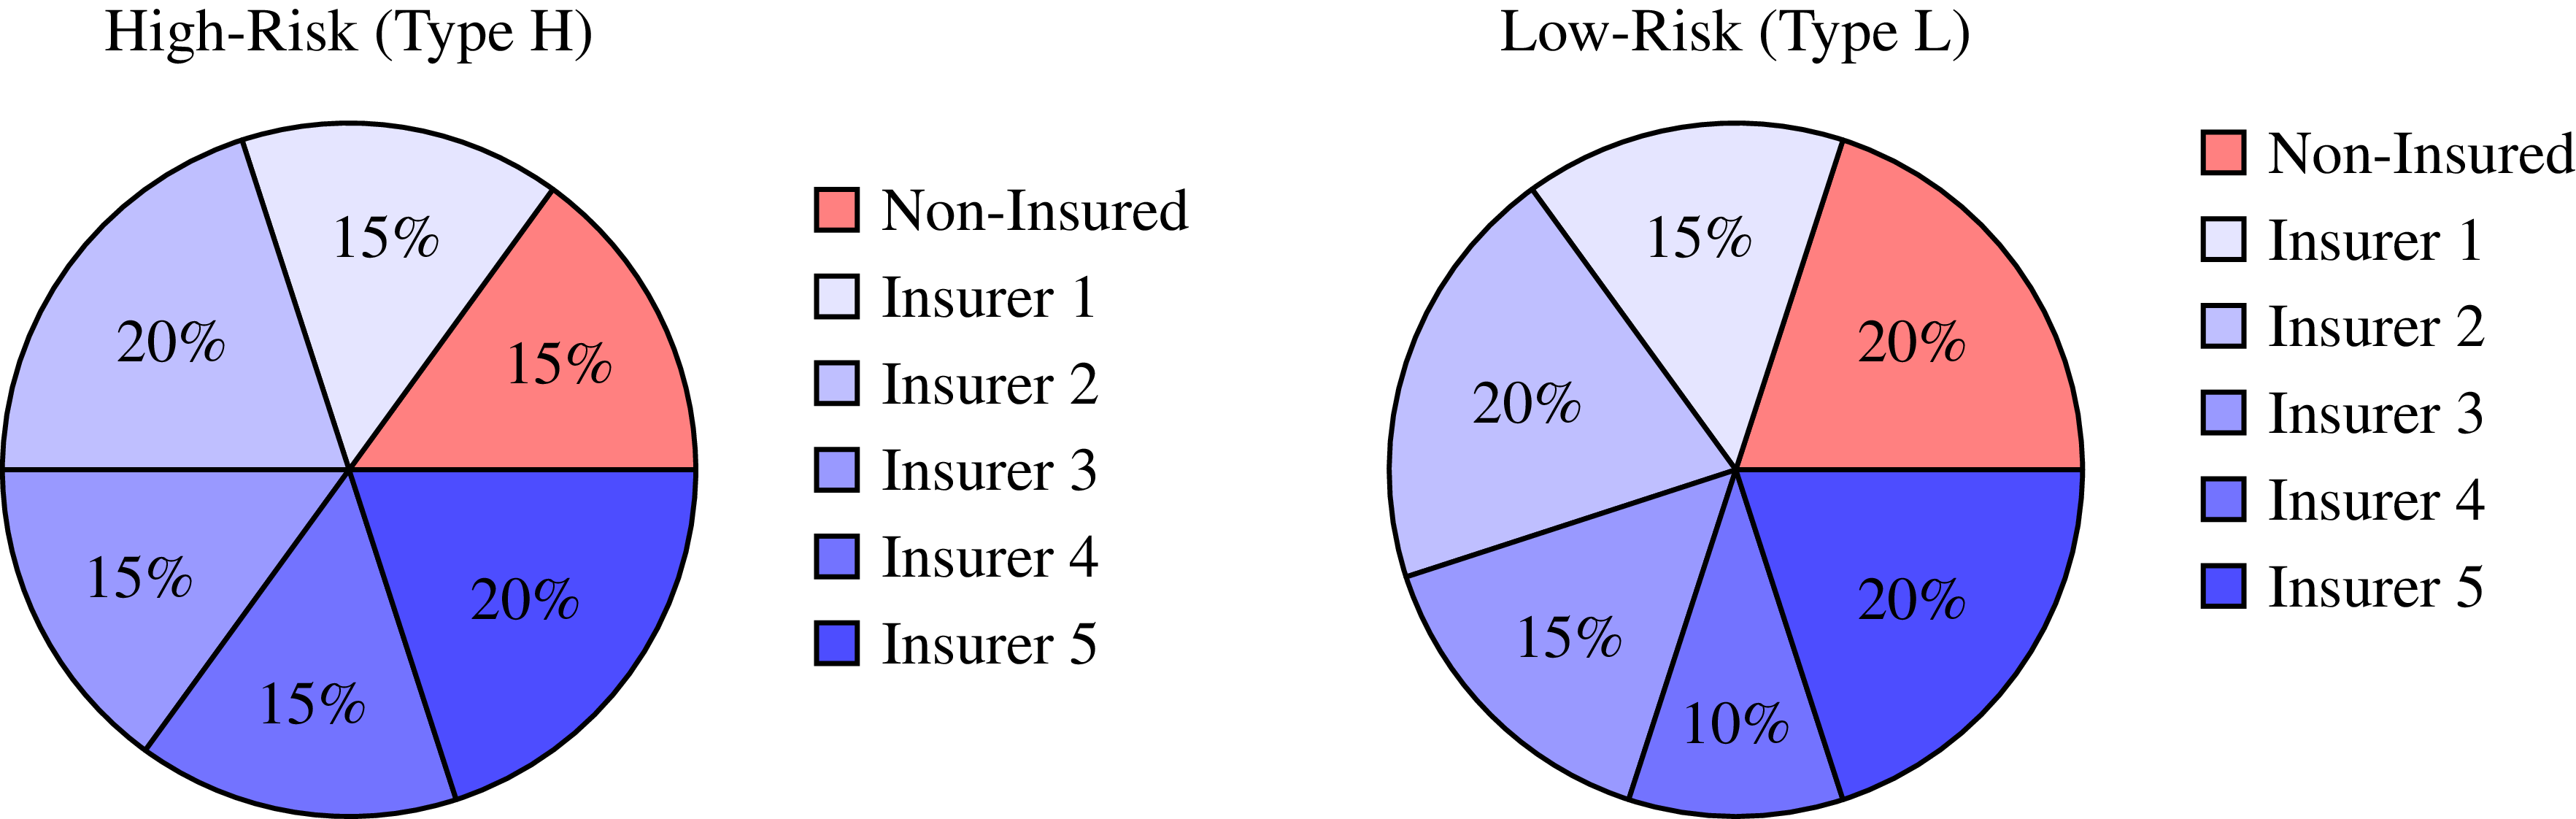
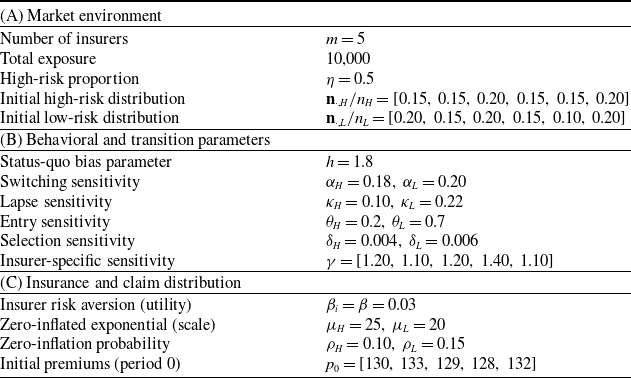

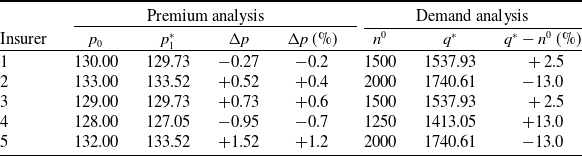
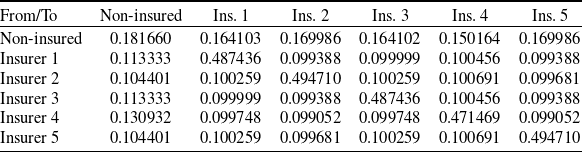
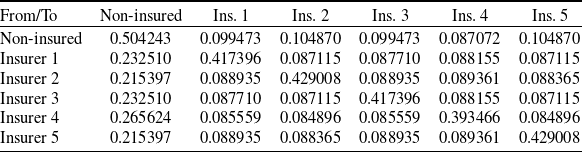

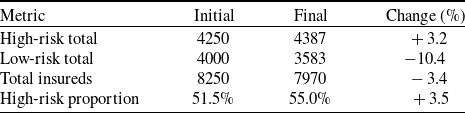
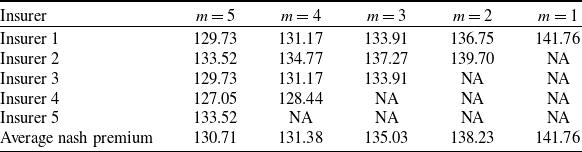
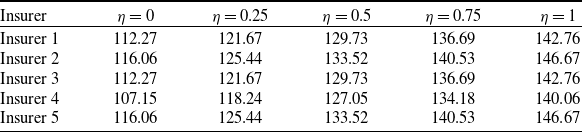
 η

 η
 β=0.03
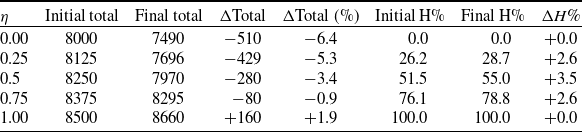

 β


 Open access

