
Introduction
Lithium-ion batteries (LIBs) have numerous consumer electronic devices and electric vehicle applications due to their high energy density. This high energy density results from LIB operating voltages of 3 V or higher and lithium's low mass.[Reference Scrosati, Abraham, van Schalkwijk and Hassoun1] The electrolyte in a LIB is a key component since it provides the pathway for the lithium cation's transport between the anode and the cathode during battery operation. While numerous lithium salts can be used in the electrolyte, lithium hexafluorphosphate, LiPF6, is the conventional salt due to its range of suitable properties. However, LiPF6 has safety problems due to its chemical dissociation equilibrium which produces LiF (lowering the charge transport) and PF5 (a safety risk due to its chemical reactivity with water) leading to its thermal and chemical instability.[Reference Aurbach, Schecter, Nazri and Pistoia2] The traditional carbonate solvents used as the liquid component of the electrolyte in LIBs are flammable, have high vapor pressures, and and are potentially toxic.[Reference Rossi and West3] In particular, linear carbonates, a frequent co-solvent, have a low flash point; one common linear carbonate diethyl carbonate's (DEC's) flash point is 25 °C.[4]
Organosilyl nitrile (OSN) solvents are attractive alternatives to the linear carbonates in electrolyte formulations for LIBs. In comparison to carbonates, organosilyl compounds generally have lower vapor pressures, higher flash points, and tolerate higher operating voltages.[Reference Peña Hueso, Osmalov, Dong, Usrey, Pollina and West5] The nitrile functional group acts as the polar moiety in the molecule and solvates the lithium cation, while the organosilyl fragment prevents thermal decomposition.[Reference Guillot, Peña Hueso, Usrey and Hamers6,Reference Chen, Usrey, Peña Hueso, West and Hamers7] There have been a number of reports recently on nitrile-based electrolytes for LIB applications. Ma and Mandal[Reference Ma and Mandal8] have reported on etheric nitriles/LiTFSI-based electrolytes, while Xie et al.[Reference Xie, Mai, Wang, Luo, Yan and Zhang9] have used the more conventional LiPF6 salt in etheric nitrile electrolytes. A dinitrile molecule, adiponitrile, has been used as the solvent in LiTFSI electrolytes by Farhat et al.[Reference Farhat, Ghamouss, Maiback, Edstrom and Lemordant10] Rohan et al.[Reference Rohan, Kuo, Lin, Hsu, Li and Lee11] have employed the strategy of mixing dinitrile and mononitrile molecules as the solvent in LiTFSI electrolytes. Combining functional groups into the same molecule has also been reported. Pohl et al.[Reference Pohl, Grunebaum, Drews, Passerini, Winter and Wiemhofer12,Reference Pohl and Wiemhofer13] and Horowitz et al.[Reference Horowitz, Ben-Barak, Schneier, Goor-Dar, Kasnatscheew, Meister, Grunebaum, Wiemhofer, Winter, Golodnitsky and Peled14] have used both a silyl and a polar nitrile functional group in the same molecule, while Wang et al.[Reference Wang, Yong, Yang, Ouyand and Zhang15] and separately Philip et al.[Reference Phillip, Bhandary, Groche, Schonhoff and Rieger16] have combined silyl and carbonate functional groups together in the same molecule for use as the electrolyte solvent.
We have employed fluorination of organosilyl compounds (abbreviated generally as FOS) to reduce solvent reaction and improve thermal stability.[Reference Peña Hueso, Dong, Pollina, Usrey, Hamers, West and Osmalov17,Reference Xu18] In comparison to linear carbonates, pure FOS solvents usually have a higher viscosity and lower dielectric permittivity, both properties which are detrimental to electrolyte performance. Recently, Ueda et al.[Reference Ueda, Yamada, Konno, Hoshino, Kojima and Tanaka19] have reported improvement of the solid electrolyte interface (SEI) layer formation on a graphite anode finding in their computational studies that organosilicon additives reduce the thickness of the SEI layer and consume less electrolyte as the SEI layer is formed. Therefore, the FOS molecules are most suitable as an electrolyte additive in commercial LIB electrolytes as they improve the thermal and chemical stability of the electrolyte while maintaining good ion transport performance.[Reference Lyons, Pena-Hueso, Johnson and West20] In this project, we explore the ion transport performance of the OSN electrolytes through variable temperature ionic conductivity measurements on a family of FOS electrolytes with varying salt content (LiPF6 or LiTFSI from 0.3 to 1.6 M), fluorine content of the FOS (none to 3), and blends of an FOS solvent with conventional carbonates ethylene carbonate (EC) and DEC in a ratio of 1:3. With both impedance ionic conductivities and NMR diffusion results, we also assess the dissociation of the salt in the electrolytes and to address the nature of ion/solvent interactions in these LIB electrolytes.
Experimental
Electrolytes
Organosilyl solvents and electrolytes were prepared as reported earlier[Reference Peña Hueso, Osmalov, Dong, Usrey, Pollina and West5] by Silatronix, Inc. (Madison, WI, USA). The OSN solvent molecules have the generic structure:
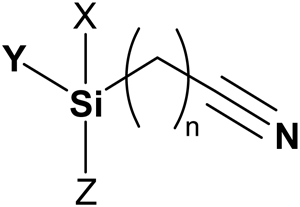
 $$X,Y,Z = {\rm alkyl},{\rm} F$$
 $$n = 1- 6$$
The electrochemical grade salt LiPF6 was purchased from Gotion and the LiTFSI from 3 M. The solvents EC and DEC were also electrochemical grade and purchased from SoulBrain. All solvents, salts, and electrolytes were handled in an argon dry box.
Electrochemical impedance spectroscopy measurements
Electrolyte solutions were transferred into a custom, o-ring sealed electrochemical cell (Supplementary Fig. S1) in the argon dry box. These electrochemical cells were designed with 1 cm2 stainless steel electrodes (A, the area of the electrode) separated by 0.5 cm (the length, l, dimension of the geometric factor); however, as each cell was uniquely constructed, the precise geometric factor was measured for each cell. The geometric factor, l/A, of each custom cell was measured using a traceable aqueous KCl conductivity standard solution (Fisher Scientific, Friendswood, TX, USA), and these values were l/A = 0.513 ± 0.002, 0.542 ± 0.004, or 0.496 ± 0.004 cm−1. Electrochemical impedance spectroscopy (EIS) equipment was either a Princeton Applied Research (PAR) model 273A potentiostat with a PAR Model 1025 frequency response detector or a PAR Model 263A potentiostat and 5210 lock-in amplifier. All data were measured and analyzed using PAR PowerSINE Software. Impedance measurements were taken over a frequency range of 100 kHz–100 mHz and temperatures from −10 to 55 °C as previously described[Reference Barth, Pen᷉a-Hueso, Zhou, Lyons and West21] leading to the measured resistance, R, of the electrolyte at each temperature. Using the following equation, ionic conductivities were calculated:
 $$\sigma = \displaystyle{1 \over R} \times \displaystyle{l \over A}$$
Ionic conductivities as a function of temperature fit the Vogel–Tamman–Fulcher (VTF) equation. Salt dissociation, α, was calculated using the relationship between the impedance molar conductivity, Λimpedance(ionic conductivity/salt concentration in mol/cm3), and the NMR measurements of the molar conductivity, ΛNMR(calculated with the Nernst–Einstein equation), which are reported in our parallel research letter[Reference Lyons, Beecher, Cunningham, Derrah, Su, Zhu, Usrey, Pen᷉a-Hueso, Johnson and West22]:
 $${\rm \alpha}= \displaystyle{{\Lambda _{{\rm Imp}}} \over {\Lambda _{{\rm NMR}}}}$$
Results and discussion
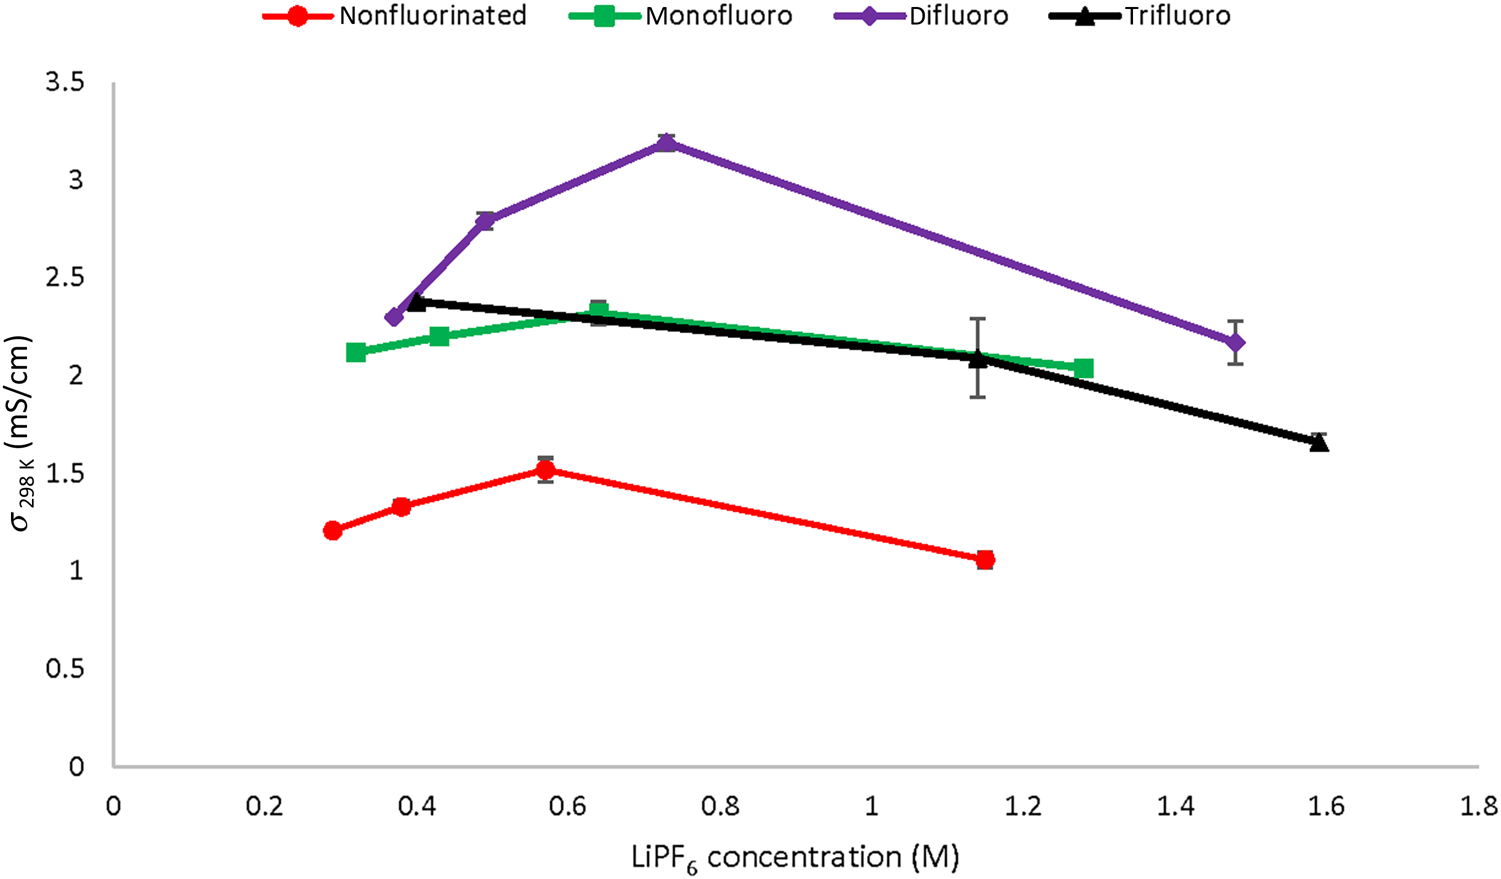
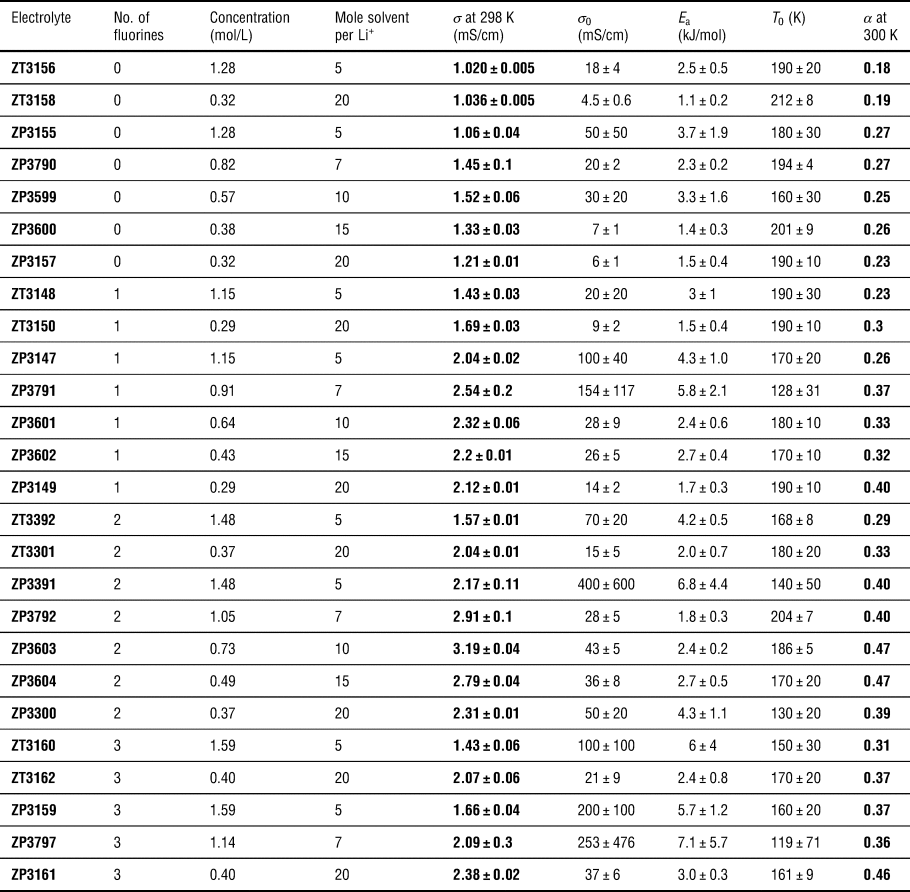
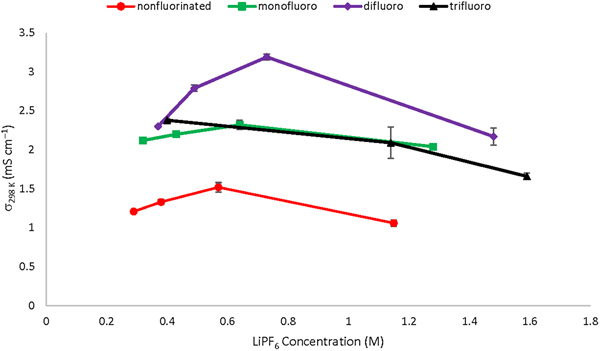
In Table I, we detail the ionic conductivities and VTF parameters for 26 electrolytes over the concentration of lithium salt from 0.3 to 1.6 M salt and in organosilyl solvents with none up to three fluorine substituents in the solvent molecule. Bode plots of the impedance data over the temperature range from −4.8 to 48.9 °C for the highest 298 K conductivity electrolyte ZP3603 (Supplementary Fig. S2) show the expected trend of decreasing impedance (and resistance) as the temperature increases. Arrhenius plots of LiPF6 electrolytes (Supplementary Figs. S3 and S4) demonstrate the characteristic curvature in the variable temperature ionic conductivity leading to the reported VTF fit parameters. Six of these electrolytes use the salt lithium bis(trifluorosulfonyl)imide, LiTFSI, instead of LiPF6. A number of trends are noteworthy. The ionic conductivities of all six of the LiTFSI electrolytes are lower than the LiPF6 salt-containing electrolyte at the same salt concentration. This difference increases with the fluorination of the organosilyl solvent. Among the LiPF6-containing electrolytes, both salt concentration and degree of fluorination of the solvent impact ionic conductivity. Figure 1 plots the ionic conductivities at 298 K as a function of LiPF6 concentration for all four solvent molecules ranging from no fluorine content to the trifluoro-solvent molecule. In the non-, mono-, and difluoro-solvents, the highest ionic conductivity is observed at salt concentrations between 0.6 and 1.0 M LiPF6. We see the typical “dome” shape of this plot, with ionic conductivity increasing with salt concentration to an optimum value and then decreasing as salt concentration continues to increase.[Reference Aurbach, Schecter, Nazri and Pistoia2] The highest ionic conductivity achieved among these electrolytes is 3.2 mS/cm at 298 K, well above the 1 mS/cm level necessary for electrolyte operation in a functioning LIB cell. We also generally see the highest activation energies, E a, at the optimum salt concentration for ionic conductivity in these family of electrolytes.
Plot of σ 298 K as a function of LiPF6 concentration for pure OSN solvents of increasing fluorination. Red has no fluorine; green has monofluoro; purple has difluoro; and black has trifluoro.

Ionic conductivities, VTF parameters, and salt dissociation values for OSN electrolytes.

The bold columns emphasize the key electrolyte identity (column 1), the ionic conductivity (sigma) at 298 K and the salt dissociation parameter alpha at 300 K (last column). An essential argument in the paper is that the trend in ionic conductivity is closely tied to the trend in the alpha values. So these two columns of data are in bold.
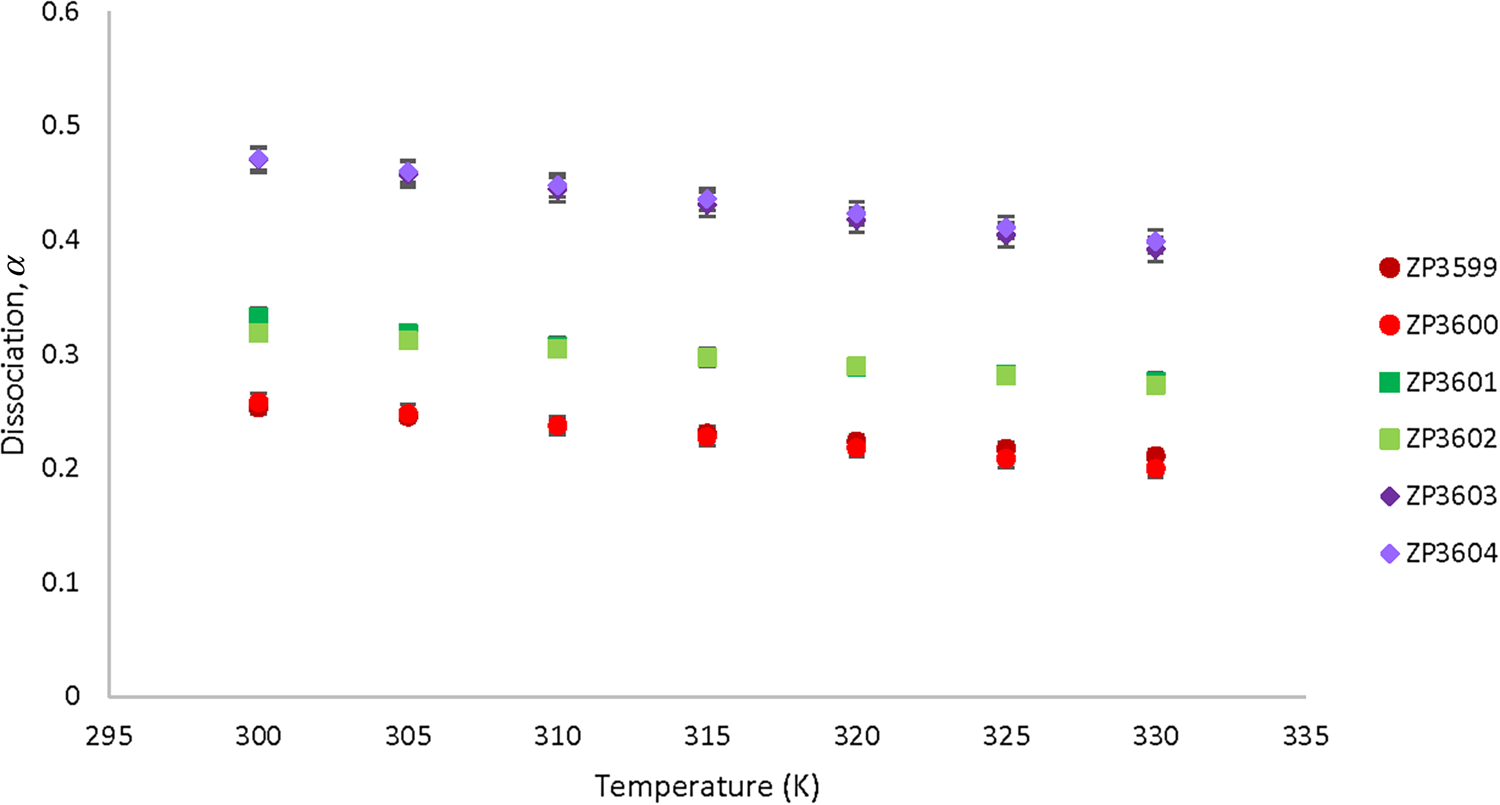
The ionic conductivity trends among these electrolytes can be explained by the salt dissociation parameter, α. The α parameter (also called ionicity or the reciprocal of the Haven ratio) permits us to differentiate charged ion transport from the overall motion of the lithium and anion species in the electrolyte and assess the extent of cation and anion dissociation in the solvent.[Reference Phillip, Bhandary, Groche, Schonhoff and Rieger16,Reference MacFarlane, Forsyth, Izgorodina, Abbott, Annat and Fraser23–Reference Nakanishi, Ueno, Watanabe, Ugata, Matsumae, Liu, Thomas, Dokko and Watanabe25] The molar conductivity from our impedance measurements is due to charged ion transport, while the NMR molar conductivity includes diffusion of all lithium and anion species, including neutral ion pairs or neutral ion aggregates in which the cation and anion are not dissociated from each other. An α equal to 1.0 corresponds to fully dissociated salts in the electrolyte solvent. In Table I, the α value ranges from 0.18 to 0.46, demonstrating that the majority of the salt exists in neutral ion pairs (or neutral ion aggregates) in these OSN solvents. In Fig. 2, we see that salt dissociation, α, in six electrolytes at the optimum ionic conductivities decreases slightly with temperature but increases significantly with the fluorination of the solvent. Supplementary Figure S5 shows similar trends for the four LiPF6 electrolytes with 7 moles of solvent per salt. Richardson et al. reported a similar temperature dependence (though they defined the salt in the solvent as ionic association and found that increased temperature increased association which would correspond to decreasing salt dissociation with increased temperature in our electrolytes).[Reference Richardson, Voice and Ward26] At the two salt concentrations plotted in Fig. 2 (15 moles of solvent per lithium cation and 10 moles of solvent per lithium cation) for each solvent, the α values are within our measurement errors. We see that adding fluorine to the organosilyl solvent increases the salt dissociation from 0.25 (nonfluoro) to 0.37 (monofluoro) and then 0.47 in the difluoro-solvent. As increasing salt dissociation leads to the charged species necessary for ionic conductivity, the highest ionic conductivity in the difluoro-solvent is closely tied to the highest salt dissociation in these same electrolytes. The lower ionic conductivity of the LiTFSI electrolytes can also be explained by the lower α values of these electrolytes. The difference generally increases with fluorination of the solvent reaching 0.11 for the LiPF6 electrolyte ZP3391 (difluoro, 1.48 M LiPF6) compared to the LiTFSI electrolyte ZT3392 (difluoro, 1.48 M LiTFSI).
Salt dissociation, α, for 15 mole solvent/salt and 10 mole solvent/salt electrolytes from 300 to 330 K for electrolytes of increasing fluorination; darker color more concentrated samples (0.6–0.7 M LiPF6) while lighter color is less concentrated (0.4–0.5 M). Red has no fluorine; green has monofluoro; and purple has difluoro.

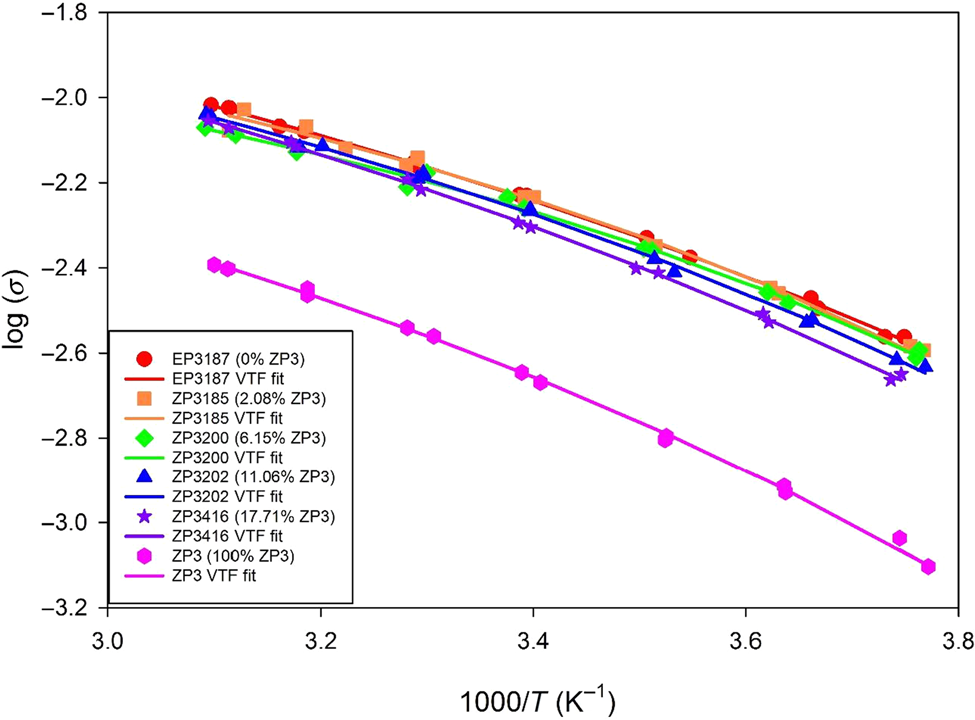
Seeking to replace the flammable carbonates in commercial electrolyte formulations, we then explored the ionic conductivities of solvent blends of the monofluorinated OSN solvent in typical EC/DEC solvent blends (Supplementary Table S1). Figure 3 shows the Arrhenius plots of four blends of the monofluorinated OSN solvent with a 1:3 volume proportion of EC/DEC and a 1.2 M LiPF6 concentration in comparison to the pure monofluorinated organosilyl electrolyte (ZP3) and the EC/DEC electrolyte with no organosilyl component (EP3187). The volume proportion of fluorinated organosilyl solvent varied from 2% to 18%. The pure EC/DEC electrolyte and the lowest volume proportion FOS electrolyte (ZP3185) have the same ionic conductivities over the measured temperature range. Ionic conductivities drop as the FOS proportion increases but these are small decreases in ionic conductivity. In the 18% FOS electrolyte (ZP3416), the ionic conductivity at 298 K is 5.5 mS/cm and double the ionic conductivity of the pure FOS electrolyte ZP3 at the same temperature. Supplementary Table S1 reports the VTF parameters for the variable temperature conductivity and the salt dissociation values at 300 K for each of these electrolytes. The salt dissociation value of 0.33 for the pure organosilyl electrolyte (ZP3) is lower than all the carbonate-containing electrolytes, which range from 0.40 to 0.45. The higher dielectric constant of EC is one driver of this higher salt dissociation value and the higher ionic conductivities of the carbonate-containing electrolytes, similar to results reported by Hayamizu for EC/DEC electrolyte blends.[Reference Hayamizu24]
Arrhenius plots of conductivity versus reciprocal temperature with VTF fits of OSN/carbonate electrolyte samples from 263 to 323 K. Markers represent actual measured values, while lines represent VTF regression data. All electrolytes contained 1.2 M LiPF6 and a 1:3 EC:DEC ratio with increasing amounts of the FOS solvent ZP3 from 2% up to 17.7%.

Conclusion
Electrolytes based on OSN solvents have very good ionic conductivities and improved battery performance. We have varied the fluorination of the solvents and find that increasing the fluorination of the solvent from none to monofluoro and difluoro improves ionic conductivity. At the optimum LiPF6 concentration of 0.7 M in the difluoro-solvent, we achieve an ionic conductivity at 298 K of 3.2 mS/cm. Across all the OSN solvents, we find the optimum salt concentration for the highest ionic conductivity from 0.6 to 0.1.0 M. Increasing ionic conductivity is closely tied to the salt dissociation of the electrolytes. Salt dissociation increases with the fluorination of the solvent. Electrolytes with blends of the monofluoro-solvent molecule (FOS) and the carbonates EC and DEC have improved ionic conductivities and at low volume proportions of FOS (2%) are equivalent in conductivity to the all carbonate electrolyte.
Supplementary material
The supplementary material for this article can be found at https://doi.org/10.1557/mrc.2019.131.
Acknowledgment
The project was funded by the Grinnell College MAP program. NSF-MRI (Grant No. 0116159) funded the impedance equipment.