Introduction
The conversion of thermal waste energy into electrical energy makes thermionic electron emission (TEE) a promising renewable energy source. Contrary to the field electron emission behavior, in which the emitted electrons are extracted from the materials due to band bending induced by an external applied field, TEE implies the heat-induced emission of charge carriers over a surface-potential barrier typically into vacuum space.[Reference Schwede, Bargatin, Riley, Hardin, Rosenthal, Sun, Schmitt, Pianetta, Howe, Shen and Melosh1–Reference Khalid, Leong and Mohamed4] The TEE is usually modeled by Richardson–Dushman (R–D) theory: J TEE = A R × T 2 exp [−(φ − 3.79E 1/2)/k BT], where J TEE is the TEE current density in units of A/cm2, A R is the Richardson constant (in units of A/cm2 K2), T is the temperature (in units of K), φ is the work function of the emitter (in units of eV), and k B is the Boltzmann constant (k B = 1.38 × 10⁻²³ J/K).[Reference Khalid, Leong and Mohamed4] Among these TEE parameters, the φ and A R are the two most important materials' characteristics, which influence the J TEE-value. Tables SI and SII of the Supplementary information show, respectively, the φ and the A R values of the refractory metals, nano-carbon materials, and doped diamond, respectively, which are the commonly used cathode materials.
Apparently, high-temperature operability is a prime important characteristic needed for the materials to be served as cathode for a TEE device. In the early development of the TEE devices, refractory metals such as tungsten, molybdenum, and rhenium are the materials of choice due to their high-temperature stability. However, these refractory metals possess large work function (4–5 eV) (Table SI of the Supplementary information) and thereafter can attain large J TEE value only at a temperature higher than 1000 °C that limits the potential of these materials for practical device applications. Coating low work function metals such as cesium on refractory metal lowered effectively the work function of 1.36 eV of the emitting surface (Table SI of the Supplementary information). However, the cesium coating is not stable, as it is vaporized easily at high temperature, rendering the devices not so reliable. Coating a nitrogen-doped nanocrystalline diamond films (N-DFs) on the refractory metals can also effectively lower the work function of the tungsten (or molybdenum) materials but the Richardson constant is markedly reduced [(A R)Cs/W = 0.69–1.69 A/cm2 K2] (Table SI of the Supplementary information) that, in turn, reduced significantly the J TEE-values attainable for the TEE devices. Similarly, nanocarbon materials [such as carbon nanotubes (CNTs), carbon nanoflakes and graphene] also possess high-temperature stability with large Richardson constant [(A R)CNTs = 228 A/cm2 K2] (Table SI of the Supplementary information), which has great potential for inducing large J TEE-value, but the large φ value of 4.54 eV of the materials increases appreciably the operation temperature necessary for the TEE devices.
Diamond materials are another category of wide band gap materials, which can survive high-temperature operation and have great potential for serving as cathode for TEE devices. Moreover, the φ value of the diamond materials can be lowered effectively via the incorporation of n-type donors, such as phosphorus, sulfur, and nitrogen (Table SII of the Supplementary information). However, TEE measurements of these donor-doped diamond materials reveal that the A R values of diamond materials vary inconsistently, implying that the electron transport to the surface of the diamond materials is a major issue that needs further improvement. While the lowering on the work function due to donor doping has been well studied, how to enlarge the Richardson constant of the diamond materials remains unclear.
In this context, vertically aligned nitrogen-doped nanocrystalline diamond nanorods (N-DNRs) are fabricated from N-DFs by O2 plasma-based reactive ion etching (RIE) process for enhancing the TEE properties. The N-DNRs display a work function of φ = 4.5 eV and a large Richardson constant of A R = 18.0 A/cm2 K2, which lead to a high TEE current density of 12.0 mA/cm2 with an applied voltage of 3 V at 923 K. The enhanced TEE properties of N-DNRs are ascribed to the induction of abundant nanographitic phases at the grain boundaries and the field penetration effect through the local field enhancement from nanorods owing to a high aspect ratio and an excellent field enhancement factor.
Methods
Fabrication of vertically aligned DNRs
The fabrication process of vertically aligned nanorods started with the growth of N-DFs on Si substrates. First, the (100)-oriented mirror polished n-type silicon (Si) substrates (1 cm × 1 cm) were cleaned with standard RCA-1 and RCA-2 procedures.[Reference Kern and Puotinen5] The cleaned Si substrates were then seeded with a water-based state-of-the-art colloidal suspension of 5 nm nanodiamond (ND) particles by spin coating.[Reference Williams, Douheret, Daenen, Haenen, Osawa and Takahashi6] Second, two types of DFs of 500 nm thick were grown on the seeded Si substrates in an ASTeX 6500 series microwave plasma-enhanced chemical vapor deposition (MWPECVD) system. To grow undoped-nanocrystalline diamond films (U-DFs), a gas mixture of CH4 and H2 with flow rates of 3 and 297 sccm (CH4/H2 = 1/99), respectively, was excited by 3000 W microwave power and at a total pressure of 30 Torr. The substrates were heated by bombardment of the plasma species, and the substrate temperature during the growth of U-DFs was around 650 °C measured using a single-color optical pyrometer, assuming an optical emission coefficient of 0.3. For the growth of N-DFs, a gas mixture of CH4, H2, and N2 with flow rates of 18, 267, and 15 sccm (CH4/H2/N2 = 6/89/5), respectively, was excited by 3000 W microwave power, and the total pressure in the chamber was retained at 30 Torr. The substrate temperature during the growth of N-DFs was assessed to be around 540 °C.
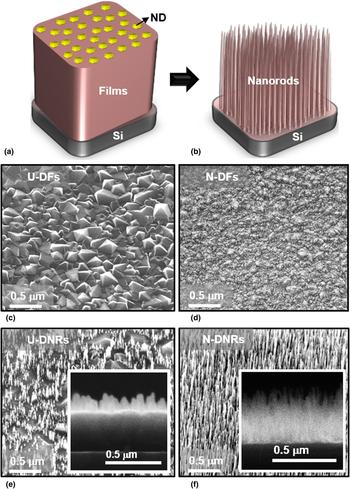
To fabricate the nanorods from the U-DFs and N-DFs, the pristine DFs were immersed in the water-based colloidal suspension of ND particles and sonicated for 10 min to adhere these nanoparticles onto the film surface [Fig. 1(a)]. The process for making ND particles suspension was reported elsewhere.[Reference Williams, Douheret, Daenen, Haenen, Osawa and Takahashi6] The number density and uniformity of these adhered ND particles depend upon the suspension characteristics and sonication time.[Reference Tian, Li, Xia, Gu and Li7] After drying, the films coated with ND particles were put into the RIE system for the fabrication of vertically aligned undoped-diamond nanorods (U-DNRs) and N-DNRs. The ND particles adhered on the surface of the film act as a hard mask for the etching process. RIE of DFs was performed using O2 plasma (50 sccm) in a home-built DC-plasma system with a power of 150 W [Fig. 1(b)].[Reference Deshmukh, Sankaran, Srinivasu, Korneychuk, Banerjee, Barman, Bhattacharya, Phase, Gupta, Verbeeck, Leou, Lin, Haenen and Roy8] The etching time was varied from 5 to 25 min and the gas pressure was kept at 2.8 mbar. The morphology of the nanorods mainly depends on the size and etching rate of ND particles, whereas the density of the nanorods could be controlled by varying the etching condition, i.e., O2 flow rate and DC power.
Schematics representation of the fabrication process of DNRs: (a) masking of the DFs with ND particles and (b) O2 plasma-based reactive ion etching for forming DNRs. Plan-view SEM micrographs of (c) U-DFs and (d) N-DFs. (e) Tilt-view SEM micrograph of U-DNRs, along with the cross-sectional SEM micrograph as inset. (f) Tilt-view SEM micrograph of N-DNRs along with the cross-sectional SEM micrograph of N-DNRs as inset.

Morphologic and structural characterization
The morphology of the diamond materials was characterized using scanning electron microscopy (SEM; a FEI Quanta 200 FEG microscope). The cross-sectional-view microstructure of the N-DNRs was analyzed using an FEI Titan “cubed” microscope operated at 300 kV for annular dark-field-scanning transmission electron microscopy (ADF-STEM) with the convergence semi-angle α used was 22 mrad and collection semi-angles of the ADF detector laying in the range from 26 to 60 mrad. Spatially resolved STEM-electron energy loss spectroscopy (EELS) mapping was carried out making use of Gatan Enfinium EELS spectrometer integrated in the Titan microscope with a collection semi-angle β = 36 mrad.[Reference Dato, Radmilovic, Lee, Philips and Frenklach9]
TEE measurements
TEE measurements were conducted in an ultra-high-vacuum system with a base pressure of 10−10 Torr, which contains a radiatively heated stage with a thermocoax cable (Philips Electronics) that can reach temperatures up to 1000 K. The heater temperature is controlled by a Eurotherm PID device, which monitors the read-out from a type K thermocouple. A circular sample (films or nanorods on Si substrates) of 2 cm in diameter was placed on the heated sample stage as emitter. The samples were exposed to a hydrogen plasma (300 sccm, 2500 W, 20 Torr, 5 min) in the MWPECVD system for H2-termination before being transferred into the vacuum chamber. A water-cooled polished molybdenum disc (2.0 cm in diameter) was used as a collector. The collector and emitter were separated by an alumina spacer of about 150 µm thick. TEE current versus applied voltage characteristics were acquired by a Keithley 2400 source-measurement unit. Typically, several measurement cycles between 300 and 973 K at various applied voltages were performed to create a stable emitter surface and to evaluate the emission current as a function of temperature and applied voltages. The application of voltages to the substrate is to overcome the space-charge effects.
Results
Figures 1(e) and 1(f) display, respectively, the tilt-view SEM images of U-DNRs and N-DNRs fabricated from U-DFs and N-DFs, whereas Figs 1(c) and 1(d) of the corresponding figures show the plan-view SEM images of DFs. The plan-view SEM micrographs of U-DFs [Fig. 1(c)] indicates that these films contain faceted diamond grains of sizes around ~0.4 µm, whereas the TEM micrograph in Fig. S1 of the Supplementary information reveals that the U-DFs contain very sharp grain boundaries of negligible thickness. A drastic change in surface morphology from micrometer-sized grains to nano-sized diamond grains were observed when nitrogen is incorporated into CH4/H2 plasma during growth process. The plan-view SEM image shown in Fig. 1(d) demonstrates that the N-DFs have a nano-sized equi-axed granular structure of size ~50 nm with a very smooth surface. The TEM characteristics of N-DFs illustrated in Fig. S2 of the Supplementary information reveals that the N-DFs contain the nano-sized grains of diamond with the abundant amorphous carbon (a-C) grain boundaries. These U-DFs and N-DFs were selected as the samples for the fabrication of DNRs by the O2 plasma-based RIE process.
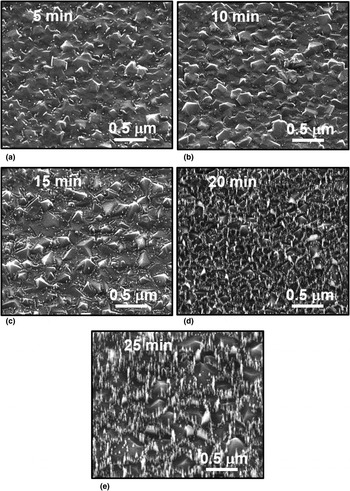
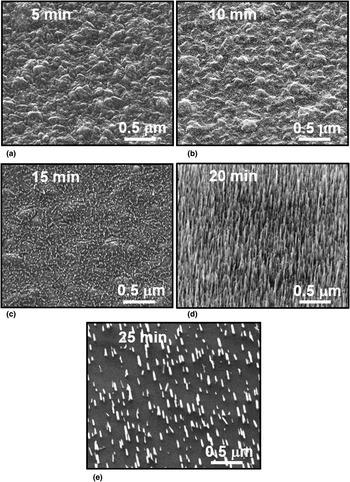
The fabrication of nanostructures from DFs is a very difficult task because these materials are extremely hard and chemically inert. After lots of experimentations, we finally succeeded in fabricating DNRs from DFs by using ND particles as a mask in a RIE process (in O2 plasma). The tilt-view SEM images of U-DFs etched at different durations of 5–25 min (Fig. 2) reveal that the etching rate of U-DFs is also very slow, which is comparable with that of ND particles, such that the ND particles cannot act as the etching mask for preferentially etching of the unmasked region of U-DFs. The U-DNRs prepared via the RIE of U-DFs sparsely distributed on the samples [Fig. 1(e)]. The U-DNRs were about 90 nm in height and 100 nm in diameter [inset of Fig. 1(e)]. In contrast, Fig. 3 shows tilt-view SEM images of N-DFs after different etching durations (5–25 min), revealing that the RIE etched the DFs in a markedly larger rate than that on the ND particles. The ND particles protected very well the masked regions of N-DFs and the unmasked regions were etched gradually in a controlled manner. The morphology of N-DNRs was optimized at an etching duration of 20 min [Fig. 1(f)]. The N-DNRs were formed with very high distribution densities. These nanorods were approximately 300 nm in height and about 50 nm in diameter [inset of Fig. 1(f)]. Increasing the etching time to 25 min consumed most of ND particles such that the etching of nanorods was initiated and the nanorods become sparser than those etched for 20 min etched samples [Fig. 3(e)]. These results reveal the importance of the microstructure of the pristine DFs in the fabrication of diamond nanostructures. The etching of U-DFs is extremely difficult, since these films contain sharp grain boundaries. In contrast, the N-DFs contain large proportion of relative thick grain boundaries containing a-C, which facilitate the etching of DFs.
SEM images of the U-DF surface after RIE etching for different etching times of (a) 5 min, (b) 10 min, (c) 15 min, (d) 20 min, and (e) 25 min.

SEM images of the N-DF surface after RIE etching for different etching times of (a) 5 min, (b) 10 min, (c) 15 min, (d) 20 min, and (e) 25 min.

Based on these observations, a mechanism is proposed for the formation of DNRs from DFs. The N-DFs contain ND grains separated by the grain boundaries (see Fig. S2 of the Supplementary information). A large proportion of a-C phases exist in the grain boundaries, which is more susceptible to O2 plasma etching than the diamond grains. At the early stage of the etching process, ND particles sitting on top of the films mask the N-DFs from being ion bombardment etched. The chemical etching of oxygen ions starts from the grain boundaries of non-masked region of the N-DFs. Because of the ease of etching the a-C located at the boundaries of N-DF grains, an etching path for shaping the nanorods is created, resulting in vertically aligned nanorods.[Reference Kunuku, Sankaran, Tsai, Chang, Tai, Leou and Lin10, Reference Zhang, Wu, Cha, Wong, Meng, Bello, Lifshitz and Lee11] The etching process was stopped once the masking ND particles were also etched away by the O2 plasma so as to prevent the plasma damage on the formed nanorods. The optimum etching time was determined by trial and error process. Such a technique is similar to Yang et al.’s process,[Reference Yang, Hiroshi, Williams, Osawa, Tokuda and Nebel12] which utilized ND particles as a mask in a RIE process for fabricating the DNRs from ultrananocrystalline DFs. In case of U-DFs, the diamond grains are larger and there is essentially no grain boundary phase that hinders the formation of DNRs. It occurred frequently that the masked ND particles were etched away by the O2 plasma before initiating the formation of nanorods in U-DFs. Therefore, the fabricated U-NDRs are not as densely populated and distributed less uniformly compared with N-DNRs made from N-DFs [see Figs. 1(e) and 1(f)].
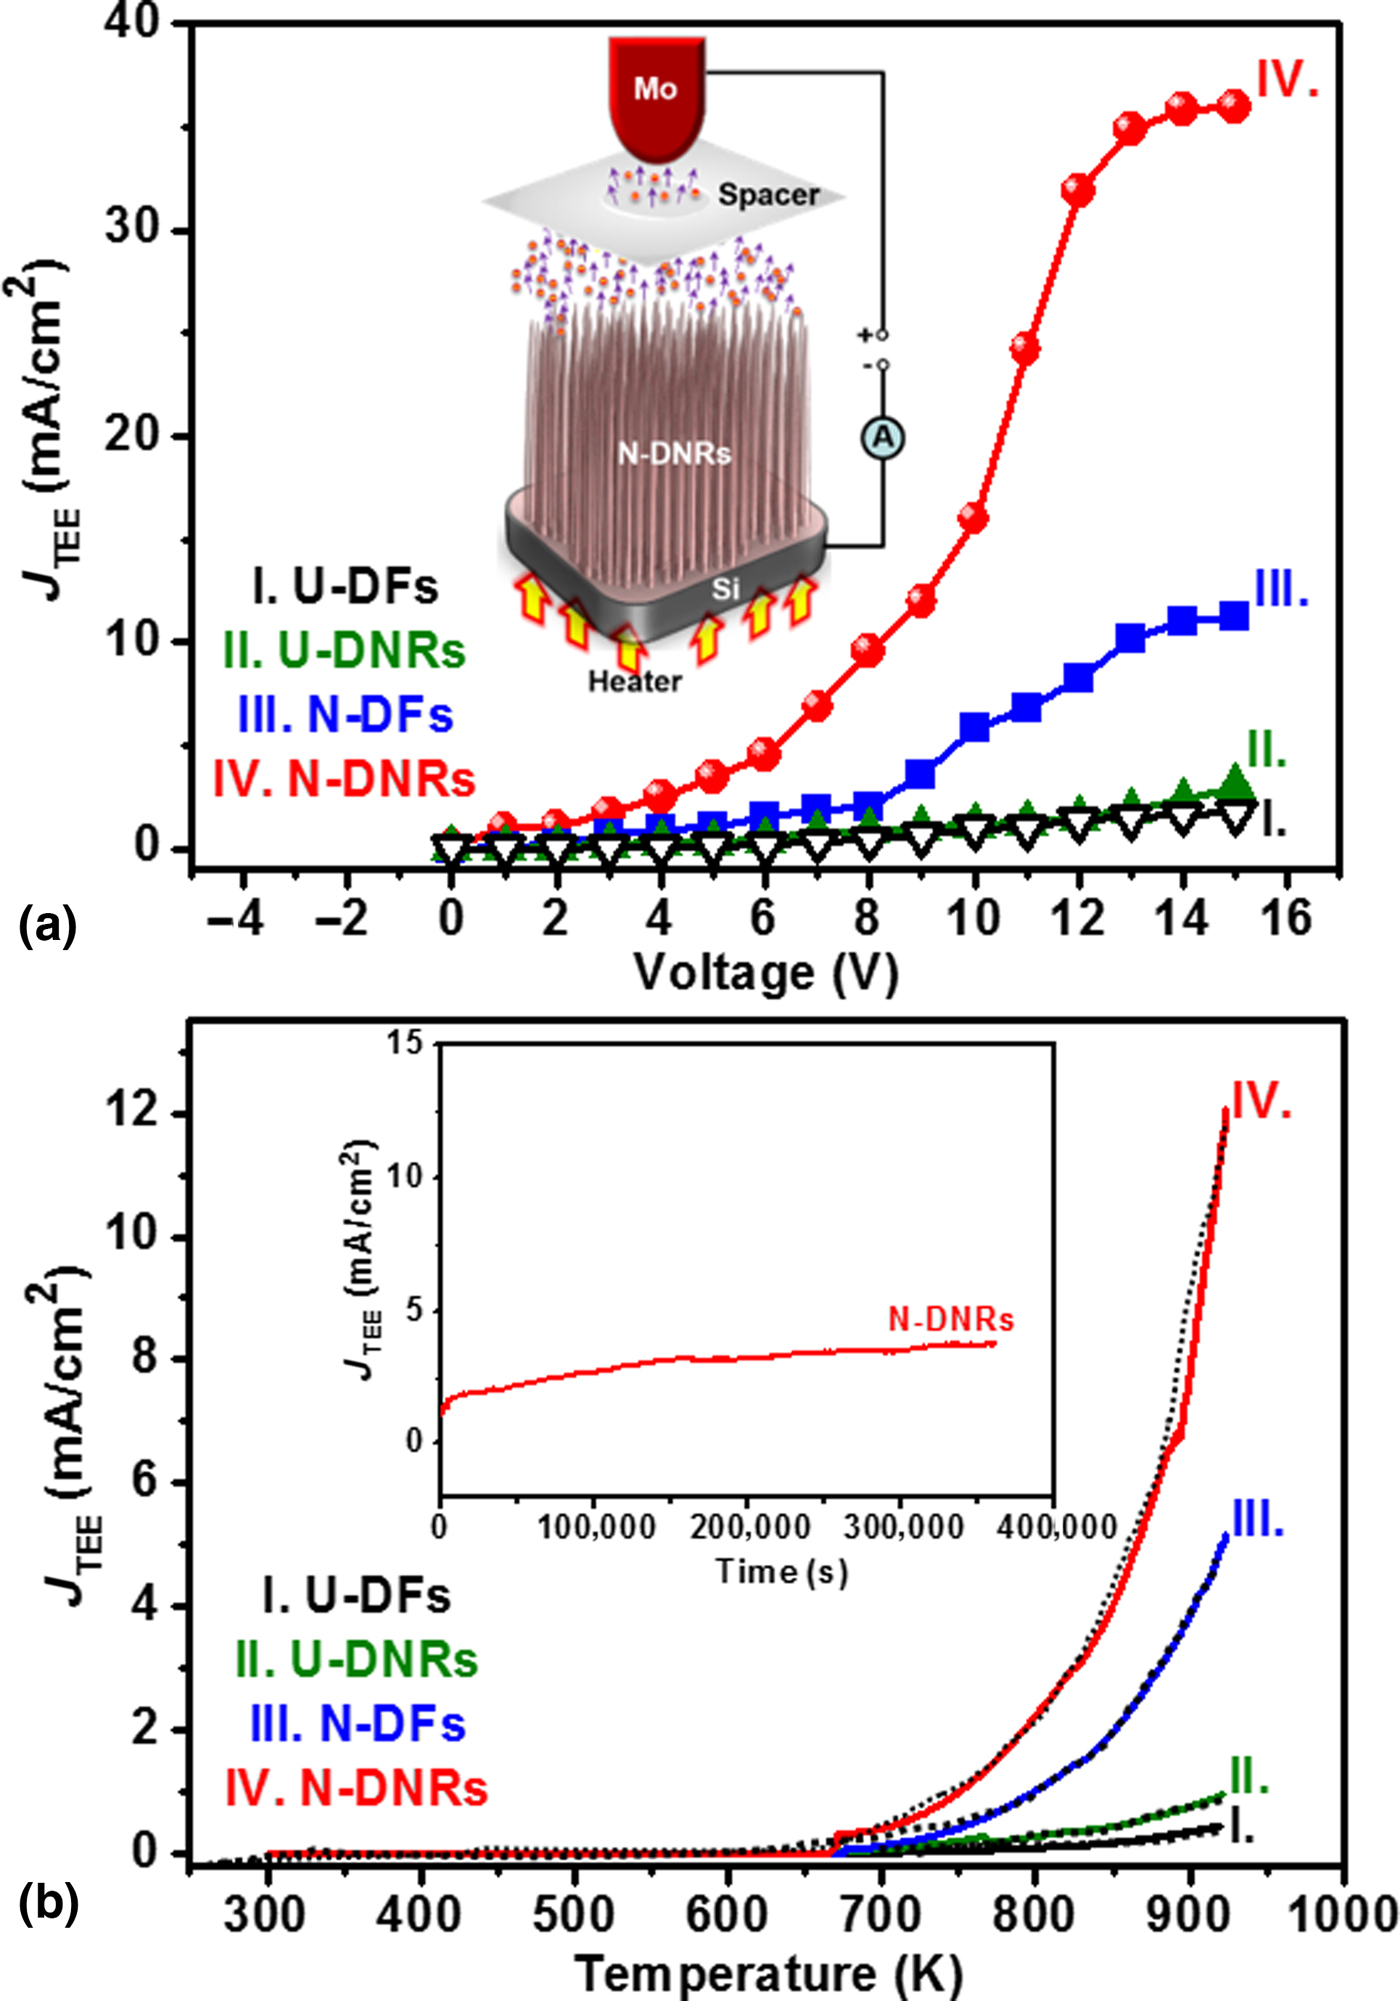
Figure 4 shows the thermionic emission behavior for these diamond materials. The schematic representation of a TEE measurement is shown in the inset of Fig. 4(a). Figure 4(a) shows the J TEE versus applied voltage characteristics at 773 K for DFs and DNRs. At 0 V, no electron emission is observed and after 2 V of applied voltage, the J TEE starts increasing with applied voltage and tends to saturate at 15 V. In this temperature range, the electron emission from the opposite anode metal can be ignored and the emission current can be assumed to originate from the thermionic emission of the diamond cathode. The saturated J TEE of the N-DNRs is approximately 35 mA/cm2 at the applied voltage of 15 V [curve IV of Fig. 4(a)], which is significantly larger than the J TEE for the N-DFs [(J TEE)N-DF = 10 mA/cm2, curve III of Fig. 4(a)]. It is to be noted that, the J TEE value attained for N-DNRs is higher than that of stacked phosphorus and nitrogen-doped DFs (18 mA/cm2)[Reference Kataoka, Morioka, Kimura, Sobue, Kato, Takeuchi and Yamasaki13] and barium strontium oxide-coated CNTs (15 mA/cm2),[Reference Jin, Liu and Day14] which are the two best TEE characteristics reported in the literature. In contrast, U-DFs and U-DNRs show lower saturated J TEE values of 1.85 mA/cm2 [curve I of Fig. 4(a)] and 2.94 mA/cm2 [curve II of Fig. 4(a)] at the applied voltage of 15 V, respectively. The J TEE versus applied voltage characteristics at different measuring temperatures (figure not shown) show similar trend with those shown in Fig. 4(a), viz., the J TEE increases with applied voltage and saturates at around an applied voltage of 15 V.
(a) Thermionic electron emission current density (J TEE) as a function of voltage at 773 K and (b) the J TEE versus temperature curves attained at an applied voltage of 3 V, fitted by the Richardson–Dushman equation, for (I) U-DFs, (II) U-DNRs, (III) N-DFs, and (IV) N-DNRs. The inset in “(a)” shows a TEE measurement setup, whereas the inset in “(b)” shows the life-time measurements, i.e., the J TEE versus time curves, of N-DNRs, where the life-time measurements were carried out with a constant temperature of 773 K at an applied voltage of 3 V.

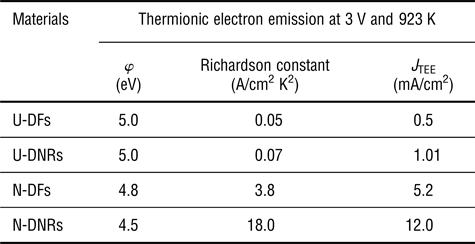
Moreover, the J TEE values for these samples at applied voltage of 3 V were plotted against the measuring temperature in Fig. 4(b), indicating that the TEE process for these materials starts at a temperature as low as 670 K and increases monotonically with temperature. The J TEE obtained at the temperature of 923 K is 12.0 mA/cm2 [curve IV of Fig. 4(b)] and 5.2 mA/cm2 [curve III of Fig. 4(b)] for the N-DNRs and N-DFs, respectively. But U-DFs and U-DNRs exhibit markedly lower J TEE-values of 0.5 mA/cm2 [curve I of Fig. 4(b)] and 1.01 mA/cm2 [curve II of Fig. 4(b)] at the temperature of 923 K. These J TEE versus T curves were fitted with the R–D equation and the φ, and the A R values of these diamond samples were estimated (summarized in Table I). The N-DNRs possess the φ value of 4.5 eV with Richardson constant of (A R)N-DNRs = 18.0 A/cm2 K2, whereas the N-DFs show a similar φ-value of 4.8 eV with a smaller Richardson constant of (A R)N-DF = 3.8 A/cm2 K2. Moreover, both U-DFs and U-DNRs own the same φ-value of around 5.0 eV, respectively, and Richardson constant of A R = 0.05–0.07 A/cm2 K2, which are smaller as compared with those of N-DF and N-DNRs. This reveals that the RIE etching process insignificantly alters the φ-value but markedly increases the Richardson constant of N-DF series materials. It does not significantly alter these TEE parameters of the U-DF series materials. That is, only when the DFs possess good conductivity, the RIE nanostructuring process can increase the Richardson constant value of the materials. The TEE parameters listed in Table I reveal that the main factor, which leads to larger TEE current density for N-DNRs due to RIE process, is mainly owing to the increase in the value of Richardson constant. The value of work function is less significantly affected due to the nanostructuring process. Generally a proper doping is required to lower the φ-value of the diamond materials. Furthermore, to verify the accuracy of the work function value estimated from TEE measurements, Kelvin probe force microscopy (KPFM) measurements (Fig. S3 of the Supplementary information) were utilized to locally estimate the work function value of the N-DNRs. The estimated work function value for N-DNRs from KPFM was ~4.65 eV, which is close to the work function value (4.5 eV) of N-DNRs calculated using R–D equation. Furthermore, the stability of the TEE from N-DNRs was evaluated by monitoring the current over a long period of time with a constant temperature of 773 K at an applied voltage of 3 V. The inset of Fig. 4(b) reveals that the J TEE of 1.25 mA/cm2 is upheld for a period over 360,000 s (6000 min) without the sign of degradation, showing high life-time stability in TEE behavior for N-DNRs.
Thermionic electron emission of U-DFs and N-DFs and their nanorods (U-DNRs and N-DNRs) at 3 V and 923 K.

J TEE: the TEE current density evaluated at the designated applied voltage and temperature.
φ: the TEE-based work function deduced from Richardson–Dushman model.
A R: the Richardson constant deduced from Richardson–Dushman model.
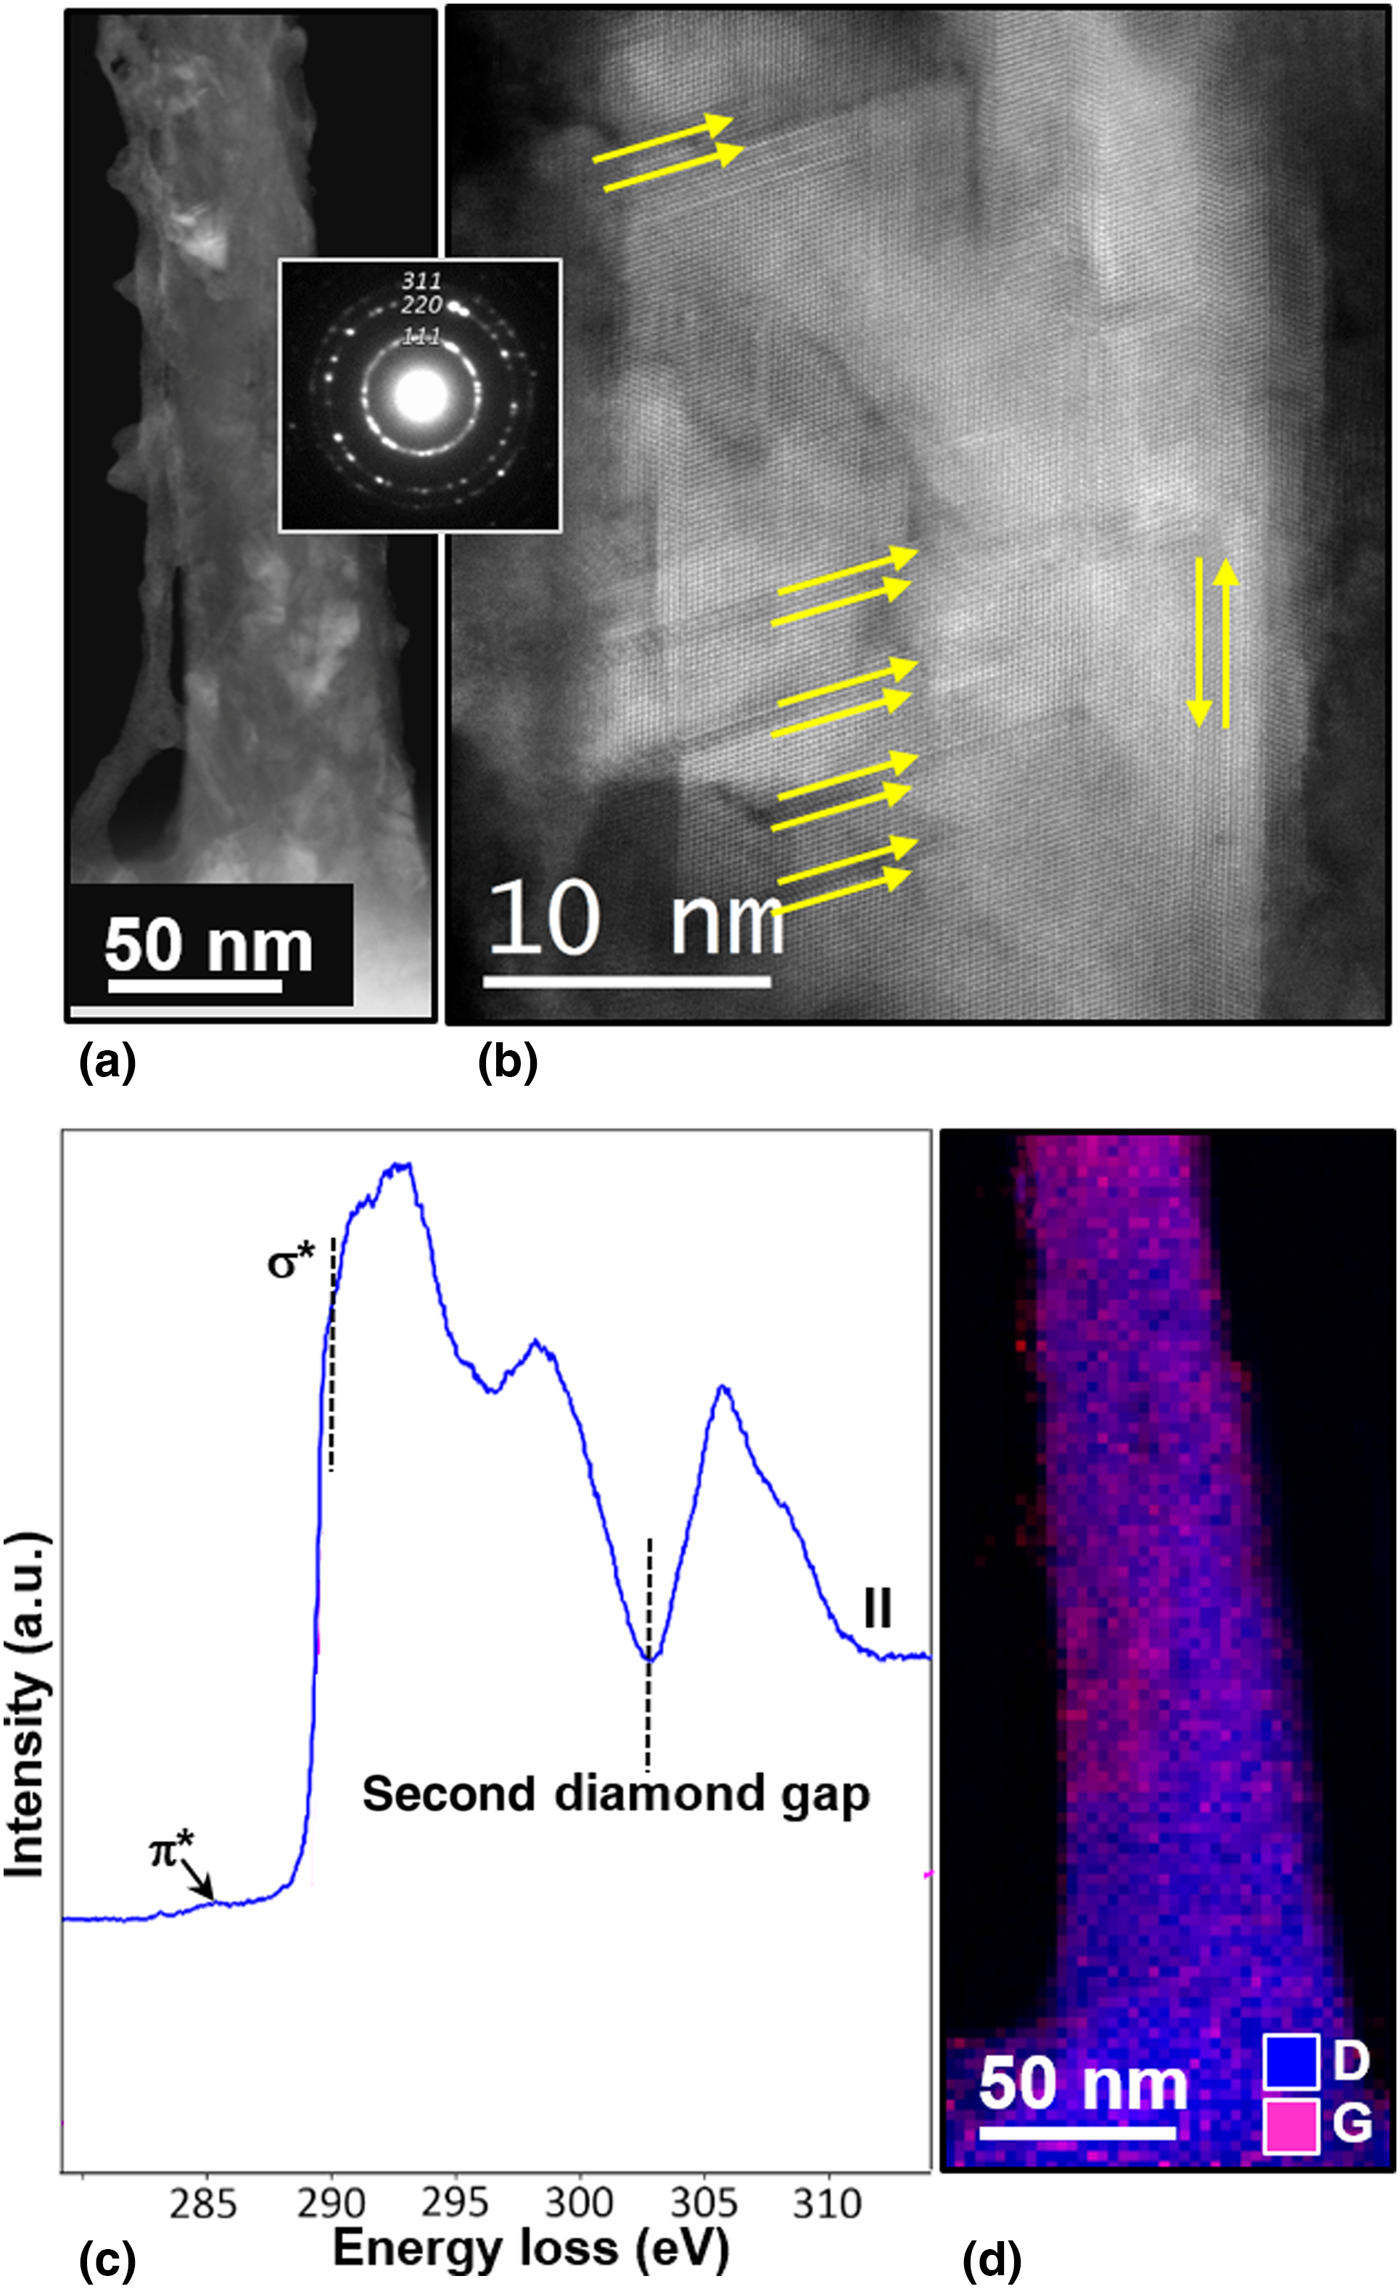
The results described above indicate that N-DNRs possess enhanced TEE behavior (the larger J TEE value) compared with the other samples examined in this study. However, understanding the microstructure of N-DNRs is required in order to clarify the key factor(s) for improving the TEE properties of N-DNRs. The detailed microstructures of N-DNRs were characterized by cross-sectional ADF-STEM. Figure 5(a) shows the nanowire of cone-shaped geometry, i.e., with diameter ranging from ~30 nm at the tip, ~60 nm at the middle, and ~80 nm at the bottom. The inset in Fig. 5(a) shows the corresponding selective area electron diffraction (SAED) pattern, which contains sharp diffraction rings corresponding to (111), (220), and (311) lattice planes of diamond. This confirms the diamond nature of the N-DNRs, although Raman spectrum of N-DNRs contains very small Γ2g-band corresponding to sp 3-bonds (see spectrum IV, Fig. S4 of the Supplementary information). There appears a diffused ring in the center of the SAED pattern, indicating the existence of large proportion of sp 2-bonded carbon in this material. A high-resolution ADF-STEM image [Fig. 5(b)] shows that the N-DNRs contain structural defects such as stacking faults and twins.
(a) Typical cross-sectional ADF-STEM micrograph of a N-DNR with corresponding SAED shown as inset, (b) high-resolution ADF-STEM image of a N-DNR, (c) EELS core-loss spectrum, and (d) composed EELS elemental mapping for diamond (blue) and graphite (pink) corresponding to Fig. 5(a).

In Fig. 5(c), a typical selective area EELS spectrum was plotted for the N-DNRs shown in Fig. 5(a). The sp 2 and sp 3 phases were obtained by fitting the experimental spectra to the references of graphite and diamond using the EELS model software.[Reference Verbeeck and Van Aert15] This carbon K-edge spectrum exhibits a sharp peak at 289.5 eV (σ* band) and a dip in the vicinity of 302.0 eV representing the typical EELS signal of sp 3-bonded carbon (the diamond). Moreover, there exists a small shoulder or bump at 285.0 eV (π* band) signifying the sp 2-bonded carbon.[Reference Gruen, Liu, Krauss, Luo and Pan16, Reference Kovarik, Bourdon and Prince17] This observation revealed the existence of sp 2 phases not only at the surface, which is observed from x-ray photoelectron spectroscopy studies (XPS; Fig. S5 of the Supplementary information), but also exist in the bulk of the N-DNRs. Figure 5(d) shows the STEM-EELS mapping with sp 3-diamond (D, blue color) and sp 2-graphite (G, pink color) for the same region depicted in Fig. 5(a), revealing the presence of sp 2 and sp 3 phases simultaneously in the N-DNRs. On the basis of ADF-STEM investigations, it is noticed that the bulk of the N-DNR is a nanohybrid material, which consists of nano-sized diamond grains (sp 3-bonded carbon) along with nanographites (sp 2-bonded carbon) at the grain boundaries and the surface of the nanorods, which is in accord with the findings from Raman and XPS investigations (Figs. S4 and S5 of the Supplementary information).
Consequently, the induction of nanographitic phases formed at the grain boundaries of the N-DNRs is due to the incorporation of N in the N-DF film's growth plasma and the induction of sp 2-bonds at the surface results from the RIE process. The presence of nanographitic phases leads to lower φ value (4.5 eV) for N-DNRs as compared with U-DNRs. From these observations, we can assume that the interconnected nanographitic phases forming conducting paths in the N-DNRs for transporting electrons to the emitting surface. Once the electrons reach the tip of the N-DNRs with high aspect ratio, they can be emitted into the vacuum without any difficulty as the diamond surfaces show negative electron affinity in nature due to H2-termination.[Reference Yamaguchi, Masuzawa, Nozue, Kudo, Saito, Koe, Kudo, Yamada, Takakuwa and Okano18, Reference Koeck, Nemanich, Balasubramaniam, Haenen and Sharp19] However, the φ value of N-DNRs estimated from Fig. 4(b) [(φ)N-DNRs = 4.5 eV] is large as compared with those reported for other diamond materials (Table SII of the Supplementary information). A tailoring of the type of dopants and the doping concentration in N-DFs could result in the decrease in the φ-value, which may further improve the thermionic operation of these nanostructures.
Discussion
The TEE parameters listed in Table I reveal that nanostructuring the DFs markedly changes the Richardson constant of the materials and the extent of modification on this parameter depends on whether the materials are conductive or not. Actually, it is observed for the first time that the Richardson constant of a material can be increased via the change in morphology, mainly the formation of nanorods due to RIE process. The theoretical value for Richardson constant is about 120 A/cm2 K2.[Reference Koeck and Nemanich20] In practical TEE devices, the Richardson constant of the practical cathode materials is markedly smaller than the theoretical value due to imperfection of the materials, such as low conductivity of the materials, which decreases the effective transport of electrons and insufficient number of sites to emit the electrons efficiently. Paxton et al. observed that the as-prepared N-doped diamond/Mo cathodes emit electrons reasonably well (J TEE ~ 22 nA), following the R–D equation against the temperature, until ~800 °C (with φ = 2.25 eV and A R = 9.97 × 10⁻⁴ A/cm2, which were deduced from the J TEE–T curves using R–D model).[Reference Paxton, Howell and Kang21] The current then began to decrease with temperature to maximum test temperature at about 900 °C. Upon reheating, the cathode showed no measureable emission current that is ascribed to the desorption of the H2 bonded at the surface. The samples regain thermionic emission capacity to J TEE = 6 mA after they were post-treated with hydrogen plasma (with φ = 2.22 eV and A R = 5.96 A/cm2). That is, they observed that the hydrogen plasma treatment re-adsorbed the hydrogen on the cathode, which were previously desorbed with hydrogen due to high-temperature operation dramatically increased the Richardson constant for four order of magnitude, and hence markedly increased the TEE current density. This process had little effect on modifying the work function of the N-doped diamond. These observations indicate the importance of forming the sufficient number of electron emission sites on the surface of cathode materials, and the Richardson constant is a measure of the number density of the electron emission sites. Moreover, Kato et al. observed that increasing the phosphorus content in a H-terminated diamond/Mo films improved the TEE capacity of about two orders of magnitude that is mainly owing to the increase in Richardson constant from 10 µA/cm2 K2 for lightly P-doped diamond/Mo films for about six orders of magnitude to 15 A/cm2 K2 for heavily P-doped films.[Reference Kato, Takeuchi, Ogura, Yamada, Kataoka, Kimura, Sobue, Nebel and Yamasaki22] The work function of the materials was increased from φ = 0.9 to 2.3 eV due to the increase in phosphorus concentration that contributed much less on increasing the J TEE-value. Moreover, Koeck et al. also observed that in sulfur-doped MCD/Mo films, the Richardson constant changes markedly (2.2–40.0 A/cm2 K2), whereas the work function varied insignificantly (φ = 2.3–2.5 eV) due to the change in sulfur concentration in DFs.[Reference Koeck, Garguilo and Nemanich23, Reference Koeck and Nemanich24] These observations indicate that the increase in Richardson constant is also an effective approach, besides the decrease in work function, to improve the performance of the TEE cathode materials. It seems that the possible way of enlarging the Richardson constant of a cathode materials is the increase in emission site density of the cathode materials, or the increase in conductivity of the materials by the increase in donors (phosphorus or sulfur) concentration, as the increase in concentration of donors, which can donate electrons to the cathode materials, is equivalent to the increase in the number density for electron emission sites.
In our studies, incorporation of nitrogen into DFs markedly increased the Richardson constant from (A R)U-DF = 0.05 mA/cm2 K2 for U-DFs to (A R)N-DF = 3.8 mA/cm2 K2 for N-DFs (see Table I) that is close to the improvement in conductivity of DFs, which, in turn, is resulted from the formation of nanographitic phase along the grain boundaries of the diamond materials. The work function was insignificantly altered (φ)U-DF = 5.0 eV and (φ)N-DF = 4.8 eV (see Table I). Moreover, we observed that the formation of DNRs via RIE process further increases the Richardson constant of N-DFs for about five times [(A R)N-DF = 3.8 mA/cm2 K2 for N-DFs and (A R)N-DNRs = 18.0 mA/cm2 K2 for N-DNRs] without modifying the work function values [(φ)N-DF = 4.8 and (φ)N-DNRs = 4.5 eV]. The increase in Richardson constant for N-DNRs materials compared with that for N-DFs is presumably owing to the increase in the number density of emission sites, which, in turn, is due to the increase in surface area, which is equivalent to the increase in the proportion of electron emission sites.
On the other hand, the formation of U-DNRs also increases largely the number density of emission sites due to the increase in surface area but is not effective in increasing the Richardson constant of the cathode materials. The possible reason is that the U-DF is resistive that limits the transport of the electrons. The increase in surface area does not enhance the thermionic emission of electrons capacity due to the lack of electron supply to the emission sites. Restated, in order to effectively increase the Richardson constant of a cathode material in a thermionic emission device, nanostructuring the emitting surface is an efficient way, provided that the cathode materials by themselves possess a sufficient electrical conductivity.
Conclusions
As a prospective building block for the next generation of devices, one-dimensional nanostructured materials are promising tools in a vast field of applications. Using ND particle-masked N-DFs as templates, highly ordered vertically aligned N-DNRs were fabricated via O2-plasma RIE process. For comparison, U-DNRs were fabricated from U-DFs. The characterization studies reveal that the N-DNRs comprise nano-sized diamond grains along with sp 2-graphitic phases at the grain boundaries and the surface of the nanorods, displaying as a nanohybrid material. The thermionic emitter that used N-DNRs as cathode exhibits a high J TEE of 12.0 mA/cm2, the φ value of 4.5 eV and A R value of 18.0 A/cm2 K2 with an applied voltage of 3 V at 923 K. Moreover, at 773 K the N-DNRs show a life-time stability for a duration of 6000 min at an applied voltage of 3 V. The TEE properties of N-DNRs are superior to those of the U-DNRs, which are attributed to the combined effect of the induction of abundant sp 2-graphitic phases at the grain boundaries and the field penetration effect through the local field enhancement from nanorods owing to a high aspect ratio and an excellent field enhancement factor. The present approach on N-DNRs-based thermionic emitters could considerably reduce power requirements for conventional thermionic electron sources.
Supplementary material
The supplementary material for this article can be found at https://doi.org/10.1557/mrc.2018.158
Acknowledgments
The authors thank the financial support of the Research Foundation Flanders (FWO) via Research Grant 12I8416N and Research Project 1519817N, and the Methusalem “NANO” network. The Hercules Foundation Flanders is acknowledged for financial support of the Raman equipment. The Qu-Ant-EM microscope used for the TEM experiments was partly funded by the Hercules fund from the Flemish Government. S.K. and J.V. acknowledge funding from GOA project “Solarpaint” of the University of Antwerp. K.J. Sankaran and P. Pobedinskas are Postdoctoral Fellows of FWO.
Author contributions
K.J.S., K.H., and I.N. Lin conceived and designed the experiments, synthesized the samples and wrote the manuscript with inputs from all the co-authors. S.D., P.P., and M.K.V.B. performed the SEM and Raman spectroscopy measurements. S.D. and S.S.R. performed the KPFM imaging experiments. S.K., J.V., C.J.Y., and K.C.L. performed the electron microscopic imaging and EEL spectroscopy measurements. J.P.T. and K.T.L. performed the XPS measurements.
Competing financial interests statement
None.
Conflict of interest
None.