Implications
Evolution of feed evaluation systems towards tools allowing prediction of multiple animal responses (efficiency, excretion, quality of products, welfare, etc.) requires quantitative integration of knowledge on site and extent of digestion, which highly impact the amount and profile of nutrients delivered to peripheral tissues. We present quantitative knowledge on fibre, starch and sugar digestion, volatile fatty acid and glucose production, absorption and metabolism by splanchnic tissues, as well as modelling approaches which aim at representing and/or predicting nutrient fluxes in digestive tract, portal and hepatic drainage.
Introduction
Current feed evaluation systems for ruminants have been partly developed to adjust nutrient supply to animal’s requirements. Given the multiplicity of new objectives weighing on ruminant production systems (efficiency of production, N and C excretion, quality of products and welfare), the evolution of feed evaluation systems needs to contribute to a better prediction of multiple animal responses to diets. It is now well documented that most of targeted animal responses to diet are closely related to site, extent and kinetics of digestion of energy supplied by dietary carbohydrates that highly impact the amount and profile of nutrients delivered to peripheral tissues. Whereas energy is currently still considered as an aggregated unit, development of multi-objective feed evaluation systems requires the integration of quantitative knowledge on carbohydrate digestion and yield of terminal products, as well as on their metabolism by splanchnic tissues. It is a challenge because of the diversity in diet composition and intake levels existing in ruminant production systems. The objectives of this paper are to review (i) quantitative knowledge on fibre, starch and sugar digestion, volatile fatty acid (VFA) and glucose production and splanchnic metabolism and (ii) modelling approaches which aim at representing and/or predicting nutrient fluxes in the digestive tract, portal and hepatic drainage. Several results presented in this paper originate from meta-analyses of literature data, using databases developed at INRA gathering published results in vivo on digestion (BoviDig; Sauvant et al., Reference Sauvant, Martin and Mertens2000), VFA ruminal production (VFA-Prod; Nozière et al., Reference Nozière, Glasser, Martin and Sauvant2007), and blood nutrient fluxes across splanchnic tissues (Flora; Vernet and Ortigues-Marty, Reference Vernet and Ortigues-Marty2006). Most of the meta-analyses presented in this paper have already been published; others are presented as unpublished synthesis of literature data.
Cell walls, starch and soluble carbohydrates: extent and rate of ruminal digestion
Several types of carbohydrates are found in feedstuffs: cell wall (CW) insoluble or soluble carbohydrates, starch and water-soluble carbohydrates (WSC). The CW insoluble carbohydrates are classically characterized as the fraction insoluble in a neutral detergent solution, called NDF. It consists of cellulose, hemicelluloses and lignin, a small amount of N-containing material and residual starch for cereals if no amylase treatment is previously applied. The NDF does not include CW soluble material such as pectins. Next to NDF, starch and soluble sugars, a significant fraction of carbohydrates (generally more than 10%) remains unaccounted for in standard feed analysis. It likely consists of xylans, glucans and organic acids.
CW insoluble carbohydrates
NDF ranges from 40% to 80% of dry matter (DM) in forages, depending on the botanical family, vegetation stage and preservation. In concentrate and by-products, NDF ranges from traces (i.e. corn gluten meal) to more than 80% of DM (i.e. buckwheat hulls, corn cobs, extracted grape pips meal, etc.). Depending on diet composition, NDF content accounts for 30% to 80% of DM intake. For forages, NDF digestibility in the total tract ranges from 40% to 85%. Undigestible NDF highly depends on organic matter (OM) digestibility for grass, legumes and straws (INRA, 2007). For concentrates, digestibility of NDF can be indirectly evaluated from digestibility of OM, starch, CP and fatty acids (Sauvant et al., Reference Sauvant, Chapoutot and Schmidely2008), and ranges from 20% to 90%. Given their NDF content and digestibility, only few forages (e.g. fresh brome grass), and concentrates (e.g. soya bean hulls, palm kernel meal), contain nearly 50% of digestible NDF (dNDF) in DM.
Ruminal digestion of NDF apparently starts after a lag phase. In sacco, this lag phase is positively related to the NDF content and can reach 10 h (Sauvant and Van Milgen, Reference Sauvant and Van Milgen1995). Time required for comminution and microbial colonization contributes to this lag phase. Physical breakdown of particles is the outcome of mastication during ingestion and rumination, which in turn facilitates hydration, microbial colonization, release of enzymes and hydrolysis. Mastication time ranges from 400 to 1000 min/day, corresponding to a chewing index of approximately 20 to 100 min/kg DM intake in dairy cows (Sauvant et al., Reference Sauvant, Dulphy and Michalet-Doreau1990). This index is closely related to dietary CW content (Dulphy et al., Reference Dulphy, Rouel, Jailler and Sauvant1993) and granulometry (Sauvant, Reference Sauvant2000). An extensive study by Yang (Reference Yang1991) demonstrated that microbial colonization starts very early, with rates varying from 10% to 40%/h in sacco, and is proportional to NDF content (approximately 50 mg microbial DM/g NDF after 3 h) due to the fact that CW provides a wide surface area for microbial attachment. Maximal colonization also depends on particle size, varying between 10% to 15% (particles >0.1 mm) and 40% to 60% (particles <0.1 mm). Following digestion, it decreases towards an asymptote where microbial mass is mainly associated with the indigestible fraction. Thus, an important microbial population remains present in the rumen and contributes to rumen stability.
Compared with other carbohydrates, the ruminal digestion rate of dNDF, which depends on the extent and nature of lignification, is low (2% to 8%/h). Therefore, the extent of rumen digestion of NDF is highly dependant on the residence time of particles in the rumen, and thus on the lag phase of recently consumed large particles and on the fractional turnover rate of small particles (2% to 8%/h). Fractional turnover rate of particles depends on particle size and density (Lechner-Doll et al., Reference Lechner-Doll, Kaske and Engelhardt1991), as well as on intake level (with an average increase of 0.74%/h for 1 g DM intake/100 kg BW; Sauvant, Reference Sauvant2003). The ruminal degradation of NDF is depressed with concentrate supplementation. This is clearly related to a decrease in activity of fibrolytic enzymes of the microorganisms adhering to plant particles (Nozière et al., Reference Nozière, Besle, Martin and Michalet-Doreau1996), rather than to changes in the structure of the cellulolytic bacterial community (Martin et al., Reference Martin, Millet, Fonty and Michalet-Doreau2001). Modifications in cellulolytic activity may be partly explained by the shift in ruminal pH. In sacco, this is mainly reflected by a decrease in fractional degradation rate, but also by an increase in the undegradable fraction (Van Milgen et al., Reference Van Milgen, Berger and Murphy1992).
Since ruminants do not secrete endogenous fibrolytic enzymes, NDF escaping ruminal digestion is not digested in the small intestine. It is only partly (and slowly) degraded in the hindgut, since the cellulolytic activity in the caecum is much lower than in the rumen (Michalet-Doreau et al., Reference Michalet-Doreau, Fernandez and Fonty2002), and the residence time of particles in the hindgut is lower than in the forestomachs (Huhtanen et al., Reference Huhtanen, Ahvenjärvi, Weisbjerg and Nørgaard2004). Consequently, the hindgut accounts on average for only 10% of total tract NDF digestion. Factors influencing ruminal degradation (and consequently total tract digestibility) of NDF are not only the intrinsic characteristics of feedstuffs, particularly their lignification, but also factors related to diet composition and intake level, that is, the amount and activity of fibrolytic microorganisms, and the passage rate of particles through the rumen.
Starch
Starch can account for a substantial proportion of DM in ruminant diets, and can exceed 50% of DM intake in intensive diets based on ensiled cereals and/or grains. The starch content of grains varies among cereals from 40% DM (oat) to 87% DM (rice), depending as well on varieties, location, year, climatic conditions and agronomic practices. The starch content of corn silages (17% to 41%) depends mainly on plant maturity, that is, the proportion of grain in the plant (32% to 54%), with an average increment of 0.7 g starch/g grain. Since ruminant saliva contains no amylase, starch degradation is primarily the result of bacterial enzymes, following attachment and colonization of grain particles by amylolytic bacteria. Protozoa play a key role on delaying starch degradation since they can transitorily store starch granules (Jouany and Thivend, Reference Jouany and Thivend1972).
The proportion of starch digested in the rumen varies between 25% and nearly 100% of starch intake, and can reach up to 10 g/day per kg BW (Swingle et al., Reference Swingle, Eck, Theurer, De la Llata, Poore and Moore1999). Compared with NDF, starch is rapidly degraded in the rumen. An extensive quantitative review of data on starch content and in sacco degradation kinetics of grains (Offner et al., Reference Offner, Bach and Sauvant2003) has been largely included in the values tabulated by INRA-AFZ (2004). It showed that ruminal starch degradability varies widely among starch sources, from 60% on average for corn and sorghum to 95% for wheat, triticale or rye, depending on both the extent of the soluble fraction (20% to 80%) and the fractional degradation rate of the insoluble starch (5% to 60%/h). Grain processing also affects starch ruminal degradation. For example, toasting reduces starch degradability for oat and barley (−31 and −17 g/100 g, respectively), whereas steam-flaking increases starch degradability for corn and sorghum (+26 g/100 g after 1 h). Decreasing mean particle size while improving accessibility of digestible starch to microbial enzymes increases in sacco starch degradability, by an average of 16 g degradable starch/100 g in corn when mean particle size decreases by 1 mm (Offner et al., Reference Offner, Bach and Sauvant2003). Genotype also highly affects starch degradation, with in sacco starch degradability ranking from 40% to 80% for corn depending on its vitreousness (Philippeau et al., Reference Philippeau, Landry and Michalet-Doreau2000), which affects microbial colonization of grain (McAllister et al., Reference McAllister, Rode, Major, Cheng and Buchanan-Smith1990). The in sacco degradability of starch in maize silages is less documented due to methodological difficulties. It apparently ranges from 75% to 95%, and decreases an average of 7% when DM of whole plant increases of 10%. However, grinding silages before in sacco incubation induces large losses of starch particles through bag pores. When grains are sampled just before harvesting, particle losses are drastically reduced, allowing adequate determination of in sacco degradation, with starch degradability ranging from 40% to 90% depending on genotype and maturity, both reflected by vitreousness. The depressing effect of vitreousness on starch degradability is similar for both mature and immature corn grains, averaging −8% when vitreousness increases 10% (Philippeau et al., Reference Philippeau, Landry and Michalet-Doreau2000). Together with intrinsic characteristics of feedstuffs, intake level also negatively affects ruminal starch digestibility (RSD) by increasing passage rate of particles through the rumen. This effect is less important for starch (and particularly for highly degradable starch) than for NDF, due to the higher ratio of degradation rate/passage rate. The amylolytic activity of bacteria increases with starch availability (Nozière and Michalet-Doreau, Reference Nozière and Michalet-Doreau1997) and may not be a limiting factor for ruminal starch digestion in most situations.
Water-soluble carbohydrates
WSC, including lactate in silages, normally accounts for less than 15% of DM, but could reach more than 20% at stem elongation or ear emergence in ryegrass. The disappearance rate of WSC from the ruminal fluid is very high (>400%/h; Weisbjerg et al., Reference Weisbjerg, Hvelpund and Bibby1998), and it is generally admitted that WSC are fermented in the rumen instantaneously after being released from the plant cells. However, based on the transitory post-prandial accumulation of WSC in the rumen with diets rich in WSC, the capacity of microbes to take up and metabolize WSC is probably limited by thermodynamic laws of metabolic pathways. Moreover, the uptake of carbon chains by microbial cells could be much more rapid than their fermentation, with a maximal level of carbohydrate accumulation in microbial cells about 1 h after the meal, and a subsequent decrease at 5% to 20%/h (Sauvant and Van Milgen, Reference Sauvant and Van Milgen1995). This short-term adaptation delays the disposal of energy by microbes. Consequently, whereas fractional degradation rates of 150% to 300%/h are assumed for WSC in some rumen models (Russell et al., Reference Russell, O’Connor, Fox, Van Soest and Sniffen1992; Petruzzi et al., Reference Petruzzi, Danfaer and Nørgaard2002), a much lower fractional degradation is more likely, but experimental evidence is lacking. Satisfactory adjustments are obtained assuming a fractional rate of around 40%/h (D. Sauvant, unpublished). Assuming a fractional passage rate of liquid lower than 15%/h, a low proportion of ingested WSC may escape ruminal degradation, and is highly digested in the small and large intestines.
Representation of carbohydrate digestion in rumen models
In most detailed rumen models, a minimum of four fractions of dietary carbohydrates are generally represented, including soluble carbohydrates, degradable starch, degradable and undegradable CW. Those fractions are generally based on their chemical composition (ADL for undegradable CW), or by in sacco or in vitro data (to separate soluble and undegradable fractions). In the Cornell model (CNCPS), the number of carbohydrate pools has been recently expanded by considering separately VFA and lactic acid from silages, other organic acids, sugars and soluble fibre (Lanzas et al., Reference Lanzas, Sniffen, Seo, Tedeschi and Fox2007). Processes occurring during lag time are generally not explicitly represented, or are included without any transition from the lag phase to the digestion process. Whereas it is generally assumed that the lag compartments are subjected neither to passage from the rumen nor to microbial degradation (Baldwin et al., Reference Baldwin, Thornley and Beever1987b; Chilibroste et al., Reference Chilibroste, Dijkstra, Robinson and Tamminga2008), a lower lag time before digestion than before transit, has been proposed (Sauvant et al., Reference Sauvant, Baumont and Faverdin1996). Such inclusion of lag time is of undeniable interest for dynamic representation of processes, but their interest to improve predictions of the average daily flows at duodenum remains questionable (Bannink et al., Reference Bannink, De Visser and Van Vuuren1997). Regulation of CW degradation rate according to pH is generally taken into account, with fairly comparable levels of corrections among models. For starch, regulation of degradation rate according to microbial biomass is taken into account in some models (Baldwin et al., Reference Baldwin, Thornley and Beever1987b; Dijkstra et al., Reference Dijkstra, Neal, Beever and France1992). Concerning passage rate, two or three outflow rates are generally considered. The liquid and the solid phases are either considered globally (Dijkstra et al., Reference Dijkstra, Neal, Beever and France1992), or separated between forage and concentrate particles (Sniffen et al., Reference Sniffen, O’Connor, Van Soest, Fox and Russell1992; Lescoat and Sauvant, Reference Lescoat and Sauvant1995), or between large and small particles (Baldwin et al., Reference Baldwin, Thornley and Beever1987b; Petruzzi et al., Reference Petruzzi, Danfaer and Nørgaard2002). Although most models represent the effect of intake level on flow rates, equations vary widely among models. This largely impacts predictions, as underlined by Dijkstra and France (Reference Dijkstra and France1996). A more mechanistic representation of transit has been proposed in some models (Sauvant et al., Reference Sauvant, Baumont and Faverdin1996), and deserves further exploration.
Published quantitative comparisons of mechanistic rumen models based on their ability to predict ruminal digestion of CW and/or starch are only scarce and restricted to steady state evaluations. Bannink et al. (Reference Bannink, De Visser and Van Vuuren1997) compared models of Baldwin (Reference Baldwin1995), Danfaer (Reference Danfaer1990) and Dijkstra et al. (Reference Dijkstra, Neal, Beever and France1992). Offner and Sauvant (Reference Offner and Sauvant2004a) compared models of Molly (Baldwin et al., Reference Baldwin, Thornley and Beever1987b), CNCPS (Sniffen et al., Reference Sniffen, O’Connor, Van Soest, Fox and Russell1992; Pitt et al., Reference Pitt, van Kessel, Fox, Pell, Barry and van Soest1996; Fox et al., Reference Fox, Tylutki, van Amburgh, Chase, Pell, Overton, Tedeschi, Rasmussen and Durbal2000) and Lescoat and Sauvant (Reference Lescoat and Sauvant1995). The evaluations differed according to the estimation of the various input parameters, the amount and diversity of feeding situations, and the tested statistical evaluation methods, which lead to some differences in their conclusions. Both evaluations stressed that none of the current models accurately predicted fibre digestion, whereas Offner and Sauvant (Reference Offner and Sauvant2004a) underlined the fairly good capacity of Lescoat and Sauvant’s (Reference Lescoat and Sauvant1995) model to predict starch ruminal digestion from in sacco measurements.
Production and absorption of VFA
Mechanisms involved in ruminal production of VFA
The VFA, as well as NH3, gas (CO2 and CH4), and occasionally lactic acids, are end products of microbial fermentation in the rumen. They consist mainly of acetate, propionate and butyrate, and to a lower extent of valerate, caproate, iso-butyrate and iso-valerate. The VFA mainly derive from dietary carbohydrates, but in diets rich in rumen degradable protein, deaminated amino acids (AAs) significantly contribute to VFA yield via isobutyric, isovaleric and 2-methylbutyric acids produced from valine, leucine and isoleucine, respectively. Following hydrolysis of dietary polymers, monomers are fermented in the cytoplasm into VFA via glycolysis and pyruvate. Acetate and butyrate are both formed from acetyl coA, whereas propionate is mainly formed via the succinate and to a lower extent via lactate (i.e. acrylate) pathway. Valerate and caproate are assumed to be formed following condensation of acetyl-CoA and propionyl-CoA. The fermentation processes involve transfer of molecular H and generates metabolic energy in the form of adenosine triphosphate (ATP) that is subsequently utilized by microorganisms for their maintenance and growth. The partition among the fermentative pathways is regulated through thermodynamic laws by both ATP/ADP and NADH2/NAD cofactor ratios, which reflect energy status and redox balance, respectively. It is likely that when available C is in excess, fermentation pathways that provide less ATP are favoured (Sauvant and Van Milgen, Reference Sauvant and Van Milgen1995). The VFA composition, and the subsequent loss of C in gasses, are mainly determined by the composition of the microbial population, and thus largely determined by both intake level and dietary composition, particularly the nature of carbohydrates and their degradation rate. Typically, the development of fibrolytic microorganisms induces high levels of acetate, whereas the development of amylolytic microorganisms induces an increase in the proportion of propionate, allowing increased utilization of excess reducing power. Concentrate diets, and particularly diets rich in WSC, may also promote development of protozoa that induces an increase in butyrate rather than propionate (Brossard et al., Reference Brossard, Martin, Chaucheyras-Durand and Michalet-Doreau2004).
Quantitative evaluation of production of VFA
Total VFA
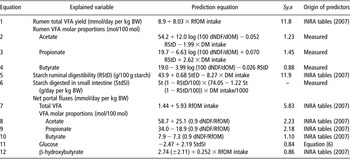
In most rumen models that represent VFA yield, the total amount of VFA and gas produced is calculated from the amount of degraded OM that is not incorporated into microbial mass. Estimations are thus highly dependent on the accurate representation of substrate degradation and/or microbial synthesis. Moreover, a major problem in evaluating the accuracy of estimations is that the evaluation is based on measurements of VFA concentrations rather than on rates of VFA production. Indeed, due to methodological constraints (see review by France and Dijkstra, Reference France and Dijkstra2005), the VFA yield is only rarely measured so that the actual value is generally not known. More direct empirical approaches can be developed to predict the ruminal production of VFA, based on measured VFA production rate (VFA-PR) and on estimation of the energy available in the rumen. The most common in vivo methods for measuring the VFA-PR are based on the use of VFA labelled with 14C (Sutton et al., Reference Sutton, Dhanoa, Morant, France, Napper and Schuller2003), or 13C (Markantonatos et al., Reference Markantonatos, Green and Varga2008). Although steady state condition is normally assumed, the interpretation of tracer data using dynamic modelling allows their adaptation for non-steady state conditions. The total VFA-PR can be determined after administration of any one of the individual VFA (or of a VFA mixture), and determination of total VFA enrichment, assuming VFA as a homogeneous pool (single-pool scheme). Since it is the main limiting factor for microbial protein synthesis, the energy available in the rumen is represented in the various N feed evaluation systems over the world. In the French PDI system and its Dutch version (DVE/OEB), it is estimated by the rumen fermentable OM (RfOM) = digestible OM – non-degradable CP (in sacco) – non-degradable starch (in sacco) – fat – a fermentation product (with a = constant). Using a database that gathered results of measured VFA-PR (Nozière et al., Reference Nozière, Glasser, Martin and Sauvant2007), and homogeneously characterizes dietary treatments according to INRA feed tables, we showed a close relationship between estimated RfOM intake and measured total VFA-PR (Table 1, equation (1)). The relationship suggests an average increment of 8.0 mol (±0.6) of total VFA-PR/kg RfOM (Nozière et al., Reference Nozière, Glasser, Loncke, Ortigues Marty, Vernet and Sauvant2010). This prediction presents no significant interfering factors, and appears irrespective on whether changes in RfOM intake are due to changes in DM intake and/or in dietary RfOM content. Moreover, this slope, corresponding to approximately 540 g VFA/kg RfOM, is fully consistent with the efficiency of microbial synthesis, which is assumed in the PDI system to be approximately 300 g microbial matter/kg RfOM, the rest consisting of gas.
Empirical equations developed from INRA feed evaluation system to assess digestive and net portal fluxes of VFA, glucose and β-hydroxybutyrate

VFA = volatile fatty acids; RfOM = rumen fermentable OM intake; StdSI = starch digested in small intestine (g/d per kg BW).
DM intake (kg/d per 100 kg BW).
dNDF = digestible NDF; dOM = digestible OM; RfOM = rumen fermentable OM; St = starch (g/100 g DM).
RStD = starch ruminal digestibility; StED = starch in sacco degradability (g/100 g starch).
Equations 1 to 4: Nozière et al. (Reference Nozière, Glasser, Loncke, Ortigues Marty, Vernet and Sauvant2010); equations 5 and 6: Offner and Sauvant (Reference Offner and Sauvant2004b); equations 7 to 12: Loncke et al. (Reference Loncke, Ortigues-Marty, Vernet, Lapierre, Sauvant and Nozière2009b).
Stoichiometry of fermentations
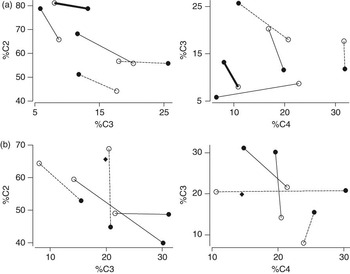
Several attempts have been made to provide stoichiometric coefficients describing partition of C between each VFA for each fermented substrate (Figure 1). Using a large database, Murphy et al. (Reference Murphy, Baldwin and Koong1982) proposed, for five fermented substrates (soluble carbohydrates, starch, hemicellulose, cellulose and protein) separate coefficients for roughage and concentrate diets. These coefficients (Murphy et al., Reference Murphy, Baldwin and Koong1982; Murphy, Reference Murphy1984) have been widely used in several mechanistic rumen models (Baldwin et al., Reference Baldwin, Thornley and Beever1987b; Dijkstra et al., Reference Dijkstra, Neal, Beever and France1992), but their evaluation indicated that the prediction of VFA molar proportions in the rumen remained inaccurate (Neal et al., Reference Neal, Dijkstra and Gill1992; Bannink et al., Reference Bannink, De Visser and Van Vuuren1997). Using a similar approach, Bannink et al. (Reference Bannink, Kogut, Dijkstra, Kebreab, France, Tamminga and Van Vuuren2006), proposed new coefficients derived from data exclusively on true (instead of apparent) ruminal digestion in lactating cows. VFA predictions were however not substantially improved. To avoid the discontinuity between roughage and concentrate data sets, Friggens et al. (Reference Friggens, Oldham, Dewhurst and Horgan1998) developed a minimalist design using sheep, allowing the comparison of a wide range of diets differing in intake level, nature and percentage of concentrate. The derived coefficients, based on dietary chemical composition (CP, starch, sugar and cellulose) rather than on ruminal digestion, were restricted to grass-based diets. Sveinbjörrnsson et al. (Reference Sveinbjörnsson, Huhtanen and Udén2006) using a large database on dairy cows restricted to Nordic diets, also derived coefficients based on dietary chemical composition (CP, starch, lactic acid, NDF from forage, NDF from concentrate and a ‘rest fraction’ defined as ‘OM–NDF–starch–CP–lactate–VFA’), and proposed corrections of coefficients, depending on concentrate ether extract and feeding level. The model of Lescoat and Sauvant (Reference Lescoat and Sauvant1995) primarily aimed at predicting AA flows, used a more simple empirical approach based on mean responses of VFA profiles to percentage of concentrate, but this approach has been proved to be inaccurate (Offner and Sauvant, Reference Offner and Sauvant2004a). Besides digested substrates, the specific effect of rumen pH on stoichiometry of VFA from fermentation of WSC and starch, has also been included by Argyle and Baldwin (Reference Argyle and Baldwin1988), Pitt et al. (Reference Pitt, van Kessel, Fox, Pell, Barry and van Soest1996) and Bannink et al. (Reference Bannink, Kogut, Dijkstra, Kebreab, France, Tamminga and Van Vuuren2006), but pH also depends on VFA. These stoichiometric models, focused on the transformation of the different specific substrates, indirectly represent the differential effects of amylolytic v. cellulolytic bacteria. In contrast, protozoa, which use all types of substrates, but produce a higher proportion of butyrate than bacteria are not generally represented. Nagorcka et al. (Reference Nagorcka, Gordon and Dynes2000) set up separate stoichiometric coefficients of VFA yield for amylolytic bacteria, fibrolytic bacteria and protozoa. Taken together, these results stress the challenge for an accurate prediction of stoichiometry. Indeed, coefficients derived from dietary composition appear to be too restrictive for generic application, given the variability of rate and extent of fermentation. It is not certain that the same coefficients can be used for all dietary composition or intake levels. On the other hand, use of coefficients derived from digested substrates requires an accurate estimation of chosen digestible substrates. Another major problem in evaluating the accuracy of stoichiometric coefficients is that the evaluation is based on measurements of VFA concentrations rather than on rates of VFA production. Moreover, the assumptions made for derivation of the stoichiometric estimates (e.g. efficiency of microbial synthesis, absorption rates, etc.) vary widely among studies, and impact the results of the comparative evaluation. Friggens et al. (Reference Friggens, Oldham, Dewhurst and Horgan1998) clearly illustrated the limitations of such empirical regressions and the lack of their general applicability. More mechanistic approaches, based on representation of thermodynamic laws have been attempted (Kohn and Boston, Reference Kohn and Boston2000; Offner and Sauvant, Reference Offner and Sauvant2006). Although first results were promising, such an approach does not appear sufficiently mature to date for predictive purposes.
Variations in stoichiometric coefficients (mol/100 mol volatile fatty acids) for rumen digested structural (a: − − hemicellulose ; — cellulose; —  NDF) and non-structural (b: − − soluble sugars, — starch, both
 ) carbohydrates, according to dietary composition: high-forage (○), high-concentrate (●) or all (
 ) diets. After Murphy et al. (Reference Murphy, Baldwin and Koong1982); Bannink et al. (Reference Bannink, Kogut, Dijkstra, Kebreab, France, Tamminga and Van Vuuren2006); Sveinbjörnsson et al. (Reference Sveinbjörnsson, Huhtanen and Udén2006).

More empirical approaches have also been developed based on interpretation of bibliographic databases with appropriate statistical methods of meta-analysis (Nozière et al., Reference Nozière, Glasser, Loncke, Ortigues Marty, Vernet and Sauvant2010). Through a wide diversity of experimental factors (BoviDig database; Sauvant et al., Reference Sauvant, Martin and Mertens2000) changes in the ratio between dNDF and dOM largely appear to explain changes in VFA molar proportions in the rumen, according to a curvilinear response. Residual variability around the prediction is largely explained by RSD reflecting the effect of site of starch digestion, DM intake and pH, which is in line with Friggens et al. (Reference Friggens, Oldham, Dewhurst and Horgan1998), Sveinbjörnsson et al. (Reference Sveinbjörnsson, Huhtanen and Udén2006) and Bannink et al. (Reference Bannink, Kogut, Dijkstra, Kebreab, France, Tamminga and Van Vuuren2006). Final models (Table 1, equations (2) to (4)) including dNDF/dOM, RDS and DMi exhibit very low Sy.x compared with other published models derived either from stoichiometric models (Bannink et al., Reference Bannink, Kogut, Dijkstra, Kebreab, France, Tamminga and Van Vuuren2006) or from more simple approaches based on a unique aggregated covariable such as percentage of concentrate (Lescoat and Sauvant, Reference Lescoat and Sauvant1995) or NDF dietary content (Sauvant, Reference Sauvant2003). Moreover, the curvilinear effect of dNDF/dOM, as well as the effect of DM intake on VFA profiles suggests that for a given fermented substrate, stoichiometric coefficients may not be considered as constant.
The calculation of the production rate of individual VFA could be possible assuming proportionality between VFA production and concentration, but this assumption is generally considered as not always valid. The use of interchanging compartmental models (3-pool scheme for acetate, propionate and butyrate) allows to take into account interconversions between VFA, and is not dependent on the assumed proportionality between VFA production and concentration. Using this approach, Sutton et al. (Reference Sutton, Dhanoa, Morant, France, Napper and Schuller2003) concluded that the molar proportions of acetate and propionate only slightly underestimated the proportions of their net production rates, whereas the molar proportion of butyrate overestimated its net production rate, particularly at low concentrations. Using the VFA-Prod database, Nozière et al. (Reference Nozière, Glasser, Loncke, Ortigues Marty, Vernet and Sauvant2010) confirmed these conclusions over a wider range of VFA molar proportions, and also stressed that the differences in molar proportion of butyrate between concentration and net production were mainly explained by methodological inter-study effects. This is a promising result with respect to the estimation of individual VFA ruminal fluxes based on their ruminal concentrations.
Mechanisms involved in the absorption of VFA
This aspect has been recently extensively reviewed (Gäbel and Aschenbach, Reference Gäbel and Aschenbach2006). Absorption of VFA through the reticulo-rumen wall accounts for 65% to 85% of the ruminal production, depending on the balance between the absorption rate and turnover rate of the liquid phase in the rumen. The VFA escaping absorption in the reticulo-rumen are absorbed in the omasum and abomasum. According to their pKa (<4.9), over 95% of the VFA should be in ionized form (VFA−) at the ruminal pH around 6 to 7, whereas their non-ionized form (VFAH) may diffuse more easily than VFA− through the double lipid layer of cell membranes. The simple diffusion of VFAH surely occurs through the ruminal epithelium, with H+ deriving from Na+/H+ exchange at the apical side of the epithelial cells. This is favoured by the neutral intracellular pH, which favours the intracellular VFA− form, thus increases the gradient of VFAH from the lumen to the epithelial cell. The absorption of VFA− by facilitated diffusion, involving anion-exchange proteins (AE, DRA, PAT) that promote the transfer of bicarbonate from the epithelial cell to the rumen content cannot be ruled out. Extrusion through the basal side partly takes place by passive diffusion of VFAH, but anion exchange (or other transport) proteins may also be involved, although experimental evidence is still lacking.
Most studies conducted in vivo on temporarily isolated rumen showed that the fractional absorption rate of the main VFA (acetate, propionate, butyrate) increases with chain length. Data on minor VFA are only scarce but confirm this trend, and suggest that branched-chain VFA have lower fractional absorption rate than their non-ramified isomers (Oshio and Tahata, Reference Oshio and Tahata1984). The decrease in ruminal pH increases the absorption rate of VFA (Oshio and Tahata, Reference Oshio and Tahata1984; Dijkstra et al., Reference Dijkstra, Boer, van Bruchem, Bruining and Tamminga1993). The reported effects of rumen concentrations of VFA on their fractional absorption rate differ among studies, and may depend on associated changes in pH and/or extent of VFA metabolism in the rumen epithelium that affects the concentration gradient between lumen and blood. The VFA absorption rate is also positively affected by the surface area (Perrier et al., Reference Perrier, Ferchal, Durier and Doreau1994) and thus by liquid volume (Dijkstra et al., Reference Dijkstra, Boer, van Bruchem, Bruining and Tamminga1993), as represented in some rumen models (Dijkstra et al., Reference Dijkstra, Boer, van Bruchem, Bruining and Tamminga1993; Pitt et al., Reference Pitt, van Kessel, Fox, Pell, Barry and van Soest1996). The specific effect of osmolality on VFA absorption rates vary among studies. Whereas some indicate that both water and VFA absorption rates decrease on average of −3%/h and −6%/h, respectively, when osmolality increases of 100 mOsm/l (Oshio and Tahata, Reference Oshio and Tahata1984), others report that VFA absorption rates are maximal when osmolality is close to 350 mOsm/l (Bueno, Reference Bueno1972; Lopez et al., Reference Lopez, Hovell and MacLeod1994), that is, when the net transfer of H2O through the rumen wall is near 0. The fact that VFA largely determines ruminal osmolality may explain the discrepancy among studies.
Quantitative evaluation of absorption rates of VFA
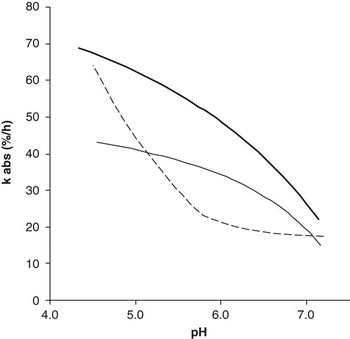
Representation of VFA absorption widely differs among models, with respect to single v. differentiated values for individual VFA and saturated v. unsaturated absorption processes. Moreover, whereas most rumen models include the effect of pH on VFA fractional absorption rate, representation highly differs among models (Figure 2). For example, a Michaelis–Menten function of the ruminal concentration of total VFA (therefore of pH) was retained by Lescoat and Sauvant (Reference Lescoat and Sauvant1995) or Chilibroste et al. (Reference Chilibroste, Dijkstra, Robinson and Tamminga2008), whereas in Dijkstra et al. (Reference Dijkstra, Boer, van Bruchem, Bruining and Tamminga1993) or Pitt et al. (Reference Pitt, van Kessel, Fox, Pell, Barry and van Soest1996), each VFA was considered individually and the response to pH was based on the Henderson–Hasselbach dissociation law (VFA−/VFAH ratio). This latter representation appears to be more consistent with experimental measurements using temporarily isolated rumen. Based on the assumption that absorption rate depends on VFA−/VFAH ratio, thus on pKa, Nozière and Hoch (Reference Nozière and Hoch2006) proposed an empirical equation relying on variation of fractional absorption rates with pH. Based on these results, the effect of pH on VFA fractional absorption rate may be simply represented through the VFA−/VFAH ratio, with fixed values of 16%, 18% and 22%/h for VFA−v. 76%, 102% and 135%/h for VFAH, for acetate, propionate and butyrate, respectively. Recently, based on the assumption that the lower the rumen pH, the more transport results from passive diffusion of VFAH rather than facilitated and saturable transport of VFA− (both driven by rumen concentrations), Bannink et al. (Reference Bannink, France, Lopez, Gerrits, Kebreab, Tamminga and Dijkstra2008) proposed a separate representation of these two routes of VFA absorption, and assumed that transport from epithelium to blood is facilitated and is faster than the facilitated transport from lumen to epithelium. Interestingly, fractional absorption rates of individual VFA predicted by steady-state simulations with the mechanistic model of Bannink et al. (Reference Bannink, France, Lopez, Gerrits, Kebreab, Tamminga and Dijkstra2008) were similar to those obtained by the empirical model of Nozière and Hoch (Reference Nozière and Hoch2006).
Representation of pH effect on fractional absorption rates (kabs) of volatile fatty acids (VFA), according to Michaelis–Menten function (— and  : kabs = kA/1 + (MVFA/[VFA]), with kA = maximum absorption rate, MVFA = Michaelis–Menten affinity constant, and pH linearly related to [VFA]), or to Henderson–Hasselbach dissociation law (---: kabs = ki + (kni-ki)/(1 + 10 pH-pka), with Ki and Kni = fractional absorption rates of ionized and non-ionized form, respectively). After Lescoat and Sauvant (Reference Lescoat and Sauvant1995); Nozière and Hoch (Reference Nozière and Hoch2006); Chilibroste et al. (Reference Chilibroste, Dijkstra, Robinson and Tamminga2008).

Starch intestinal digestion and glucose absorption
High amounts of cereals incorporated in the diet of producing ruminants can induce digestive disorders related to an excessive digestion of starch in the rumen. An increase in the dietary content of rumen digestible starch of 10 g/kg DM drastically affects pH (−0.1 unit), NDF digestion (−3 g/100 g) and the acetate/propionate ratio (−0.4 mol/mol) in the rumen (D. Sauvant, unpublished synthesis of literature data). A shift in the site of starch digestion from rumen to intestines can prevent these disorders, but the energy efficiency of such a strategy remains questionable. Based on a simulation model of starch intestinal digestion in steers, Huntington et al. (Reference Huntington, Harmon and Richards2006) concluded that advantages of digestive efficiency through increasing intestinal starch digestion could only be obtained at low intake or with highly processed feeds. More generally, with conventionally fed animals, there is evidence that a non-negligible proportion (on average 25%) of starch escaping ruminal fermentation is recovered in faeces (Offner and Sauvant, Reference Offner and Sauvant2004b), inducing a decrease in OM digestibility and consequently dietary metabolizable energy (ME). Still, perfusion experiments indicated that at similar energy supply, duodenal glucose is more efficient than ruminal propionate for whole body glucose appearance rate (Rigout et al., Reference Rigout, Hurtaud, Lemosquet, Bach and Rulquin2003; Lemosquet et al., Reference Lemosquet, Delamaire, Lapierre, Blum and Peyraud2009). However, the impact on milk yield and composition remains moderate, as confirmed by a meta-analytical approach (Rulquin et al., Reference Rulquin, Hurtaud, Lemosquet and Peyraud2007). In addition, based on a large database, the response of milk yield to an increase in absorbable C appears to be similar between ruminal propionate (estimated from Table 1, equations (1) and (3)) and intestinal glucose (estimated from Table 1, equation (6)) (D. Sauvant, unpublished synthesis of literature data).
Intestinal starch digestion
Starch escaping ruminal degradation can reach 8 g/day per kg BW (Overton et al., Reference Overton, Cameron, Elliott, Clark and Nelson1995), that is, 70% of starch intake. Starch entering the duodenum is submitted to the activity of pancreatic α-amylase, that hydrolyses both amylose and amylopectin into branched-chain products (limit dextrins, mainly from amylopectin) and oligomers of two or three glucose units. Oligosaccharides are submitted to hydrolysis by brush border oligosaccharidases, that is, maltase and isomaltase. Most of post-ruminal starch digestion (on average 70%) occurs in small intestine, but starch digestibility in the intestine is extremely variable from 10% to 95%. Several studies have assessed factors that limit starch digestion in the small intestine (see reviews by Huntington, Reference Huntington1997; Harmon et al., Reference Harmon, Yamka and Elam2004; Huntington et al., Reference Huntington, Harmon and Richards2006). Briefly, ruminant pancreas seems more responsive to energy intake than to duodenal starch, and the brush border oligosaccharidase activities seem to be poorly responsive to diet. Amylase is likely more limiting than intestinal oligosaccharidase activity in the starch digestion process (Huntington, Reference Huntington1997). Amylase secretion may be enhanced by increasing duodenal entry of protein (Taniguchi et al., Reference Taniguchi, Huntington and Glenn1995), but it has not been clearly demonstrated in conventionally fed animals. The extent of starch digestion in the small intestine can also be limited by surface exposure of starch to enzymes in this compartment. Based on in vivo measurements on dairy cows, several works (Oba and Allen, Reference Oba and Allen2003a and Reference Oba and Allen2003b; Taylor and Allen, Reference Taylor and Allen2005) suggested that the physicochemical characteristics of corn particles limit intestinal starch digestion. Based on in sacco degradation of corn grain, there is evidence that intrinsic factors affecting starch ruminal degradability (particle size, vitreousness) also affect their ability of being digested in the intestines (Ramos et al., Reference Ramos, Champion, Poncet, Mizubuti and Nozière2009).
Based on an extensive review of literature data, an empirical model to predict site and extent of starch digestion from in sacco data has been proposed by Offner and Sauvant (Reference Offner and Sauvant2004b). Compared to previous similar attempts (Nocek and Tamminga, Reference Nocek and Tamminga1991), this model includes the effect of intake level, with an average effect on RSD of −0.083 g/g starch intake, when intake level increases by 1 kg DM/100 kg BW. This effect may likely reflect the influence of intake on turnover rate of particles, which competes with starch degradation. Prediction of starch digestion in the small intestine is based on the negative relationship between starch intestinal digestibility (g/g) and the dietary content of starch escaping ruminal digestion (g/g), with an average slope of −1.22. Prediction of starch digestion in the hindgut is based on an average digestibility of 50% of starch reaching ileum. The first evaluation of this relatively simple model of starch digestion was based on the prediction of faecal starch in cattle and dairy cows, which was itself satisfactorily predicted with a Sy.x of 0.12 kg/day over a target of 0 to 1 kg/day. More mechanistic approaches are still scarce, but some preliminary results have been recently presented by Bannink et al. (Reference Bannink, Ellis, France and Dijkstra2009).
Glucose absorption
Starch hydrolysed into glucose can reach 5 g/day per kg BW (Stock et al., Reference Stock, Brink, Britton, Goedeken, Sindt, Kreikemeier, Bauer and Smith1987), but most of the reported values rarely exceed 3 g/day per kg BW. Whereas the possibility of fermentation of glucose in the small intestine exists (Nicoletti et al., Reference Nicoletti, Davis, Hespell and Leedle1984), it is likely that most of the glucose released in the lumen of the small intestine is subjected to absorption and transit processes. The two main routes for transfer of glucose from the lumen to the bloodstream are active transport and paracellular diffusion with absorption of water (Huntington, Reference Huntington1997). Glucose transporters have been characterized in the small intestine of ruminants (Shirazi-Beechey et al., Reference Shirazi-Beechey, Wood, Dyer, Scott and King1995; Zhao et al., Reference Zhao, Okine, Cheeseman, Shirazi-Beechey and Kennelly1998; Guimaraes et al., Reference Guimaraes, Rodriguez, Matthews, Swanson, Harmon and Branco2007). SGLT1 consists of Na+-dependent glucose transporter located in the brush border membrane of enterocytes, and driven by an electrochemical gradient maintained by Na+/K+ ATPase located on the basolateral membrane. This high-affinity transporter presents a great deal of homology (>80%) between vertebrate species. The SGTL1 transports 1 mol of glucose against 2 mol of Na+ in each of its cycle, with a Km ranging between 0.1 and 0.5 mmol/l, and an estimated capacity of 50 to 200 cycles/s (Ferraris et al., Reference Ferraris, Lee and Diamond1989; Hediger and Rhoads, Reference Hediger and Rhoads1994). GLUT2 functions as a low-affinity transporter localized to both the apical and basolateral membranes of the enterocytes (Kellett et al., Reference Kellett, Brot-Laroche, Mace and Leturque2008). In steers, the absorption capacity for glucose (Krehbiel et al., Reference Krehbiel, Britton, Harmon, Peters, Stock and Grotjan1996; Harmon and McLeod, Reference Harmon and McLeod2001), the uptake activity of glucose transporters (Bauer et al., Reference Bauer, Harmon, Bohnert, Branco and Huntington2001), as well as the basal expression of both SGLT1 and GLUT2 mRNA (Liao et al., Reference Liao, Vanzant, Harmon, McLeod, Boling and Matthews2009), highly vary along the intestinal axis, being the highest in the jejunum and the lowest in the ileum. There is experimental evidence in ruminant that abomasal perfusion of partially hydrolyzed starch or glucose induces a rapid (within a few days) increase in glucose transport capacity (Shirazi-Beechey et al., Reference Shirazi-Beechey, Wood, Dyer, Scott and King1995; Bauer et al., Reference Bauer, Harmon, McLeod and Huntington1995 and Reference Bauer, Harmon, Bohnert, Branco and Huntington2001). This involves increasing mRNA content of glucose transporters, as observed in sheep for SGTL1 (Lescale-Matys et al., Reference Lescale-Matys, Dyer, Scott, Wright and Shirazi-Beechey1993; Shirazi-Beechey et al., Reference Shirazi-Beechey, Wood, Dyer, Scott and King1995) and in ileum of steers for both SGLT1 and GLUT2 (Liao et al., Reference Liao, Vanzant, Harmon, McLeod, Boling and Matthews2009).
A simulation model of starch digestion and glucose uptake from the small intestine was developed by Huntington (Reference Huntington1997). Pancreatic secretions, as well as possibly fermentation of glucose, were not considered. This model considered an active transport, with a quadratic decrease in activity from the proximal to the distal small intestine, and a paracellular diffusion of glucose dependent on luminal glucose concentration. Based on data by Kreikemeier et al. (Reference Kreikemeier, Harmon, Brandt, Avery and Johnson1991), simulations suggested that diffusion represents a small proportion of total absorption (<15% to 20%) at physiological luminal glucose concentrations (<3.5 mM). Simulations also suggested that in adapted animals, the capacity for active transport of glucose across the gut wall does not seem to limit the glucose absorption, whereas starch digestion capacity is the primary limitation.
Metabolism of VFA and glucose by portal-drained viscera
Volatile fatty acids
Mechanisms
This aspect has been extensively reviewed (Rémond et al., Reference Rémond, Ortigues and Jouany1995; Kristensen and Harmon, Reference Kristensen and Harmon2006). Briefly, activation of VFA is the first and limiting step in their metabolism in the portal-drained viscera (PDV). In vitro, the acyl-(acetyl-, propionyl- and butyryl-) CoA synthetase activities in the ruminal epithelium increase with VFA chain length and intake level, and are also regulated by the availability of the different VFA. These regulations favour butyrate activation. Acetate and butyrate metabolism can result in a complete oxidation to CO2 entering the Krebs cycle via acetyl-CoA, and/or in the production of ketones via acetoacetyl-CoA. A low interconversion between acetyl-CoA and acetoacetyl-CoA (produced from the oxidation of butyrate) explains why acetate is preferably oxidized to CO2 while the metabolism of butyrate mainly leads to ketones. Propionate can enter the Krebs cycle via succinyl-CoA for complete oxidation to CO2, or via malate before being metabolized in the extra-mitochondrial space into pyruvate, lactate or alanine, as observed in vitro. However, in vivo experiments based on simultaneous ruminal infusions of propionate (up to 1.6 mmol/h per kg BW) and measurements of net portal appearance of nutrients suggest that its conversion to lactate or other products is quantitatively low (Nozière et al., Reference Nozière, Martin, Rémond, Kristensen, Bernard and Doreau2000; Majdoub et al., Reference Majdoub, Beylot, Vermorel and Ortigues-Marty2003; Kristensen and Harmon, Reference Kristensen and Harmon2004). Valerate is metabolized to acetyl-coA and propionyl CoA by β-oxidation and can thus produce both β-hydroxybutyrate and lactate in vitro. Isobutyrate can be metabolized in methyl-malonic or succinic acid.
Quantitative evaluation
The extent of VFA metabolism by PDV has long been approached in vivo through measurements of net portal recovery of ruminally produced (or infused) VFA (review by Rémond et al., Reference Rémond, Ortigues and Jouany1995). It is now well established that this approach overestimates PDV metabolism, due to the confounding effect between microbial and tissular metabolism. Kristensen (Reference Kristensen2001) showed in vivo that up to 28% of the amount of 13C infused in the rumen as [2-13C]-acetate was recovered in non-acetate VFA (20%) or in the duodenal microbial matter as fatty acids or aminoacids (8%). Nozière et al. (Reference Nozière, Gachon and Doreau2003) showed in vitro that 14C supplied as [2-14C]-propionate was incorporated within bacteria and protozoa. This incorporation was estimated to account for 10% of net propionate production, and may be attributed to odd-chain fatty acid synthesis. Recent results obtained with the temporarily isolated washed rumen method in both sheep and steers (Kristensen and Harmon, Reference Kristensen and Harmon2006) support the hypothesis that absorbed at first pass, acetate, propionate and isobutyrate are almost fully recovered in the portal vein (portal recovery of 105% to 109%, 91% to 95%, 101% to 102%, respectively), whereas ruminal epithelium extensively metabolizes butyrate and valerate (portal recovery of 18% to 52%, 16% to 54%, respectively). These results also support a low production of acetate by the rumen epithelium, as noted in vitro (Sehested et al., Reference Sehested, Diernas, Moller and Skadhauge1999). At second pass, the PDV take up a large amount (20% to 40%) of the arterial acetate supply. This uptake appears to be non-linearly related to arterial supply (Nozière and Hoch, Reference Nozière and Hoch2006), and probably concerns tissues other than the ruminal epithelium. Assuming that 80% of the amount of acetate used by PDV is oxidized (Pethick et al., Reference Pethick, Lindsay, Barker and Northrop1981), this uptake could account for 50% of the ATP used by PDV. Based on results of Kristensen et al. (Reference Kristensen, Pierzynowski and Danfaer2000b) on sheep, the low net portal recovery of butyrate (20%) can be attributed to ketogenesis in the rumen wall with production of β-hydroxybutyrate (45%) and acetocetate (15%), and to oxidation (20%). The PDV (likely tissues other than the ruminal epithelium) also take up a substantial amount of arterial β-hydroxybutyrate (Kristensen et al., Reference Kristensen, Pierzynowski and Danfaer2000b), quantified at 13% of the arterial supply to PDV in sheep.
Data on in vivo interactions between VFA within the PDV are scarce. Unlike observations in vitro, Kristensen et al. (Reference Kristensen, Pierzynowski and Danfaer2000a) reported no significant effect in vivo of short-term infusions (12 h) of butyrate on the net portal recovery of acetate and isobutyrate, while recovery of propionate tended to increase as also noted with long-term infusions (1 week) (Nozière et al., Reference Nozière, Martin, Rémond, Kristensen, Bernard and Doreau2000). In both studies, a positive effect of ruminal butyrate infusion on the net portal recovery of butyrate and valerate was shown. Taken together, in vivo observations on PDV, when compared to in vitro observations on ruminal epithelium, suggest the existence of an acyl-CoA synthetase with a preferential affinity for butyrate and valerate, which may activate acetate, propionate and isobutyrate when preferential substrates are lacking. Although propionate metabolism by the ruminal epithelium appears limited in vivo, in vitro data support the fact that propionate counteracts the depressing effect of acetate on the formation of β-hydroxybutyrate from butyrate in the ruminal epithelium (Baldwin and Jesse, Reference Baldwin and Jesse1996). This probably results from a shift in the mitochondrial NADH/NAD status. In vitro, the affinity for and the capacity of isolated rumen epithelial cells to oxidize substrates are largely unaffected by ME intake or the dietary forage : concentrate ratio, suggesting that the ruminal environment may not affect the cellular capacity of the ruminal epithelium to oxidize substrates (Baldwin and McLeod, Reference Baldwin and McLeod2000).
The main efforts on mechanistic representations of epithelial metabolism of VFA were made by Bannink et al. (Reference Bannink, France, Lopez, Gerrits, Kebreab, Tamminga and Dijkstra2008). The activation of VFA by CoA-synthetase was assumed to be irreversible, and the rate limiting step of the intraepithelial metabolism. The competitive inhibition among VFA was represented. The epithelial metabolism of VFA was assumed to provide all energy required by the epithelium, which itself is affected by VFA load. These functional adaptations of rumen epithelia are represented by a feedback control mechanism, and include representation of both papillae shape and epithelial mass. Simulations, including this adaptative response, have large impacts on the predicted VFA absorption rates and extent of intra-epithelial metabolism of acetate and propionate, whereas it is recognized that more appropriate parameterization of CoA-synthetase activities is required. In addition, it is noticeable that possible interconversions between VFA in the epithelium and metabolism of arterial VFA (acetate) are not represented. Recently developed molecular approaches appear promising to assess the regulation of expression of genes encoding for enzymes involved in VFA metabolism (ACAS2L, BUCS1, BCKDHA, etc.) (Baldwin et al., Reference Baldwin, El-Kadi, McLeod, Connor and Bequette2007).
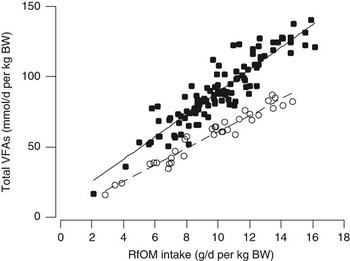
Empirical approaches based on meta-analysis have been developed at INRA to account for prediction of net portal appearance of VFA from dietary characteristics. The Flora database (Vernet and Ortigues-Marty, Reference Vernet and Ortigues-Marty2006), gathering results of portal nutrient fluxes and presenting a homogeneous characterization of dietary treatments according to INRA feed tables was used (Loncke et al., Reference Loncke, Ortigues-Marty, Vernet, Lapierre, Sauvant and Nozière2009b). We showed that, net portal appearance of total VFA was linearly and closely related to estimated RfOM intake across a wide diversity of experimental factors (Table 1, equation (7)). The slope suggests a net portal appearance of 5.9 mol (±0.5) of VFA/kg RfOM. The comparison with the slope obtained on ruminal VFA production using the same principles (8.0 mol/kg RfOM, equation (1)), suggests a net portal recovery of 75% of VFA produced in the rumen (Figure 3). Moreover, changes in VFA molar proportions in the portal flow appear largely explained by changes in the dNDF/RfOM ratio (equations (8) to (10)) that was fully consistent with observations in the rumen (equations (2) to (4)). In addition, net portal appearance of β-hydroxybutyrate that results from both ruminal ketogenesis and uptake of arterial β-hydroxybutyrate by PDV, appears closely related to RfOM intake (equation (12)).
Effect of rumen fermentable organic matter (RfOM) intake on ruminal production (●) and net portal appearance (○) of total volatile fatty acids (VFA): adjusted within-experiment models (cf Table 1, equations (1) and (7), respectively). After Nozière et al. (Reference Nozière, Glasser, Loncke, Ortigues Marty, Vernet and Sauvant2010); Loncke et al. (Reference Loncke, Ortigues-Marty, Vernet, Lapierre, Sauvant and Nozière2009b).

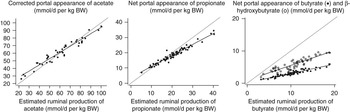
As discussed above, although there are some differences in VFA profiles between concentration and net production in the rumen, the estimation of the production rate of individual VFA using combinations of total VFA-PR and VFA profiles models (Table 1, equations (1) to (4)) appear closely related to their net portal appearance (Figure 4). The relationships appear quantitatively consistent with knowledge on the extent of PDV metabolism of VFA, that is, a preferential uptake of butyrate and a negligible uptake of acetate during first pass. Indeed, when portal appearance is corrected for PDV uptake of arterial acetate (according to the exponential relationship between arterial supply and uptake proposed by Nozière and Hoch, Reference Nozière and Hoch2006), the relationship between the estimated ruminal production of acetate and the first pass portal appearance of acetate does not significantly differ from the first bisector. In addition, propionate appears largely recovered, whereas 25% of butyrate is recovered as butyrate and 46% as β-hydroxybutyrate. This result also suggests that whereas high levels of butyrate infused in the rumen may induce saturation of ketogenesis in the rumen wall (Krehbiel et al., Reference Krehbiel, Harmon and Schneieder1992; Nozière et al., Reference Nozière, Martin, Rémond, Kristensen, Bernard and Doreau2000), this upper limit is likely not achieved in conventionally fed animals. Interestingly, in steady-state simulations, the portal recovery of individual VFA predicted with the mechanistic model of Bannink et al. (Reference Bannink, France, Lopez, Gerrits, Kebreab, Tamminga and Dijkstra2008) was similar to that of the present empirical approach.
Relationships between estimated volatile fatty acids production in the rumen (cf Table 1, equations (1) to (4)), and their measured net portal appearance. Portal fluxes of acetate are corrected for uptake of arterial acetate by portal drained viscera (Nozière and Hoch, Reference Nozière and Hoch2006): adjusted within-experiment models (Nozière et al., Reference Nozière, Glasser, Loncke, Ortigues Marty, Vernet and Sauvant2010).

Glucose
A net portal uptake of glucose is observed when no or only a little amount of starch escapes ruminal fermentation. When a substantial amount of starch, dextrin or glucose is infused in the abomasum, the portal flux of glucose shifts from net uptake to net appearance, but the net portal recovery is not complete ranking from 57% to 73% of glucose infused and from 25% to 51% of starch infused, depending on experimental conditions (Lindsay and Reynolds, Reference Lindsay and Reynolds2005). This is partly due to increased use of arterial glucose by PDV (Janes et al., Reference Janes, Weekes and Armstrong1985). However, with conventionally fed animals, this appears not associated with an increase in oxygen consumption by PDV (Reynolds et al., Reference Reynolds, Humphries, Cammell, Benson, Sutton and Beever1998; Nozière et al., Reference Nozière, Rémond, Lemosquet, Chauveau, Durand and Poncet2005), suggesting that other substrates are conserved (Huntington et al., Reference Huntington, Harmon and Richards2006). Within the PDV, the mesenteric-drained viscera (MDV) are the main users of arterial glucose, contributing to 70% of glucose uptake, as observed with non-starchy diet (Reynolds and Huntington, Reference Reynolds and Huntington1988). With diets rich in maize that induce a large amount of starch entering duodenum, the increased use of arterial glucose occurs in both stomach and MDV tissues (Reynolds and Huntington, Reference Reynolds and Huntington1988). Given the high increased use of arterial glucose by PDV, the apparent portal (or mesenteric) recovery of glucose is thus underestimated when expressed as a net basis; it is substantially increased when changes in arterial uptake by PDV are taken into account but remains incomplete (from 51% to 71%; Harmon et al., Reference Harmon, Richards, Swanson, Howell, Matthews, True, Huntington, Gahr and Russell2001). Based on calculation of the area under the curve of net portal (or mesenteric) fluxes of glucose against time following a starchy meal in sheep (Rémond et al., Reference Rémond, Bernard, Savary-Auzeloux and Nozière2009) or an abomasal pulse of glucose in dairy cow (Larsen and Kristensen, Reference Larsen and Kristensen2007), first pass recovery of glucose may be almost complete. The ‘lost’ glucose may be attributed to metabolism of glucose within the small intestine to supply glycerol for the absorption of long-chain fatty acids, as suggested by Reynolds et al. (Reference Reynolds, Huntington, Tyrrell and Reynolds1988). It may also be partly due to residual microbial fermentation of glucose after hydrolysis of starch in the small intestine, as suggested by Larsen and Kristensen (Reference Larsen and Kristensen2007). The contribution of arterial glucose to lactate net portal release remains unclear. There is in vitro experimental evidence that ruminant enterocytes possess metabolic flexibility for oxidative metabolism of glucose, glutamine and glutamate depending on the type and concentration of available additional substrates (Oba et al., Reference Oba, Baldwin and Bequette2004).
An empirical approach was developed for a quantitative prediction of the net portal appearance of glucose based on knowledge of starch digestion (Offner and Sauvant, Reference Offner and Sauvant2004b; Loncke et al., Reference Loncke, Ortigues-Marty, Vernet, Lapierre, Sauvant and Nozière2009b). A close and linear relationship was observed between the predicted amount of starch apparently digested in the small intestine (Table 1, equation (7)) and the actual net portal appearance of glucose (equation (12)). This relationship presented no interfering factors, and the Sy.x was rather low (0.035 mmol/h per kg BW). The intercept of this relationship suggested a basal use of arterial glucose by PDV averaging 0.103 mmol/h per kg BW, which is consistent with the basal net uptake of glucose observed with non-starch diets. The slope suggested a net portal recovery of averaging 44%, which is consistent with the average increment of net portal flux of glucose observed in abomasal infusions experiments, as discussed above.
Liver metabolism of VFA and glucose
Mechanisms
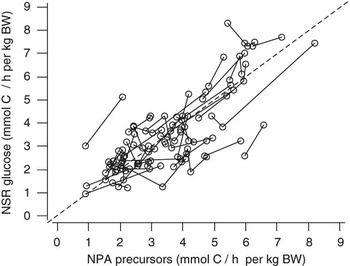
Hepatic VFA metabolism in ruminants has been extensively reviewed (Brockman, Reference Brockman2005; Hanigan, Reference Hanigan2005; Lindsay and Reynolds, Reference Lindsay and Reynolds2005; Kristensen and Harmon, Reference Kristensen and Harmon2006) and only a few points will be highlighted here. The non-ionized forms present in very low proportions in the portal blood are absorbed passively through hepatocyte membranes (Bergman, Reference Bergman1990). The influx of the most frequent ionic forms is carrier mediated, via monocarboxylate transporters recently shown in the liver of ruminants (Koho et al., Reference Koho, Maijala, Norberg, Nieminen and Pösö2005; Kirat et al., Reference Kirat, Inoue, Iwano, Yokota, Taniyama and Kato2007). Cytosolic short chain fatty acids then enter mitochondria via monocarboxylate carrier or mitochondrial carnitine transporter (Zammit, Reference Zammit1990), where they are esterified as CoA esters by specific synthetases. Even-chain fatty acids (acetate, butyrate) are differently taken up by the liver. Hepatic metabolism of acetate is limited, being simultaneously oxidized and produced (Reynolds, Reference Reynolds2002) while butyrate is largely taken up by the liver. Both fatty acids are rather oriented towards ketogenesis and lead to the same metabolite acetyl-CoA, which can enter the Krebs cycle to be oxidized. Their metabolism interacts with that of all nutrients, which can also be converted to acetyl CoA. Free acetate can also be formed from acetyl-CoA and from both peroxisomal and mitochondrial fatty acid oxidation (Drackley, Reference Drackley1999 in dairy cows). Among nutrients potentially oxidized in the liver for ATP production, the contribution of acetate and butyrate has been questioned. Net hepatic uptake of acetate is much lower than that of butyrate (Reynolds, Reference Reynolds2002), but acetate is more efficient to produce ATP than butyrate (Gallis et al., Reference Gallis, Tissier, Gin and Beauvieux2007) and estimation of ATP production from hepatic acetate utilization may lead to underestimation. Ketogenesis is the major metabolic fate for butyrate (Heitmann et al., Reference Heitmann, Dawes and Sensenig1987). Butyrate has recently been shown to exert specific properties on human hepatocyte growth and differentiation (Yoon et al., Reference Yoon, Lee, Lee, Park and Kim1999), but evidence in ruminants is still lacking. Odd-chain fatty acids, in particular propionate, take a different enzymatic pathway leading to succinyl-CoA. Two of the propionate metabolites (propionyl-CoA and 2-methylcitrate) having inhibitory effects on the Krebs cycle (Nguyen et al., Reference Nguyen, Morland, Gonzalez, Rise, Storm-Mathisen, Gundersen and Hassel2007), propionate is largely used as a precursor of gluconeogenesis. Considering the limited absorption of glucose, and the similar whole body glucose requirements in ruminants and monogastrics (Lindsay, Reference Lindsay1981), ruminants rely on hepatic gluconeogenesis for 85% of their whole body glucose turnover (Ortigues-Marty et al., Reference Ortigues-Marty, Obled, Dardevet and Savary-Auzeloux2003a). Glucose is synthesized from three carbon precursors, propionate (for up to 50% to 70%; Veenhuizen et al., Reference Veenhuizen, Russell and Young1988; Bergman, Reference Bergman1990), AAs (mainly Ala, Gln and Gly) from 11% to 40% (Kraft, Reference Kraft2009), l-lactate (7% to 44%; Krehbiel et al., Reference Krehbiel, Harmon and Schneieder1992) and glycerol (5%; Brockman, Reference Brockman2005) and may be stored temporarily in the liver as glycogen. Contributions of individual precursor may vary widely with the nutritional status of the animal. Major key limiting gluconeogenic enzymes are phosphoenolpyruvate carboxykinase and pyruvate kinase. Relative expression and activity of these enzymes are indicators of gluconeogenic activity and of precursor contributions (Velez and Donkin, Reference Velez and Donkin2005).
Strong interactions exist between ketogenic and glucogenic metabolism in the liver. Ketogenesis is down regulated by glucogenic metabolism (Berthelot et al., Reference Berthelot, Pierzynowski, Sauvant and Kristensen2002). In rat hepatocytes this down regulation is partly counteracted by carnitine (Brass and Bayerinck, Reference Brass and Bayerinck1988), but evidence in ruminants is lacking. Conversely, medium chain fatty acids inhibit ovine hepatic gluconeogenesis and propionate metabolism in vitro (Chow and Jesse, Reference Chow and Jesse1992). Butyrate has similar effects in vitro in bovine hepatocytes (Aiello et al., Reference Aiello, Armentano, Bertics and Murphy1989). Acute supply of butyrate has also a sparing effect on both hepatic glucose oxidation and glycogen storage as shown in rats (Beauvieux et al., Reference Beauvieux, Roumes, Robert, Gin, Rigalleau and Gallis2008).
Finally, VFA have long been considered mostly as providers of carbon or energy, and apart from their regulatory role on intake, no other regulatory role has been investigated at cellular level. Recently, a cellular signalling role has been demonstrated for the C2 to C6 short-chain fatty acids as activators of G protein-coupled receptors in mice adipocytes and stimulators of leptin production. This mechanism is suspected in mice to be involved in the regulation of intake by chronic propionate (Brown et al., Reference Brown, Goldsworthy, Barnes, Eilert, Tcheang, Daniels, Muir, Wigglesworth, Kinghorn, Fraser, Pike, Strum, Steplewski, Murdock, Holder, Marshall, Szekeres, Wilson, Ignar, Foord, Wise and Dowell2003; Xiong et al., Reference Xiong, Miyamoto, Shibata, Valasek, Motoike, Kedzierski and Yanagisawa2004). The relevance for ruminants is not yet known.
Quantitative evaluation
Quantitative measurements of hepatic metabolism are mainly based on the arterio-venous method. Considering the small arterio-venous differences, the risk of inaccuracy in the results may be greater than for measurements of net portal appearance depending on the metabolite. This ‘black box’ approach has more recently been coupled with the infusion of labelled molecules in order to better evaluate the metabolic fate of nutrients. Besides, a number of mechanistic models of liver metabolism have been elaborated to reconcile quantitative information with biochemical knowledge on the different metabolic pathways and their regulation in the liver. All existing models apply to lactating cows, and deal mostly with nitrogen metabolism. Nevertheless, a few models represent VFA or glucose metabolism as subcomponents of whole animal models (Waghorn, Reference Waghorn1982; Baldwin et al., Reference Baldwin, France and Gill1987a; Danfaer, Reference Danfaer1990; Martin and Sauvant, Reference Martin and Sauvant2007) or with isotope tracer components (Freetly et al., Reference Freetly, Knapp, Calvert and Baldwin1993) and more recently a model of ketosis has been developed (Guo et al., Reference Guo, Peters and Kohn2008). In addition, although promising for development of further models, the hormonal effects on carbohydrate metabolism have been rarely included in liver models (Danfaer, Reference Danfaer1990). Limited quantitative evaluation and comparison of these models has been published. More generic quantitative information was derived recently from the Flora database (Vernet and Ortigues-Marty, Reference Vernet and Ortigues-Marty2006) using data obtained in different physiological statuses (growing, gestating, lactating, non-producing) in both sheep and cattle.
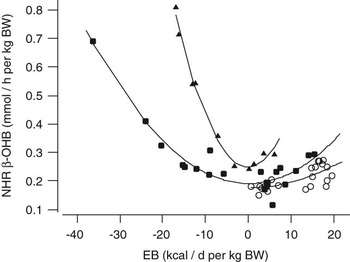
No simple mass action law exists between hepatic input and output of ketogenic nutrients. On a net hepatic flux basis, metabolism of acetate seems limited in the liver because it may be simultaneously oxidized and produced (Reynolds, Reference Reynolds1995). Mechanistic models in lactating cows predict a net hepatic acetate release (Freetly et al., Reference Freetly, Knapp, Calvert and Baldwin1993). An empirical modelling approach recently showed that net hepatic release may reach 0.32 to 0.56 mmol/h per kg BW, representing 20% of acetate net portal appearance in lactating cows and 10% in growing ruminants (Loncke, Reference Loncke2009) with different contributions from dietary and endogenous fatty acids. However, our results do not confirm the prediction that net hepatic acetate release increases with the long chain fatty acid supply (Hanigan et al., Reference Hanigan, Crompton, Reynolds, Wray-Cahen, Lomax and France2004, cited by Drackley and Anderson, Reference Drackley and Anderson2006). By contrast, butyrate is largely taken up by the liver (from 0.05 to 0.19 mmol/h per kg BW), with an average net uptake rate of 76% of net portal appearance. Net hepatic uptake is however lower in growing-fattening ruminants probably due to a higher insulinemia (Loncke, Reference Loncke2009). Plasma ketone bodies (β-hydroxybutyrate + acetoacetate + acetone) accumulation has also been predicted in periparturient cows from body fat mobilization (itself a function of BW and condition score plus an estimation of glucose deficiency) and utilization (Guo et al., Reference Guo, Peters and Kohn2008). More precisely, net hepatic release of β-hydroxybutyrate was clearly shown by empirical models to be driven both by digestive (acetate, butyrate, long chain fatty acids) and endogenous precursor (non-esterified fatty acids) supply, depending on the energy balance of the animal (Figure 5; Loncke, Reference Loncke2009). In most models estimation of body fat mobilization and hepatic utilization is a common difficulty (Freetly et al., Reference Freetly, Knapp, Calvert and Baldwin1993; Danfaer, Reference Danfaer1994; Guo et al., Reference Guo, Peters and Kohn2008). Inaccurate estimation is probably responsible for a general carbon deficit identified in mechanistic models of liver metabolism (Hanigan et al., Reference Hanigan, Crompton, Reynolds, Wray-Cahen, Lomax and France2004). Recently, metabolic pathways related to non-esterified fatty acids have been included in the model by Martin and Sauvant (Reference Martin and Sauvant2007).
Relationships between energy balance (EB) and net hepatic release of β-hydroxybutyrate (NHR β-OHB) in lactating (▴), growing-fattening (●) and non-producting (○) ruminants: adjusted within-experiment models. After Loncke (Reference Loncke2009).

As for net hepatic glucose release (ranging from 0.67 to 1.74 mmol/h per kg BW), conditions in which, in ruminants, hepatic gluconeogenesis is regulated by precursor availability or by other signals (e.g. portal signal, Moore et al., Reference Moore, Hsieh, Flakoll, Neal and Cherrington1999) is not totally clear cut. In non-lactating ruminants, glucose turnover increases linearly with ME intake, although the increase was higher for growing as compared with non-productive ruminants (Ortigues-Marty et al., Reference Ortigues-Marty, Vernet and Majdoub2003b). In lactating cows, milk yield increased with the supply of gluconeogenic precursors from digestive origin (ruminal propionate + intestinal glucose) up to a plateau (Rigout et al., Reference Rigout, Hurtaud, Lemosquet, Bach and Rulquin2003), but the energy secreted in milk lactose linearly responds to ME intake (Sauvant et al., Reference Sauvant, Martin and Mertens2009). Assuming that milk yield is highly dependent on glucose availability, this suggests that glucose turnover follows the same pattern. Unfortunately, a very limited number of studies measured simultaneously all the different glucose precursors in different nutritional and physiological conditions. Relationships between net hepatic precursor uptake and glucose release are usually studied separately for each precursor. Propionate is largely metabolized in the liver (from 0.08 to 1.79 mmol/h per kg BW depending on the feeding level and nature of diet), with 85% to 100% of net portal appearance being taken up (Majdoub, Reference Majdoub2002), 91% on average based on empirical relationships (Loncke, Reference Loncke2009). The liver highly contributes to prevent the systemic toxicity of propionate. A fixed conversion rate of propionate into glucose is used in Molly (Baldwin et al., Reference Baldwin, France and Gill1987a) and in the model of Martin and Sauvant (Reference Martin and Sauvant2007). However, increased availability of propionate does not ensure increased hepatic glucose synthesis (Majdoub et al., Reference Majdoub, Beylot, Vermorel and Ortigues-Marty2003; Ortigues-Marty et al., Reference Ortigues-Marty, Vernet and Majdoub2003b). A subsequent dynamic model of liver metabolism clearly suggested that in vitro glucose production approaches saturation as propionate supply increases (Baldwin and Freetly, Reference Baldwin and Freetly1995). The quantitative contribution of AAs to hepatic gluconeogenesis has been difficult to evaluate. A majority of results is based on net α-amino-nitrogen fluxes, whereas only gluconeogenic AAs are involved (Hanigan et al., Reference Hanigan, Crompton, Reynolds, Wray-Cahen, Lomax and France2004) and their hepatic supply and metabolism does not strictly depend on intestinal absorption but also from metabolism in the different tissues. Their contribution varies with the balance between availability in gluconeogenic precursors, whole body glucose demand and utilization as well as whole body AA demand (Kraft, Reference Kraft2009). During body store mobilization as in feed restriction or lactation, contribution of endogenous precursors (in particular AAs from muscle proteolysis) increases (Lomax et al., Reference Lomax, Donaldson and Pogson1986). It is also the case when glucose demand increases, such as after phlorizin treatment of lactating cows (Overton et al., Reference Overton, Drackley, Ottemann-Abbamonter, Beaulieu, Emert and Clark1999). Conversely when protein anabolism increases after growth hormone infusion (Knapp et al., Reference Knapp, Freetly, Reis, Calvert and Baldwin1992), AAs are spared for protein synthesis. Recently, dietary deficits in PDI or ME (by 20% to 23%) reduced net hepatic glucose release in growing lambs by 41% and 33%, respectively. Sparing of AAs or adjustment of their hepatic metabolism to modifications in whole body protein anabolism were probably involved (Kraft, Reference Kraft2009; Loncke et al., Reference Loncke, Kraft, Savary-Auzeloux and Ortigues-Marty2009a). Finally, l-lactate, another potentially important precursor of hepatic gluconeogenesis can be either largely taken up (up to 1.94 mmol/h per kg BW) or released (up to 0.11 mmol/h per kg BW) by the liver (Loncke, Reference Loncke2009). Its potential contribution appears extremely variable (from 7% to 44%; Krehbiel et al., Reference Krehbiel, Harmon and Schneieder1992). Little can be further gained by the study of individual precursors. Consequently, an attempt has been made to elaborate empirical relationships between the net hepatic uptake of the summed precursors (after prediction of missing values, Loncke et al., Reference Loncke, Ortigues-Marty, Vernet, Lapierre, Sauvant and Nozière2009b) and net hepatic glucose release (Loncke, Reference Loncke2009). Preliminary results suggest that net hepatic glucose release increases with precursor availability, and that this relationship is subject to several influent factors which remain to be quantitatively established (Figure 6 and Loncke, Reference Loncke2009).
Relationships between estimated net portal appearance (NPA) of glucogenic precursors and observed net splanchnic release of glucose: raw data. After Loncke (Reference Loncke2009).

Conclusion
Mechanisms and factors involved in site, extent and rate of carbohydrate digestion have been extensively studied through the last decades, providing a considerable amount of published data. The PDV and liver metabolism have been less studied, but the amount of published results is now substantial. Hence, despite the improved mathematical representation of physiological mechanisms enlightened by these experimental efforts, it should be recognized that the ability of published mechanistic models to predict nutrient fluxes seems to remain poor. The development of appropriate statistical methods of meta-analyses applied to the large corpus of published data gathered in bibliographic databases and carefully treated by adequate statistic tools, yielded promising results. Beyond the quantitative integration of knowledge in terms of response laws, important biological properties of system may emerge from this approach. For example, whereas it appears that representation of fluxes from lumen to portal blood may be largely restricted to action-mass laws, fluxes through the liver appear to involve both push and pull driving forces, that empirical modelling helped to dissociate. The potential synergy between empirical and mechanistic modelling should be largely useful to progress towards more accurate mechanistic models, and development of multi-objectives feed evaluation systems based on nutrient fluxes.