1. Introduction
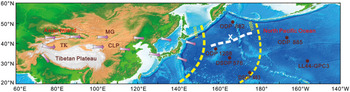
Aeolian dust archived in deep-sea sediments (Hovan et al. Reference Hovan, Rea, Pisias and Shackleton1989; Rea, Reference Rea1994; Larrasoaña et al. Reference Larrasoaña, Roberts, Rohling, Winklhofer and Wehausen2003, Reference Larrasoaña, Roberts and Rohling2008, Reference Larrasoaña, Roberts, Chang, Schellenberg, FitzGerald, Norris and Zachos2012; Ziegler et al. Reference Ziegler, Murray, Hovan and Rea2007; Bailey et al. Reference Bailey, Liu, Swann, Jiang, Sun, Zhao and Roberts2011; Zhang et al. Reference Zhang, Liu, Li and Sun2018a), ice cores (Biscaye et al. Reference Biscaye, Grousset, Revel, Van Der Gaast, Zielinski, Vaars and Kukla1997) and continental profiles (Maher & Thompson, Reference Maher and Thompson1992, Reference Maher and Thompson1995; Maher, Reference Maher1998; An et al. Reference An, Kutzbach, Prell and Porter2001; Guo et al. Reference Guo, Ruddiman, Hao, Wu, Qiao, Zhu, Peng, Wei, Yuan and Liu2002; Sun et al. Reference Sun, Clemens, An and Yu2006; Nie et al. Reference Nie, Stevens, Rittner, Stockli, Garzanti, Limonta, Bird, Andò, Vermeesch, Saylor, Lu, Breecker, Hu, Liu, Resentini, Vezzoli, Peng, Carter, Ji and Pan2015, Reference Nie, Pullen, Garzione, Peng and Wang2018) can record palaeoclimatic and palaeoenvironmental changes at different timescales. The generation, discharge, transportation and deposition processes of aeolian particles are all strongly associated with climatic and environmental conditions in source areas (Harrison et al. Reference Harrison, Kohfeld, Roelandt and Claquin2001; Kohfeld et al. Reference Kohfeld, Le Quere, Harrison and Anderson2005). The Asian interior, as the major dust emission centre (Engelbrecht & Derbyshire, Reference Engelbrecht and Derbyshire2010), provides abundant aeolian materials conveyed by the transporting wind system (Merrill et al. Reference Merrill, Uematsu and Bleck1989) to the North Pacific Ocean (NPO) (Fig. 1). This ‘source-to-sink’ process can shed light on palaeoclimatic changes and palaeoenvironmental transitions in the Asian inland, as well as the evolutionary history of Northern Hemisphere atmospheric circulation (Rea et al. Reference Rea, Snoeckx and Joseph1998; Kohfeld & Harrison, Reference Kohfeld and Harrison2001; Shen et al. Reference Shen, Wan, France-Lanord, Clift, Tada, Révillon, Shi, Zhao, Liu, Yin, Song and Lia2017; Zhang & Liu Reference Zhang and Liu2018b).
Pattern of Asian aeolian dust from source to sink. The brown circles indicate sites or holes in the NPO. DSDP and ODP indicate Deep Sea Drilling Program and Ocean Drilling Program, respectively. The dashed yellow lines indicate the fluxes of mineral aerosol to the oceans (in mg cm−2 ka−1; Duce et al. Reference Duce, Liss, Merrill, Atlas, Buat-Menard, Hicks, Miller, Prospero, Arimoto, Church, Ellis, Galloway, Hansen, Jickells, Knap, Reinhardt, Schneider, Soudine, Tokos, Tsunogai, Wollast and Zhou1991). ‘X’ with dashed white line indicates southern limit ice-rafted debris (Bigg et al. Reference Bigg, Clark and Hughes2008). The pink arrows indicate the trajectories of westerlies (Merrill et al. Reference Merrill, Uematsu and Bleck1989). TK: Taklimakan, MG: Mongolia, CLP: Chinese Loess Plateau.

Nearly identical variation tendencies for the NPO aeolian dust signals have been extracted from several deep-sea holes, such as LL44-GPC3 (Janecek & Rea, Reference Janecek and Rea1983), DSDP Site 576 (Janecek, Reference Janecek, Heath and Burckle1985) and ODP Site 885/886 (Snoeckx et al. Reference Snoeckx, Rea, Jones, Ingram, Rea, Basov, Janecek, Palmer-Julson and Andel1995) in the NPO, which reflect the changes in natural conditions in the Asian inland since the Cenozoic era. Recent results showed that high-resolution aeolian records in circumjacent Northwest Pacific Ocean regions responded significantly to both global cooling and uplift of the Himalayan–Tibetan plateau (Shen et al. Reference Shen, Wan, France-Lanord, Clift, Tada, Révillon, Shi, Zhao, Liu, Yin, Song and Lia2017). On the one hand, dust can be used to reconstruct the past climate changes. On the other hand, dust can also directly affect climate. For example, the wind-borne minerals can impact the radiative balance of the Earth by modifying cloud properties (Arimoto, Reference Arimoto2001). In addition, aeolian inputs into the ocean could affect the marine ecosystem through iron fertilization (Martin et al. Reference Martin, Gordon and Fitzwater1991), and in turn influence the uptake of atmospheric CO2 and global carbon cycle. Therefore, it is essential to determine the evolutionary history of the Asian aeolian dust to fully understand global palaeoclimatic changes.
The major concern for aeolian dust studies lies in how to accurately and efficiently extract the aeolian signals from bulk sediments. The chemical separation uses acetic acid, NaOH (stronger) or Na2CO3 (milder), and sodium dithionite to remove calcium carbonate, opal and oxides (hydroxides), respectively (Rea & Janecek, Reference Rea, Janecek, Thiede and Vallier1981; Clemens & Prell, Reference Clemens and Prell1990). However, this method may be more or less affected by other non-aeolian components, such as volcanic ash (Ziegler et al. Reference Ziegler, Murray, Hovan and Rea2007) and ice-rafted debris (Bigg et al. Reference Bigg, Clark and Hughes2008). Hence, the separated residue after these procedures is usually regarded as ‘operationally defined eolian dust’ (Rea & Janecek, Reference Rea, Janecek, Thiede and Vallier1981; Olivarez et al. Reference Olivarez, Owen and Rea1991), instead of true aeolian materials from the mainland. In spite of this, the chemical extraction has been widely used in the study of NPO aeolian dust (Rea & Janecek, Reference Rea, Janecek, Thiede and Vallier1981; Clemens & Prell, Reference Clemens and Prell1990; Sun & Liu, Reference Sun and Liu2007).
The quartz, major and trace elements with mathematical factor analysis, and isotope have been also applied for aeolian research. Quartz is one of the most stable minerals, and thus can carry reliable aeolian signals. Wan et al. (Reference Wan, Jiang and Anchun2003) investigated the concentration and morphology of quartz in sediments from the South China Sea and evaluated the evolutionary history of the East Asian monsoon over the past 10 Ma. Based on the analytical and statistical procedure for the major/trace elements data of the NPO deep-sea sediments, Weber et al. (Reference Weber, Owen, Dickens, Halliday, Jones and Rea1996) extracted a more refined aeolian ‘signal’ that may be affected by volcanic detritus. Crustal 4He can be delivered to the seafloor sediments, and the delivery rate of 4He can be used as an aeolian proxy, but influences from other terrigenous components could be significant (Patterson et al. Reference Patterson, Farley and Norman1999).
The distinct glaciations–interglaciations variation characteristics of aeolian dust flux can be detected widely in the holes of the Northwest Pacific Ocean, such as V21-146 (Hovan et al. Reference Hovan, Rea, Pisias and Shackleton1989) and KK7502 (Janecek & Rea, Reference Janecek and Rea1985); however, this situation is vague in the equatorial Pacific Ocean (Rea, Reference Rea1994). Anderson et al. (Reference Anderson, Fleisher and Lao2006) applied the 230Th normalization technique to derive dust flux from central equatorial Pacific Ocean sediments and revealed that variation of aeolian fluxes to this region was positively correlated with global ice volume changes throughout the past 300 ka.
Apart from these conventional methods, a series of parameters and diagrams focused on magnetic minerals (Thompson & Oldfield, Reference Thompson and Oldfield1986; Evans & Heller, Reference Evans and Heller2003; Liu et al. Reference Liu, Roberts, Torrent, Horng and Larrasoana2012) have been applied to identify and even semi-quantify the aeolian dust in the NPO depositions (Doh et al. Reference Doh, King and Leinen1988; Arnold et al. Reference Arnold, Leinen, King, Rea, Basov, Janecek, Palmer-Julson and Andel1995; Yamazaki & Ioka, Reference Yamazaki and Ioka1997; Bailey et al. Reference Bailey, Liu, Swann, Jiang, Sun, Zhao and Roberts2011; Shimono & Yamazaki, Reference Shen, Wan, France-Lanord, Clift, Tada, Révillon, Shi, Zhao, Liu, Yin, Song and Lia2015; Zhang et al. Reference Zhang, Liu, Li and Sun2018a). Due to their characteristics of rapid, non-sample destruction, high sensitivity and high efficiency, magnetic methods are very suitable for higher-resolution research.
In this paper, we will review the study progress on the aeolian dust depositions in the NPO based on mineral magnetism. First, we will summarize magnetic minerals of different origins in the marine sediments including ferrimagnetic minerals, antiferromagnetic minerals and iron sulphides. Then we will review the recent application of magnetic methods to retrieve the aeolian signal. Finally, future aeolian dust studies will be further discussed.
2. Magnetic minerals in the marine aeolian dust depositions
Minerals in aeolian dust depositions from the NPO can be divided into two major categories: magnetic and non-magnetic minerals. The former includes magnetite/maghemite (ferrimagnetic), hematite/goethite (antiferromagnetic) and pyrite/greigite (iron sulphide). The latter mainly contains terrestrial clay minerals (paramagnetic) and quartz (diamagnetic) (Rea, Reference Rea1994). Previous sedimentology and geochemistry methods have mainly focused on the non-magnetic minerals. In this review, we emphasize the magnetic minerals, which could be of either exogenetic or authigenic origin. The exogenetic components are in the form of detrital particles, which are mainly transported by wind, river and glacier into the ocean (Henshaw & Merrill, Reference Henshaw and Merrill1980; Evans & Heller, Reference Evans and Heller2003). The authigenic components are represented by magnetosome (Blakemore, Reference Blakemore1975; Petermann & Bleil, Reference Petermann and Bleil1993; Yamazaki & Ioka, Reference Yamazaki and Ioka1997; Yamazaki & Shimono, Reference Yamazaki and Shimono2013) and iron sulphide (Roberts & Turner, Reference Roberts and Turner1993; Liu et al. Reference Liu, Shi, Ge, Liu, Yao and Yang2014, Reference Liu, Liu, Zhang, Liu, Wu, Mei, Shi and Zhao2016; Roberts, Reference Roberts2015Reference Liu, Liu, Zhang, Liu, Wu, Mei, Shi and Zhao).
2.a. Ferrimagnetic minerals
2.a.1. Aeolian dust
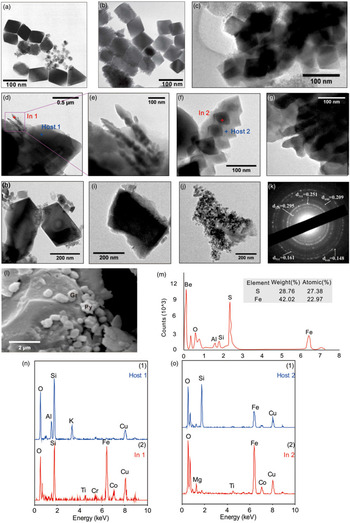
The aeolian dust typically contains a mixture of ferrimagnetic minerals, which usually dominate the magnetic properties of aeolian dust even with trace concentration. Generally, magnetite/maghemite is the lithogenic product and is subsequently released by weathering from source rocks (Maher, Reference Maher2011). In the NPO deep-sea sediments, the aeolian magnetite/maghemite particles occur frequently as nano-sized inclusions in the silicates hosts (Fig. 2d, e, f, g; Zhang et al. Reference Zhang, Liu, Li and Sun2018a) and coarser micron-seized monomer (Fig. 2h, i; Zhang et al. Reference Zhang, Liu, Li and Sun2018a). The magnetic inclusions usually fall into the single-domain (SD) region, and can record reliable palaeomagnetic signals due to the protection from post-depositional effects provided by their host silicates (Chang et al. Reference Chang, Roberts, Heslop, Hayashida, Li, Zhao, Tian and Huang2016; Zhang et al. Reference Zhang, Liu, Li and Sun2018a). The coarser micron-sized detritalmagnetite/maghemite may suffer from partial oxidation because of the enlarged superficial area, and are generally transformed into finer superparamagnetic (SP) maghemite polycrystalline aggregates on the surface (Johnson & Merrill, Reference Johnson and Merrill1972; Kent & Lowrie, Reference Kent and Lowrie1974). This transformation has been found in the pelagic sediments of ODP Hole 885A in the NPO. For example, as shown in Figure 2j, the sub-angular coarser-grained magnetite has oxidized into ultra-fine SP maghemite polycrystalline aggregates (Zhang et al. Reference Zhang, Liu, Li and Sun2018a).
Transmission electron microscope (TEM), scanning electron microscope (SEM), selected area electron diffraction pattern (SAED) and energy-dispersive X-ray spectroscopy analysis (EDXS) for extracted magnetic minerals from marine sediments. (a–c) Biogenic magnetite under TEM. (d–g) Nano-sized magnetic inclusions in silicates hosts under TEM. (h, i) Sub-micron detrital magnetite under TEM. (j) Oxidized maghemite polycrystalline aggregates with detrital magnetite profile under TEM. (k) Polycrystalline diffraction ring for (j). (l) Sulphide minerals extracted from the South Yellow Sea under SEM; Py: pyrite, Gr: greigite. (m–o) EDXS for the (l) (d) and (f). (a) is from Yamazaki & Ioka (Reference Yamazaki and Ioka1997); (b) is from Yamazaki & Shimono (Reference Yamazaki and Shimono2013); (c–k, n, o) are from Zhang et al. (Reference Zhang, Liu, Li and Sun2018a); (l, m) are from Liu et al. (Reference Liu, Shi, Ge, Liu, Yao and Yang2014).

2.a.2. Volcanic ash
The volcanic ash from the marginal island arcs and peninsula, such as the Kamchatka–Kurile and Aleutian Arcs (Pettke et al. Reference Pettke, Halliday, Hall and Rea2000), is also an important component, which significantly affects the magnetic properties of marine sediments. These special layers accumulated abundant lithologic ferrimagnetic minerals in a short time and exhibited a strong magnetic signal (Dickens et al. Reference Dickens, Snoeckx, Arnold, Morley, Owen, Rea, Ingram, Rea, Basov, Janecek, Palmer-Julson and Andel1995). Recent studies found that the volcanic ash comprises abundant high-coercivity (e.g. 80–100 mT) ferrimagnetic minerals (Zhang et al. Reference Zhang, Liu, Li and Sun2018a), which could lead to ambiguities in interpretation of aeolian proxy, such as hard isothermal remanent magnetization (HIRM). Nevertheless, due to the sporadic characteristics, the influence scope of volcanic ash is extremely limited and can be easily identified by lithology (Rea et al. Reference Rea, Basov, Janecek and Palmer-Julson1993), geochemistry proxy (Pettke et al. Reference Pettke, Halliday, Hall and Rea2000; Ziegler et al. Reference Ziegler, Murray, Hovan and Rea2007) and magnetic parameters (Bailey et al. Reference Bailey, Liu, Swann, Jiang, Sun, Zhao and Roberts2011; Zhang et al. Reference Zhang, Liu, Li and Sun2018a).
2.a.3. Ice-rafted debris
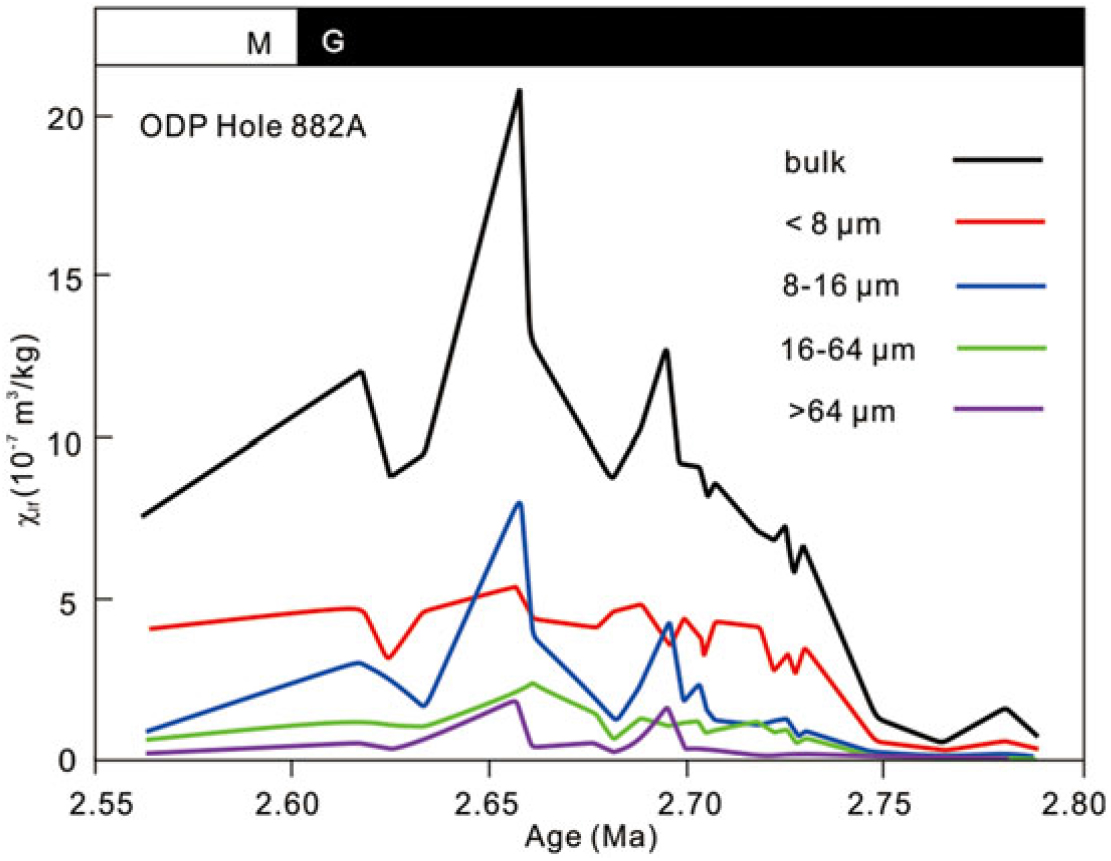
The coarser lithic fragments can be carried much further away by icebergs from sub-polar to middle-latitude areas (Raiswell et al. Reference Raiswell, Tranter, Benning, Siegert, De’ath, Huybrechts and Payne2006). After the icebergs melt, the ice-rafted debris (IRD) particles sink and accumulate on the seafloor, and the IRD components have higher magnetic susceptibility values than the background sediments (Stoner & Andrews, Reference Stoner, Andrews, Maher and Thompson1999), which may also result in ambiguities in utilizing magnetic parameters to reflect the aeolian inputs. The influence scope of IRD is restricted only to the sub-Arctic Northwest Pacific Ocean (Fig. 1; Conolly & Ewing, Reference Conolly, Ewing and Hays1970; Bigg et al. Reference Bigg, Clark and Hughes2008). Changes in magnetic susceptibility have been attributed to the IRD inputs for sediments of the ODP Hole 882A in the Northwest Pacific Ocean (Haug et al. Reference Haug, Ganopolski, Sigman, Rosell-Mele, Swann, Tiedemann, Jaccard, Bollmann, Maslin, Leng and Eglinton2005), but were subsequently proved to be of aeolian origin responding to intensification of Northern Hemisphere glaciations (Fig. 3; Bailey et al. Reference Bailey, Liu, Swann, Jiang, Sun, Zhao and Roberts2011).
Magnetic susceptibility for different grain-size fractions of ODP Hole 882A. Most of the magnetic increase across 2.75 Ma resides in the <8 μm fraction, with little or no increase in χ across this interval in the coarser grain-size fractions. The black/white bar at the top of the figure denotes the Gauss/Matuyama palaeomagnetic boundary. This figure is modified from Bailey et al. (Reference Bailey, Liu, Swann, Jiang, Sun, Zhao and Roberts2011).

2.a.4. Biogenic components
The magnetotactic bacteria are widely distributed in marine sediments (Stolz et al. Reference Stolz, Chang and Kirschvink1986; Petermann & Bleil, Reference Petermann and Bleil1993; Hesse, Reference Hesse1994; Housen & Moskowitz, Reference Housen and Moskowitz2006; Kopp & Kirschvink, Reference Kopp and Kirschvink2008). Abundant magnetosomes (Fig. 2a, b, c) have been found in the Pacific deep-sea sediments. Magnetosomes are characterized by special morphologies, the alignment of grains in chains, and relatively uniform single-domain range (Yamazaki & Ioka, Reference Yamazaki and Ioka1997; Yamazaki, Reference Yamazaki2008; Yamazaki & Shimono, Reference Yamazaki and Shimono2013). The biogenic magnetite has weaker to no interactions (Yamazaki, Reference Yamazaki2009), which can be regarded as the background in the marine sediments. The iron component in the aeolian dust is an important source for the oceanic ecosystem (Jickells et al. Reference Jickells, An, Andersen, Baker, Bergametti, Brooks, Cao, Boyd, Duce, Hunter, Kawahata, Kubilay, laRoche, Liss, Mahowald, Prospero, Ridgwell, Tegen and Torres2005) because iron is an essential controlling micronutrient for phytoplankton. There is a widespread link between magnetotactic bacteria activity and iron fertilization by aeolian dust inputs (Bloemendal et al. Reference Bloemendal, King, Hall and Doh1992; Yamazaki, Reference Yamazaki2009; Abrajevitch & Kodama, Reference Abrajevitch and Kodama2011; Roberts et al. Reference Roberts, Florindo, Villa, Chang, Jovane, Bohaty, Larrasoaña, Heslop and Gerald2011; Larrasoaña et al. Reference Larrasoaña, Roberts, Chang, Schellenberg, FitzGerald, Norris and Zachos2012; Usui et al. Reference Usui, Yamazaki and Saitoh2017). Hence, it is interesting to decipher the responses of abundance and morphology variations of magnetofossils to aeolian inputs. However, the quantification of the magnetosome is still a problem. Direct observation of magnetofossils morphologies under a transmission electron microscope is time-consuming and is suitable only for representative samples. Therefore, multisolution is necessary to fully characterize magnetofossils including both non-magnetic and magnetic approaches.
2.b. Iron sulphide
Another authigenic component is iron sulphide, such as greigite and pyrite (Fig. 2l). The degree of diagenetic reactions depends mainly on the interplay between the supply of organic matter, the oxygen content of bottom waters and sediment pore waters (Liu et al. Reference Liu, Roberts, Torrent, Horng and Larrasoana2012). The detrital ferrimagnetic minerals may be dissolved due to the reductive diagenesis, especially in the shelf and slope marine settings, where the deposition rate is high and organic input is sufficient (Liu et al. Reference Liu, Shi, Ge, Liu, Yao and Yang2014, Reference Liu, Liu, Zhang, Liu, Wu, Mei, Shi and Zhao2016). However, the major aeolian depositions in the deep-sea basins of NPO are composed predominantly of reddish-brown and brown clay (e.g. the sediments in ODP Hole 885A with clay concentrations of 65–95 %), and the occurrence of centimetre-scale ferro-manganese nodules indicates a highly oxidizing depositional environment (Rea et al. Reference Rea, Basov, Janecek and Palmer-Julson1993), hence the effect of reductive diagenesis can be neglected.
2.c. Antiferromagnetic minerals
Hematite and goethite are antiferromagnetic minerals in the sediments (Barrón & Montealegre, Reference Barrón and Montealegre1986), which have been widely identified in the aeolian dust from the Asian interior (Arnold et al. Reference Arnold, Leinen, King, Rea, Basov, Janecek, Palmer-Julson and Andel1995; Bailey et al. Reference Bailey, Liu, Swann, Jiang, Sun, Zhao and Roberts2011), North Africa (Robinson, Reference Robinson1986; Larrasoaña et al. Reference Larrasoaña, Roberts, Rohling, Winklhofer and Wehausen2003, Reference Larrasoaña, Roberts and Rohling2008; Itambi et al. Reference Itambi, Von Dobeneck, Mulitza, Bickert and Heslop2009; Oldfield et al. Reference Oldfield, Chiverrell, Lyons, Williams, Shen, Bristow, Bloemendal, Torrent and Boylea2014) and the Arabian Peninsula (Bloemendal et al. Reference Bloemendal, King, Hunt, DeMenocal and Hayashida1993; Hounslow & Maher, Reference Hounslow and Maher1999). Hematite is generally regarded as an end product of the mineral weathering process (Barrón et al. Reference Barrón, Torrent and De Grave2003). Besides that, the antiferromagnetic minerals as weathering products can be used efficiently for the aeolian tracers (Zhang et al. Reference Zhang, Liu, Li and Sun2018a). However, quantification of hematite and goethite has been problematic because these minerals cannot be saturated under regular laboratory magnetic field. The quantification methods for antiferromagnetic minerals will be discussed in detail in Section 3.
3. Application of magnetism for aeolian signal extraction
3.a. Conventional magnetic parameters
Magnetic susceptibility (χ, mass-specific; κ, volume-specific) is one of the most common magnetic proxies in studying marine sediments (Bloemendal & DeMenocal, Reference Bloemendal and DeMenocal1989). Considering the multi-components in the deep-sea sediments, it is necessary to clarify the individual contributions to the bulk magnetic properties (Hounslow & Maher, Reference Hounslow and Maher1999): χtotal = χf + χa + χp + χd, where χf, χa, χp, and χd are contributed by ferrimagnetic (magnetite and maghemite), defect antiferromagnetic (hematite and goethite), paramagnetic (silicates) and diamagnetic (calcium carbonate) minerals, respectively.
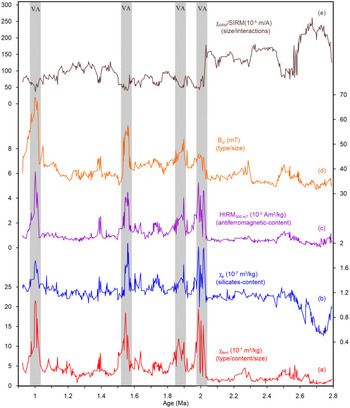
As discussed in Section 2.a, the aeolian dust comprises coarser detrital magnetite/maghemite, magnetic inclusions and hematite/goethite. The coarser detrital magnetite/maghemite fall into the submicron vortex state possessing higher susceptibility than the SD magnetic inclusions. The antiferromagnetic minerals characteristically display very low magnetic susceptibility, and thus the contribution to bulk susceptibility can be neglected. The influence of calcium carbonate can be eliminated by chemical dissolution before the susceptibility test (Hounslow & Maher, Reference Hounslow and Maher1999). The paramagnetic susceptibility (χp) can be measured independently by calculating the gradient between high applied field and magnetization. Due to the coexistence relationship between silicates host and magnetite inclusions, χp has a good potential to be the tracer for the nano-sized magnetite/maghemite in aeolian dust (Fig. 4b; Zhang et al. Reference Zhang, Liu, Li and Sun2018a). The ferrimagnetic susceptibility can be given by χferri = χtotal – χp (Fig. 4a, Liu et al. Reference Liu, Roberts, Torrent, Horng and Larrasoana2012), which is strongly linked with grain-size (or domain state) changes of magnetic particles (Dunlop & Özdemir, Reference Dunlop and Özdemir1997; Tauxe, Reference Tauxe2010). In addition, the bulk susceptibility comprises mixed information on all magnetic particles, including aeolian, volcanic, ice-rafting and biogenic components. The low-temperature oxidation (Johnson & Merrill, Reference Johnson and Merrill1972; Van Velzen & Dekkers, Reference Van Velzen and Dekkers1999) and reductive dissolution (Roberts, Reference Roberts2015) can also alter the original properties of aeolian magnetic components. Therefore, magnetic susceptibility is not recommended as the aeolian indicator.
Some aeolian-related environmental magnetism parameters for the pelagic sediments of ODP Hole 885A (modified from Zhang et al. Reference Zhang, Liu, Li and Sun2018a). Four vertical grey bars indicate volcanic ash layers (Rea et al. Reference Rea, Basov, Janecek and Palmer-Julson1993). VA: volcanic ash.

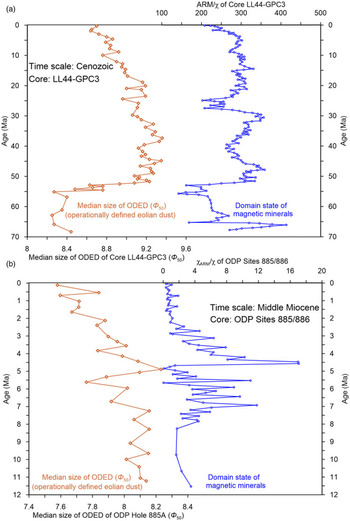
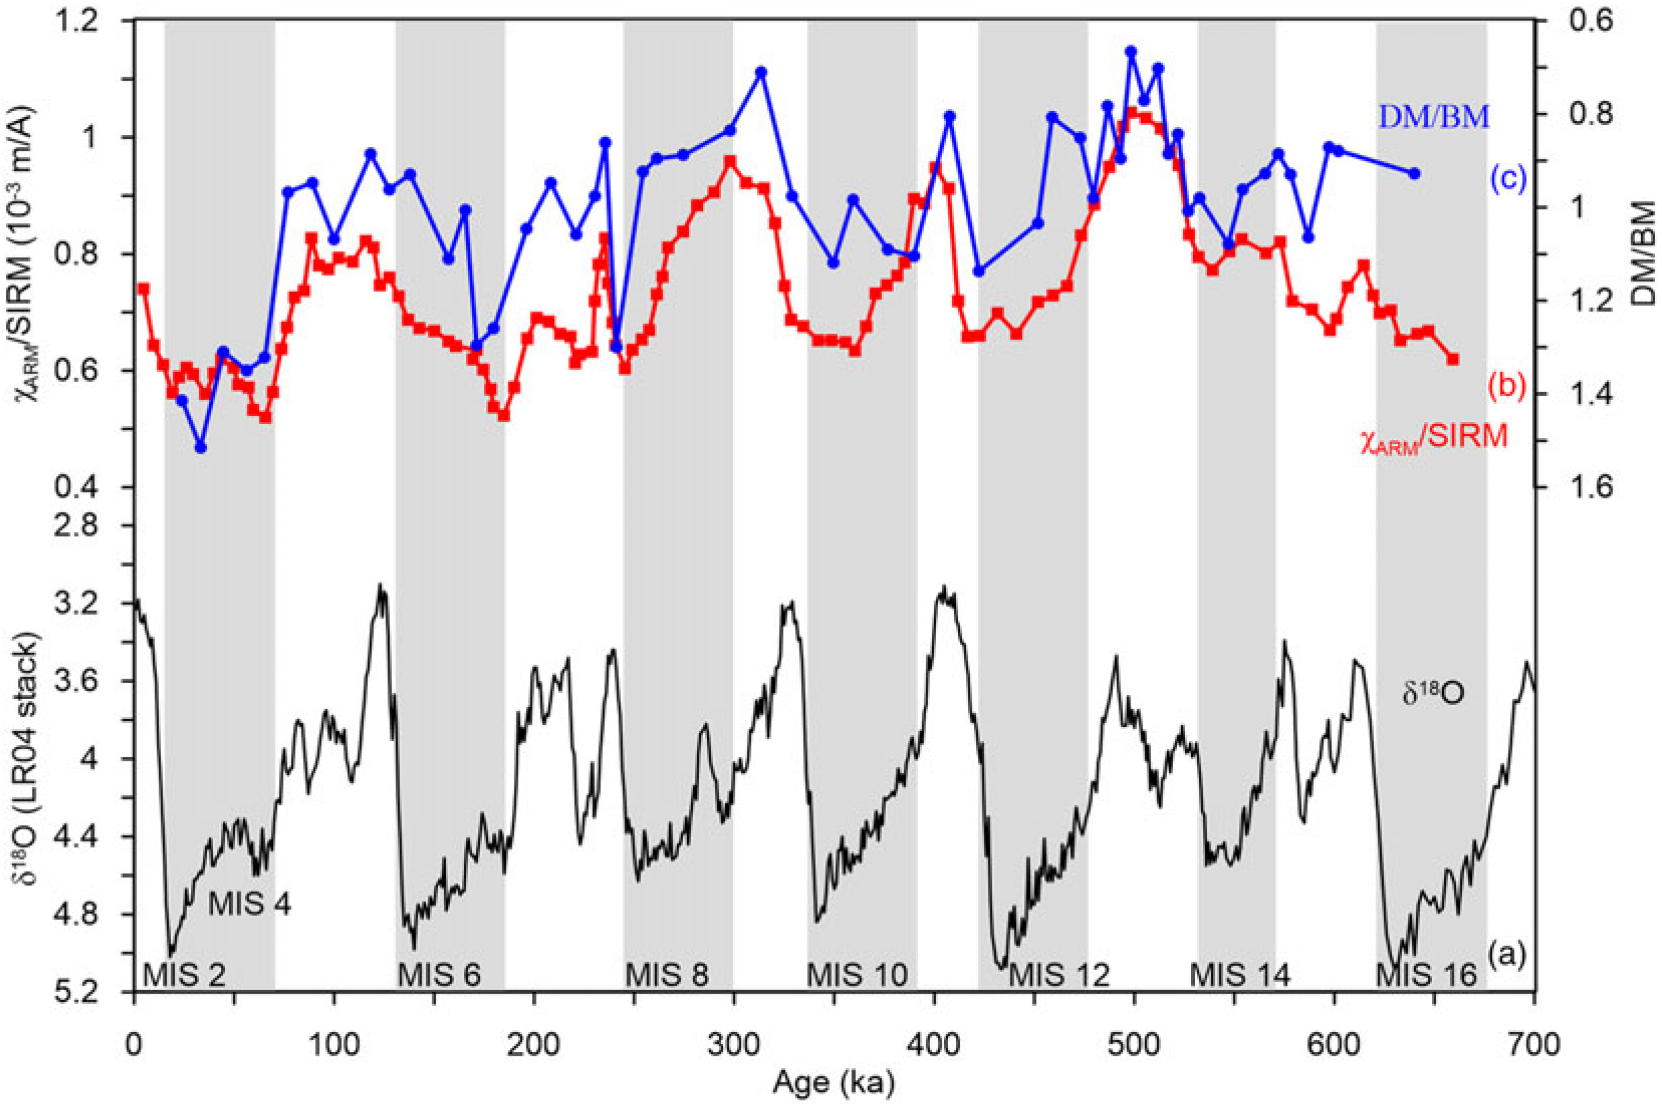
Anhysteretic remanent magnetization (ARM) is a grain-size (or domain state) dependent parameter (Banerjee et al. Reference Banerjee, King and Marvin1981; King et al. Reference King, Banerjee and Marvin1982). The values of χARM or χARM/SIRM (where SIRM is saturation isothermal remanent magnetization) are expected to reflect the changes in grain size (Thompson & Oldfield, Reference Thompson and Oldfield1986; Peters & Dekkers, Reference Peters and Dekkers2003) of aeolian magnetic particles, which have been used to recover the intensity of atmospheric circulation within different timescales (Fig. 5; Doh et al. Reference Doh, King and Leinen1988; Arnold et al. Reference Arnold, Leinen, King, Rea, Basov, Janecek, Palmer-Julson and Andel1995). Although there is a rough similarity in variations of ARM-related parameter and grain size of aeolian components from a large tectonic scale in the hole LL44-GPC3 (Fig. 5a), some distinct differences still exist in the high-resolution records from a short timescale in ODP Sites 885/886 (Fig. 5b). ARM can decrease with increasing concentration due to interactions among magnetic particles (Sugiura, Reference Sun and Liu1979). For example, Yamazaki (Reference Yamazaki2008) has revealed that χARM/SIRM values in sediments from the central NPO are dominantly controlled by the relative abundance of detrital aeolian maghemite (DM) with stronger magnetostatic interactions to biogenic magnetite (BM) with weak to no interactions, and the χARM/SIRM ratio does not reflect magnetic grain-size changes. There are marked temporal variations of χARM/SIRM and DM/BM on glacial–interglacial timescales in the NPO cores; the values of χARM/SIRM and DM/BM are generally lower and higher in glacial periods, respectively (Fig. 6), which indicates an increased proportion of terrigenous aeolian magnetic minerals during these periods (Yamazaki, Reference Yamazaki2009). There is significant disagreement in the variation tendency of the aeolian silicates grain size and domain state of magnetic minerals in the pelagic sediments, which is interpreted to mean that the magnetic minerals may adhere to larger nonmagnetic grains or clump with each other (Yamazaki & Ioka, Reference Yamazaki and Ioka1997). Thus the grain size of finer magnetic minerals may not reflect aeolian grain-size variations. Finally, ARM acquisition may be influenced by many factors, such as applied AF (alternating field) and DC (direct current) fields, and decay rates (Yu & Dunlop, Reference Yu and Dunlop2003). Therefore, one should be cautious about taking the ARM or χARM/SIRM to be an aeolian-related proxy.
Median grain size (Φ50) of ODED (operationally defined aeolian dust) and ARM-related parameters for NPO holes. (a) Hole LL44-GPC3; median grain size (Φ50) of ODED is from Janecek & Rea (Reference Janecek and Rea1983), ARM/χ is from Doh et al. (Reference Doh, King and Leinen1988). (b) ODP Sites 885/886; median grain size (Φ50) of ODED is from Rea et al. (Reference Rea, Snoeckx and Joseph1998), and χARM/χ is from Arnold et al. (Reference Arnold, Leinen, King, Rea, Basov, Janecek, Palmer-Julson and Andel1995).

Temporal variations of some magnetic and palaeoceanography parameters in NPO core NGC65. (a) The LR04 δ18O stack of Lisiecki & Raymo (Reference Lisiecki and Raymo2005). (b) χARM/SIRM for NPO core NGC65; (c) ratio of detrital magnetite (DM) to biogenic magnetite (BM). This figure is from Yamazaki (Reference Yamazaki2009).

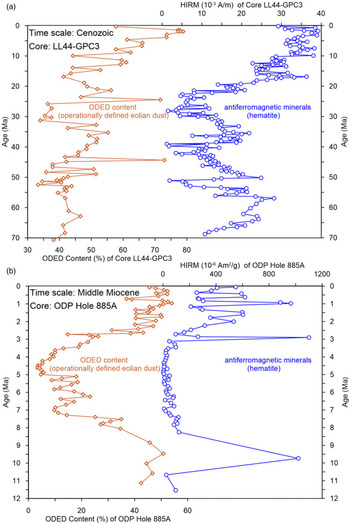
Hard isothermal remanent magnetization (HIRM = (SIRM + IRM−0.3T)/2; Robinson, Reference Robinson1986; Bloemendal et al. Reference Bloemendal, Lamb and King1988) has been used as a measure of the mass concentration of high-coercivity magnetic minerals (hematite). Doh et al. (Reference Doh, King and Leinen1988) and Arnold et al. (Reference Arnold, Leinen, King, Rea, Basov, Janecek, Palmer-Julson and Andel1995) both used HIRM to reflect the evolutionary history of aeolian dust in the holes LL44-GPC3 (Fig. 7a) and ODP Hole 885A (Fig. 7b), respectively. However, the antiferromagnetic minerals may not be saturated under a general laboratory-applied field; besides that, HIRM is strongly affected by the coercivity distribution, which can be evaluated by the L-ratio (L-ratio = (SIRM + IRM−0.3T)/(SIRM + IRM−0.1T)) proposed by Liu et al. (Reference Liu, Roberts, Larrasoana, Banerjee, Guyodo, Tauxe and Oldfield2007). Only when the L-ratio is stable can HIRM be interpreted conventionally. Isothermal remanent magnetization (IRM) after alternating field (AF) demagnetization at 120 mT (IRM@AF120 mT) is also used as an aeolian proxy in the northern Sahara regions (Larrasoaña et al. Reference Larrasoaña, Roberts, Rohling, Winklhofer and Wehausen2003). The variation of IRM@AF100 mT is nearly parallel to the flux of aeolian dust at most of the depositional layers of ODP Hole 885A (Bailey et al. Reference Bailey, Liu, Swann, Jiang, Sun, Zhao and Roberts2011). However, as detailed high-resolution rock magnetic data show, volcanic ash contained abundant high-coercivity ferrimagnetic minerals (Fig. 4c, d), which have disturbed the original coercivity distribution (Zhang et al. Reference Zhang, Liu, Li and Sun2018a). Hence, the HIRM and IRM@AF are unable to extract reliable aeolian signal in these special volcanic ash layers. For the goethite with higher coercivity, Maher et al. (Reference Maher, Thompson, Hounslow, Maher and Thompson1999) proposed a sequence of magnetic mineral identification, which used high applied field to identify and quantify the goethite in natural samples.
ODED (operationally defined aeolian dust) content (%) and HIRM for NPO holes. (a) Hole LL44-GPC3; ODED content is from Janecek & Rea (Reference Janecek and Rea1983), and HIRM is from Doh et al. (Reference Doh, King and Leinen1988). (b) ODP Hole 885A; ODED content is from Snoeckx et al. (Reference Snoeckx, Rea, Jones, Ingram, Rea, Basov, Janecek, Palmer-Julson and Andel1995), and HIRM is from Arnold et al. (Reference Arnold, Leinen, King, Rea, Basov, Janecek, Palmer-Julson and Andel1995).

3.b. Magnetic diagrams
3.b.1. IRM unmixing
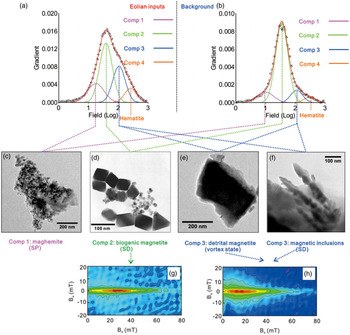
IRM acquisition curves can be decomposed into different coercivity fractions (Kruiver et al. Reference Kruiver, Dekkers and Heslop2001; Heslop et al. Reference Heslop, Dekkers, Kruiver and Van Oorschot2002; Egli, Reference Egli2004a, b, c) to discriminate magnetic components. So far, there are two major magnetic components identified in the NPO aeolian depositional regions through decomposing IRM curves (Yamazaki, Reference Yamazaki2008, Reference Yamazaki2009; Shimono & Yamazaki, Reference Shen, Wan, France-Lanord, Clift, Tada, Révillon, Shi, Zhao, Liu, Yin, Song and Lia2015; Zhang et al. Reference Zhang, Liu, Li and Sun2018a) including aeolian dust inputs (Fig. 8a) and biogenic background (Fig. 8b).
Different components in the NPO aeolian dust depositions obtained from decomposition of isotherm remanent magnetization curves. (a) and (b) indicate the two major magnetic compositions in the pelagic sediments; (c–f) TEM images of corresponding magnetic components; (g, h) FORC diagrams for components 2 and 3, respectively. (d) is from Yamazaki & Ioka (Reference Yamazaki and Ioka1997), the others are from Zhang et al. (Reference Zhang, Liu, Li and Sun2018a).

The aeolian component can be further classified into three types with low, middle and high coercivity values. The low-coercivity minerals (10–18 mT) contribute insignificantly to the bulk remanent magnetization (Comp 1 in Fig. 8a, b). This component may represent ultra-fine SP magnetite (maghemite) just above the SP/SD threshold size (∼20–25 nm), which could have SD behaviour because the measurement time is less than the thermal relaxation time (Heslop et al. Reference Heslop, McIntosh and Dekkers2004). TEM observations the existence of SP polycrystalline aggregates as oxidized products of coarser detrital aeolian magnetite (Fig. 8c; Zhang et al. Reference Zhang, Liu, Li and Sun2018a). The middle coercivity component (∼100 mT) is interpreted as aeolian maghemite in pelagic NPO sediment (Comp 3 in Fig. 8a, b; Yamazaki, Reference Yamazaki2008, Reference Yamazaki2009). In addition, partially oxidized magnetite (Fig. 8e) can also have elevated coercivity due to the mismatching of unit cells between the maghemite rim and the magnetite core (Özdemir & O’Reilly, Reference Özdemir and O’Reilly1982; Cui et al. Reference Cui, Verosub and Roberts1994). The wind-borne fine (titano) magnetite inclusions (Fig. 8f) fall within the SD particle size range and are partially substituted by Ti, Cr, Mg and Co; therefore, this component may have higher coercivity (∼100 mT) than stoichiometric magnetite (Zhang et al. Reference Zhang, Liu, Li and Sun2018a). The middle-coercivity component is likely to be of aeolian origin. The high-coercivity magnetic component (∼300 mT, Comp 4 in Fig. 8a, b) may correspond to hematite preserved in aeolian dust.
The biogenic magnetite (Fig. 8d) can be identified easily in the decomposition of IRM acquisition curves. This component is characterized by stable central coercivity (∼35 mT) and narrow dispersion parameter (∼0.2) and exhibits as background (Comp 2 in Fig. 8a, b) in all depositional layers (Yamazaki, Reference Yamazaki2008, Reference Yamazaki2009; Zhang et al. Reference Zhang, Liu, Li and Sun2018a). This demonstrates that the biogenic component exists pervasively in the NPO region.
3.b.2. First-order reversal curve
First-order reversal curve (FORC) diagrams can be used to identify domain state and discriminate among different components in a magnetic mineral assemblage (Pike et al. Reference Pike, Roberts and Verosub1999; Roberts et al. Reference Roberts, Pike and Verosub2000). The FORC diagram has also been used to discriminate aeolian and non-aeolian information preserved in the deep-sea sediments of the NPO. The aeolian materials show diverging outer contours, indicating vortex state particles with strong magnetostatic interactions (Fig. 8h; Roberts et al. Reference Roberts, Pike and Verosub2000, Reference Roberts, Almeida, Church, Harrison, Heslop, Li, Li, Muxworthy, Williams and Zhao2017; Yamazaki, Reference Yamazaki2008, Reference Yamazaki2009; Zhang et al. Reference Zhang, Liu, Li and Sun2018a); while the biogenic magnetite is characterized by elongated contours along the horizontal axis with small vertical spread (Bu < 5 mT), indicating typical SD behaviour with weak magnetostatic interactions (Fig. 8g; Roberts et al. Reference Roberts, Pike and Verosub2000; Yamazaki, Reference Yamazaki2008, Reference Yamazaki2009; Zhang et al. Reference Zhang, Liu, Li and Sun2018a). Recently, Zhao et al. (Reference Zhao, Roberts, Heslop, Paterson, Li and Li2017) described a new range of FORC-type measurements with remanent FORC, transient FORC and induced FORC diagrams that provided substantial additional information to separate different components in soil, loess/palaeosol, and marine sediments (Hu et al. Reference Hu, Zhao, Roberts, Heslop and Rossel2018; Roberts et al. Reference Roberts, Zhao, Harrison, Heslop, Muxworthy and Rowan2018).
3.b.3. Bivariate diagrams
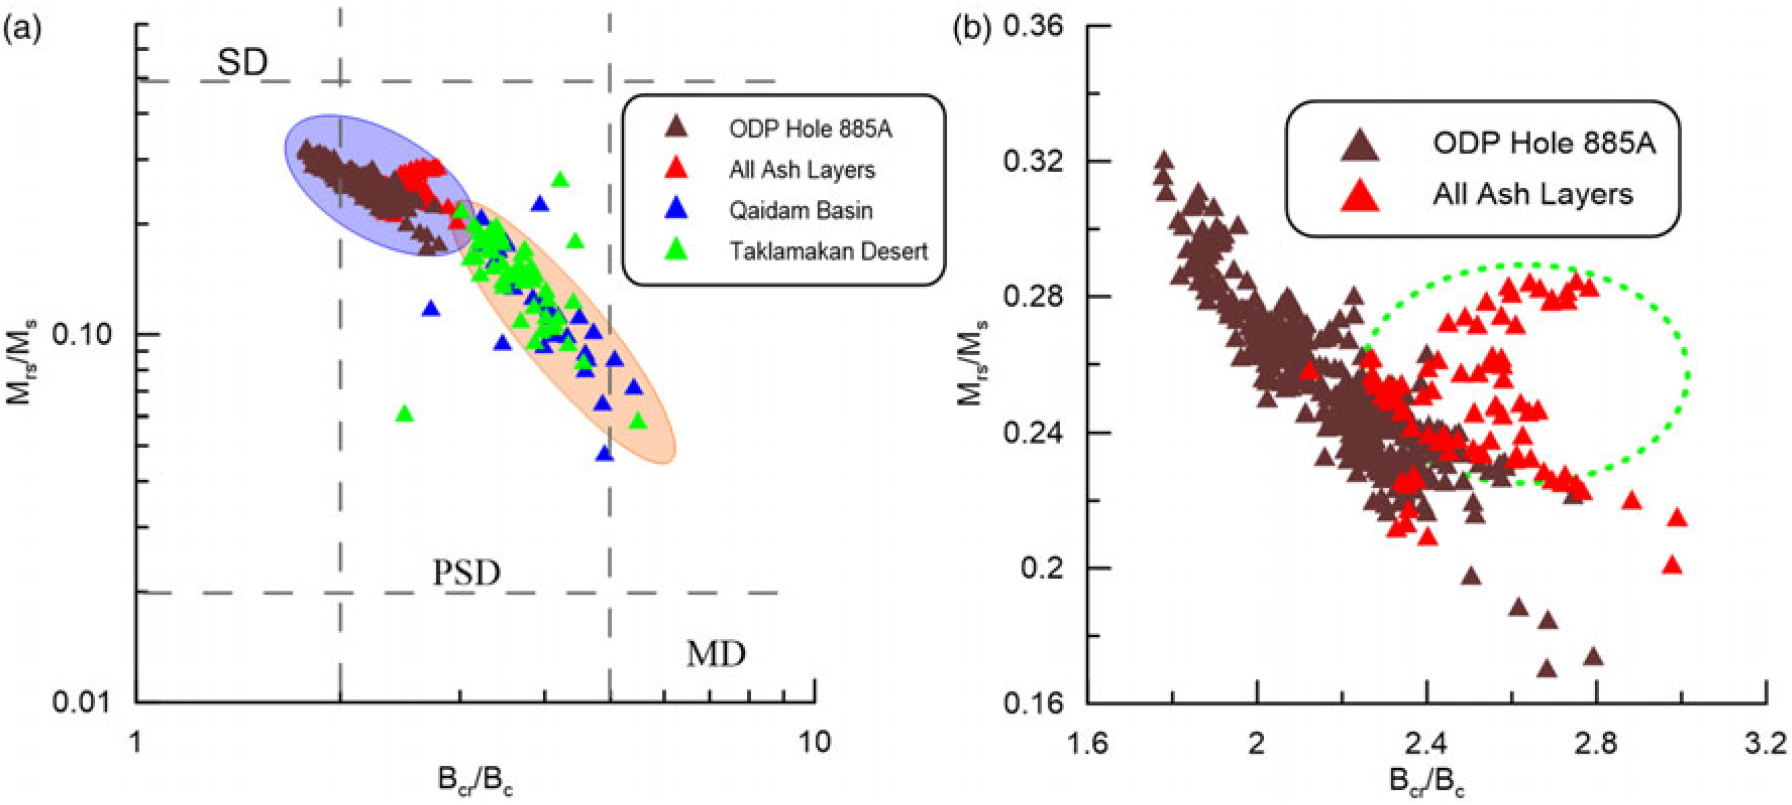
The Day plot (Mrs/Ms versus Bcr/Bc; Day et al. Reference Day, Fuller and Schmidt1977; Dunlop, Reference Dunlop2002a, b) can be used to determine the domain state in a mixed magnetic mineral assemblage. Although there exist ambiguities in interpreting the Day plot (Roberts et al. Reference Roberts, Almeida, Church, Harrison, Heslop, Li, Li, Muxworthy, Williams and Zhao2017), this bivariate diagram has an important role in provenance discernment. For example, the hysteresis data from samples in ODP Hole 885A (Zhang et al. Reference Zhang, Liu, Li and Sun2018a) indicate grain-size changes due to the sorting effects by wind from source to sink (Fig. 9a). Besides, the influence of volcanic ash from the aeolian inputs background can be easily distinguished through the data distribution in the Day plot (Fig. 9b, Zhang et al. Reference Zhang, Liu, Li and Sun2018a).
(a) Day plot for samples from ODP Hole 885A, Qaidam Basin and Taklimakan Desert (the latter two are from Liu et al. Reference Liu, Sun, Qiang, Tada, Hu, Duan, Jiang, Liu and Su2015). (b) Magnified Day plot; dashed green circle separates the samples in volcanic ash layers from other samples. These two panels are modified from Zhang et al. (Reference Zhang, Liu, Li and Sun2018a).

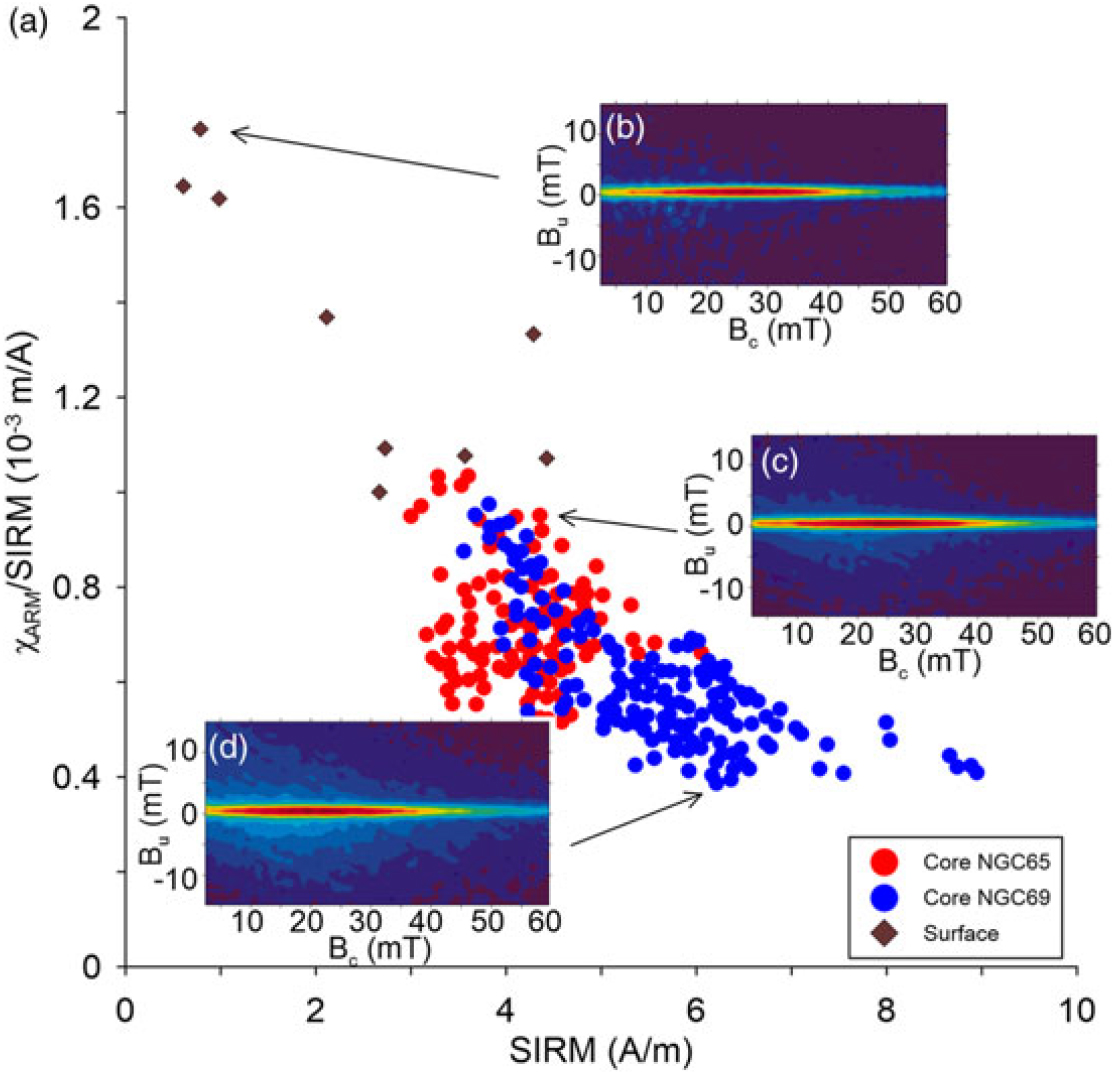
The bivariate diagram between χARM/SIRM and SIRM has been used to evaluate the relative contribution of the aeolian inputs and biogenic magnetite (Yamazaki, Reference Yamazaki2008, Reference Yamazaki2009). Aeolian magnetite/maghemite has strong magnetostatic interactions, which may significantly reduce the value of χARM, while the biogenic magnetite possesses weaker to no interactions and has the ability to obtain a high ARM. Therefore, the biogenic magnetite dominated and aeolian dust dominated samples may locate the upper left and lower right in the diagram between χARM/SIRM and SIRM, respectively (Fig. 10; Yamazaki, Reference Yamazaki2008).
(a) The bivariate diagram between χARM/SIRM and SIRM for Pacific Ocean cores; (b–d) corresponding FORC diagrams for the samples. This figure is modified from Yamazaki (Reference Yamazaki2008).

3.c. Diffuse reflectance spectroscopy
Diffuse reflectance spectroscopy (DRS) in the visible (VIS, ∼400–700 nm) and near-infrared (NIR) range (∼700–2500 nm) is an alternative way to sensitively quantify antiferromagnetic minerals (hematite and goethite) contents in samples (Deaton & Balsam, Reference Deaton and Balsam1991). The DRS technique has been widely applied to extract information on hematite and goethite in loess/soils (Balsam et al. Reference Balsam, Ji and Chen2004; Ji et al. Reference Ji, Chen, Balsam, Lu, Sun and Xu2004; Torrent et al. Reference Torrent, Liu, Bloemendal and Barrón2007), aerosols (Shen et al. Reference Sugiura2006) and marine sediments (Balsam et al. Reference Balsam, Otto-Bliesner and Deaton1995; Zhang et al. Reference Zhang, Ji, Balsam, Liu and Chen2007).
3.c.1. Quantification of aeolian dust
To estimate the concentration of hematite and goethite from the original DRS spectra, DRS data were first transformed into the Kubelka–Munk (K-M) remission function (F(R) = (1 − R)2/2R, where R is reflectance). Deaton & Balsam (Reference Deaton and Balsam1991) then calculated the first derivative of the F(R), and obtained the characteristic peaks for hematite and goethite to quantify the content of hematite and goethite, respectively. Kosmas et al. (Reference Kosmas, Curi, Bryant and Franzmeier1984) and Scheinost et al. (Reference Scheinost, Chavernas, Barrón and Torrent1998) used the second derivative to quantify antiferromagnetic minerals. Torrent & Barrón (Reference Torrent and Barrón2003) proposed that compared with the first-derivative curve, the second-derivative curve can provide more information. Liu et al. (Reference Liu, Torrent, Barrón, Duan and Bloemendal2011) proposed that the DRS properties of hematite in the second derivative curve were also affected by Al-substitution and the concentration of hematite.
As discussed above, antiferromagnetic minerals (hematite and goethite) are strongly suggested to be the aeolian dust tracer in the marine sediments. Recently, Zhang et al. (Reference Zhang, Liu, Li and Sun2018a) defined a new parameter RelHm+Gt, which represents the relative concentration of antiferromagnetic minerals:  ${\rm{Re}}{{\rm{l}}_{{\rm{Hm}} + {\rm{G}}{{\rm{t}}_i}}} = <?A3B2 show [$] [$]?>n{\rm{*}}\left( {{{{I_{{\rm{H}}{{\rm{m}}_i}}}} \over {\mathop \sum \nolimits_{i = 1}^n {I_{{\rm{H}}{{\rm{m}}_i}}}}} + {{{I_{{\rm{G}}{{\rm{t}}_i}}}} \over {\mathop \sum \nolimits_{i = 1}^n {I_{{\rm{G}}{{\rm{t}}_i}}}}}} \right)$
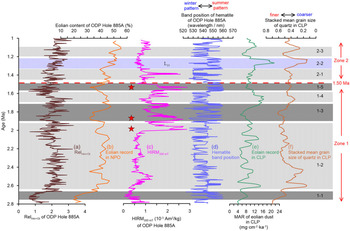
(I Hm and I Gt indicate the intensity of hematite and goethite derived from the second derivative of DRS spectrum, and n denotes the number of samples). The fluctuation of this parameter (Fig. 11a) is nearly parallel to the variation tendency of aeolian silicates obtained from chemical separations for the pelagic sediments in ODP Hole 885A (Fig. 11b; Sun & Liu, Reference Sun and Liu2007). The spiking in the HIRM300 mT in the volcanic ash layers can be interpreted as the existence of abundant antiferromagnetic minerals (Fig. 11c), but RelHm+Gt indicates no distinct changes within these special layers (Fig. 11a). The obvious inconsistencies between HIRM300 mT peaks and RelHm+Gt minima for volcanic ash layers demonstrate that volcanism may not generate hematite and goethite in situ. Compared with conventional aeolian dust indicators, the acquisition of RelHm+Gt is non-sample destructive and highly efficient, so it can attenuate the influence of volcanogenic and biogenic components, and is very suitable for high-resolution research. Therefore, RelHm+Gt obtained from DRS is a reliable and useful proxy for aeolian dust in the NPO sediments.
Land–ocean comparison for the aeolian records in the North Pacific Ocean (ODP Hole 885A) and Chinese Loess Plateau (CLP). (a) Aeolian proxy RelHm+Gt of ODP Hole 885A (Zhang et al. Reference Zhang, Liu, Li and Sun2018a). (b) Aeolian dust content (%) in ODP Hole 885A (Sun & Liu, Reference Sun and Liu2007). (c) Magnetic parameter HIRM300 mT of ODP Hole 885A (Zhang et al. Reference Zhang, Liu, Li and Sun2018a); note that the value of HIRM300 mT was clipped at volcanic ash layers in order to clarify the variation tendency. (d) The band position of hematite obtained from DRS in the sediments of ODP Hole 885A; P540 and P560 indicate winter and summer patterns, respectively (Zhang & Liu Reference Zhang and Liu2018b). (e) Mass accumulation rate (MAR) of aeolian dust in Lingtai/Zhaojiachuan profiles in the CLP (Sun & An, Reference Sun and An2005). (f) Stacked mean grain size of quartz in Lingtai/Zhaojiachuan profiles in the CLP; the lower value indicates stronger winter monsoon (Sun et al. Reference Sun, Clemens, An and Yu2006). The red stars in (c) indicate the volcanic ash layers (Rea et al. Reference Rea, Basov, Janecek and Palmer-Julson1993).

3.c.2. Implication for aeolian provenance
DRS data provide important information on the provenance for hematite. For example, the DRS band position may shift to shorter wavelength with Al substitution increase in the hematite crystal lattice, which is controlled primarily by the formation environment of hematite (Liu et al. Reference Liu, Torrent, Barrón, Duan and Bloemendal2011). The hematite band position has already been employed to distinguish the sources of hematite for the surface aeolian samples in the Asian inland (Liu et al. Reference Liu, Sun, Qiang, Tada, Hu, Duan, Jiang, Liu and Su2015): the signal of P560 (hematite band position 560 nm derived from the second derivative of DRS spectrum) is the coarse-grained hematite of lithogenic origin and is mostly confined to non-CLP sources (so it may not provide aeolian materials for the Chinese Loess Plateau), such as the Taklimakan Desert. P540 is an intermediate phase that is present both in surface samples from CLP sources (e.g. Mu Us, Badain and Juran (GB + BJ), Tengger (TG), Mongolia–Gobi (MG) deserts) and non-CLP sources.
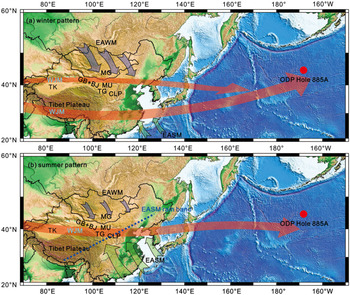
Zhang & Liu (Reference Zhang and Liu2018b) have utilized the hematite band position to trace the aeolian provenance changes for ODP Hole 885A: two groups of hematite band position (P560 and P540) have been identified in the pelagic sediments of this hole from late Pliocene to early Pleistocene based on higher-resolution DRS records (Fig. 11d). Through the land–ocean comparision for the aeolian records from the NPO (Fig. 11a, b) and Chinese Loess Plateau (CLP, Fig. 11e, f), the alternative variations of aeolian provenance for this NPO hole were found to be related to the fluctuation of the East Asian monsoon. Based on the modern meteorological observation from Schiemann et al. (Reference Schiemann, Lüthi and Schär2009), changes in aeolian provenance for the studied section of ODP Hole 885A may be the result of longitudinal movement of the westerly jet mainstream driven by the relative strength of the East Asian winter/summer monsoon. When the East Asian winter monsoon dominates the near-surface wind system, the westerly jet mainstream has been split into two branches; this atmospheric circulation coincides with the winter pattern (Fig. 12a) proposed by Schiemann et al. (Reference Schiemann, Lüthi and Schär2009). For such a case, the northern branch of the westerly jet mainstream bypasses the Taklimakan Desert and conveys aeolian materials from CLP sources, including the Mu Us, Badain and Juran (GB + BJ), Tengger (TG) and Mongolia–Gobi (MG) deserts, to the NPO. When the Asian winter monsoon is weaker and the summer monsoon strengthens, the hematite band position (P560) in the sediments of Hole 885A (Fig. 11d, stages 1-1, 1-3, 1-5 and 2-2) reflects that the aeolian materials are mainly from non-CLP sources (such as the Taklimakan Desert). At these stages, the westerly jet mainstream may be located at the north of the Tibetan Plateau and overlies the Taklimakan Desert, and this situation corresponds exactly to the summer pattern (Fig. 12b) of Schiemann et al. (Reference Schiemann, Lüthi and Schär2009). Therefore, the DRS property of hematite may also be a good tool to discriminate the aeolian provenance and reflects the longitudinal movement of the westerlies in the geological timescale.
Atmospheric circulation mode pattern over East Asia and the North Pacific Ocean. (a) and (b) indicate the location of the westerly jet mainstream (WJM) in January and July, termed ‘winter pattern’ and ‘summer pattern’, respectively. Both are modified from Schiemann et al. (Reference Schiemann, Lüthi and Schär2009). The red arrows can be treated as the location of mainstream. The light purple arrows and light green arrows indicate the East Asian winter monsoon (EAWM) and the East Asian summer monsoon (EASM), respectively. The distribution of deserts or sand deserts is adapted from Sun et al. (Reference Sun, Chen, Tada, Weiss, Lin, Toyoda, Yan and Isozaki2013). This figure is from Zhang & Liu (Reference Zhang and Liu2018b).

4. Suggestions for future studies and summary
For studies of aeolian dust in marine sediments, environmental magnetism has been successfully used to extract aeolian signals for high-resolution palaeoclimatic and palaeoenvironmental research. The category of wind-borne minerals can be determined by a variety of magnetic parameters and diagrams. The DRS proxy RelHm+Gt combined with relative concentration of hematite and goethite is a reliable and useful indicator for the quantification of aeolian dust and can preclude the influence of other disturbed components. However, except for the time-consuming direct measurements of particle size, there is a lack of an effective and rapid method or proxy to reflect the changes in grain size (or domain state) of aeolian magnetic minerals in the marine sediments. The conventional domain state indicator, such as χARM/SIRM, may be less or more affected by the post-depositional effect, volcanic ash and magnetostatic interactions. Hence more emphasis should be given to characterizing the grain size of aeolian magnetic components with a reliable parameter so as to reflect sensitively the changes in intensity of transporting wind. Besides that, other provenance methods, such as zircon U–Pb dating (Nie et al. Reference Nie, Stevens, Rittner, Stockli, Garzanti, Limonta, Bird, Andò, Vermeesch, Saylor, Lu, Breecker, Hu, Liu, Resentini, Vezzoli, Peng, Carter, Ji and Pan2015, Reference Nie, Pullen, Garzione, Peng and Wang2018), are also suggested to understand the evolutionary history of the transporting medium.
Under the protection of silicates host, the magnetic inclusions may comprise the key information on natural conditions during the formation progress. Compared with physical measurements, the citrate–bicarbonate–dithionite (CBD) method can preferentially dissolve Fe-bearing magnetic minerals (Mehra & Jackson, Reference Mehra and Jackson1958; Verosub et al. Reference Verosub, Fine, Singer and Tenpas1993; Hunt et al. Reference Hunt, Singer, Gkletetschka, Tenpas and Verosub1995). Thus, it will be a very worthwhile means to obtain the pure magnetic inclusions, because the detrital and biogenic magnetite may be dissolved after CBD treatments, while the finer magnetite/maghemite inclusions are resistant to chemical dissolution due to the protection of silicates. Nevertheless, the feasibility and effectiveness of this method still need to be examined in practice for marine sediments.
In summary, environmental and rock magnetism is a powerful means to investigate the generation, transportation and deposition of aeolian dust during the process from source to sink. Magnetic techniques have the unique advantages to extract the aeolian signal existing in marine sediments. However, magnetic parameters have intrinsic complexities especially for a mixture of different kinds of magnetic minerals. Therefore, it is strongly recommended that both non-magnetic and magnetic methods are integrated to accurately quantify the aeolian signal from marine sediments.
Author ORCIDs
Qiang Zhang, 0000-0002-1439-3664
Acknowledgements
This study was supported by the National Key R&D Program of China (2016YFA0601903), the National Natural Sciences Foundation of China (41430962), the NSFC–Shandong Joint Fund for Marine Science Research Centers (U1606401), the National Program on Global Change and Air–Sea Interaction (GASI-GEOGE-03), and the Ocean Drilling Program, which was sponsored by the US National Science Foundation (NSF) and participating countries under the management of Joint Oceanographic Institutions (JOI), Inc.