On paper, Azerbaijan is a multiparty democracy, and has held periodic multiparty presidential and parliamentary elections since the country regained independence in 1991. Despite the nominal existence of democratic institutions, the government uses tactics of electoral manipulation including overt election fraud, violence and intimidation. Opposition supporters, opposition candidates and journalists risk torture, arbitrary arrest and political imprisonment – all strategies the government uses to ‘win’ elections.Footnote 1 For example, in the run-up to the 2005 parliamentary elections in Azerbaijan, facing the possibility that the ‘colour revolutions’ of Georgia and Ukraine would spread, the government arrested journalists and attempted to prevent the opposition from campaigning. The police detained over 1,000 activists before the election, and jailed hundreds without legal cause.Footnote 2 After the election, amid accusations of fraud, the government announced that the ruling party won an overwhelming majority, with the next-largest opposition coalition winning only eight parliamentary seats. Reputable international observers, who documented fraud in more than 43 per cent of observed precincts, condemned the elections.Footnote 3 More than 7,000 opposition supporters protested the results. Riot police and military forces dispersed the protesters using clubs and water cannons, and several opposition politicians were beaten.Footnote 4 In the end, despite an international and domestic backlash against the regime, the incumbent remained in power.Footnote 5
Government-sponsored election violence – events in which incumbent leaders and ruling party agents employ or threaten violence against the political opposition or potential voters before, during or after elections – is common. Figure 1 depicts the yearly number of elections in our sample characterized by pre- or post-election violence from 1960 to 2010. The prevalence of election violence raises several questions: When are governments likely to use election violence? And perhaps more importantly, what can mitigate the incentives to use violence?
Election violence over time Note: based on data from the National Elections Across Democracy and Autocracy dataset.8 Pre-election violence is a count of all elections in which the government harassed the opposition or used violence against civilians. Post-election violence is a count of all elections in which the government used violence against protesters following the election.

Although political violence occurs in many forms, this article focuses on the use of election violence by incumbent governments. Governments are the most common – and often the most brutal – perpetrators of election violence.Footnote 6 Using cross-national data on elections and state-sponsored election violence (including threats of violence such as harassment), we present and test a theory of when an incumbent government is likely to use election violence prior to or after an election. Our central argument is that an incumbent's fear of losing power as the result of an election, as well as institutionalized constraints on the incumbent's decision-making powers, are pivotal in her decision to use election violence. While it may seem obvious to suggest that incumbents use election violence in an effort to fend off threats to their power, it is not obvious how to gauge these threats, and a central purpose of our research is to identify sources of information about the incumbent's popularity that can help predict the likelihood of election violence. Our argument applies to government-sponsored violence in both the pre- and post-election periods, although the election-related threats to an incumbent's hold on power are different before and after the election.
In the pre-election period (leading up to and including election day), incumbent governments may use violence in an effort to prevent an electoral outcome that is unfavourable to the ruling political party or incumbent candidate. Pre-election violence can alter the election results in the incumbent's favour by reducing her electoral competition. More specifically, violence can provoke the political opposition to boycott the election and/or influence voter turnout in the incumbent's favour, both of which increase the probability that the incumbent will stay in power.Footnote 7 Thus, a government has the incentive to use pre-election violence when the incumbent candidate or party believes the election outcome could be unfavourable. However, fear of losing power is not sufficient to provoke the incumbent to use violence. Even when she has reason to believe that an election threatens her survival in office, institutionalized constraints on an incumbent's decision-making powers make violent election strategies hard to implement and risky; they increase the odds that she will be constrained by accountability groups such as a legislature, ruling party, military or court. When the incumbent is uncertain about her victory, institutionalized constraints on her decision-making powers mitigate her incentives and opportunities to use pre-election violence.
In the pre-election period, the primary threat to the incumbent is losing the election.Footnote 9 In the post-election period, however, a central threat to the incumbent – who has survived the election or refuses to step down – is mass protest against the election process or results.Footnote 10 Although post-election protests are relatively rare, an incumbent's decision to use pre-election violence (and other fraudulent strategies) to stay in power amplifies the risk of public demonstrations against the handling or outcome of the election if the incumbent wins. Protests can be a threat to the incumbent even after the election because they indicate that citizens have solved a collective action problem to mobilize against their government.Footnote 11 They also increase the probability that the incumbent will be forced to hold new elections or step down.Footnote 12 Protests thus provide incentives and opportunities for incumbents that remain in power after an election to use violence against protesters – in other words, protests can create a link between the incumbent's use of violence in the pre-election period and violence in the post-election period. However, institutionalized constraints on the incumbent's decision-making powers also factor into her decision to use violence against protesters. Facing post-election protests that could force her out of power even after surviving the election, an incumbent without strong institutionalized constraints on her rule is more likely to use violence against post-election protesters.
In the remainder of the article, we briefly summarize how our central argument builds on existing research across several distinct research agendas, outline our theory and its observable implications in greater detail, provide examples, introduce our statistical strategy and present the findings.
Democracy, Elections And Repression
Scholars of comparative politics generally agree that holding elections does not mean that a country is democratic.Footnote 13 In fact, less than half of the governments that now hold direct elections for national office do so within a context of consolidated democratic political institutions and respect for human rights.Footnote 14 Yet there is little debate that elections, like protecting human rights, are necessary for democratic governance.Footnote 15
The relationship between democracy and the protection of human rights is enshrined in numerous international agreements, including the Universal Declaration of Human Rights. Countries including the United States and most European states promote democracy globally in part because of the idea that full protections for human rights require democratic government: democracy increases liberty, freedom and security for citizens. Evidence shows that stable liberal democracies are much more likely than other types of governments to respect human rights,Footnote 16 although political transitions often include high levels of coercion, and democratizing governments do not always respect human rights.Footnote 17
Yet as elections have spread to nearly every country in the world, so have complaints about the role of violence in democratization and the use of violence as an electoral tool. Scholars have argued that elections increase political polarization and potentially increase human rights abuses in countries without a well-developed respect for the rule of law, and that even politicians in democracies can have strong incentives to use violent electoral tactics.Footnote 18 By contrast, others have argued that elections in illiberal states eventually bring about broader political participation, civic engagement and political accountability, all of which will improve respect for human rights over time.Footnote 19
Cross-national statistical studies of repression and elections are abundant, but the existing data have hampered efforts to distinguish between elections in which incumbents use violence and those that do not, leading to contradictory findings.Footnote 20 In addition, existing work has largely focused on documenting when human rights abuses increase during election years, rather than explaining variations in the use of various forms of election violence – both between elections and during different phases of the election process.
For example, in his path-breaking study of forty-nine countries from 1948 to 1982, Christian Davenport found that authoritarian governments were statistically more likely to reduce censorship and political restrictions during national election years, perhaps in an effort to legitimize the regime by giving citizens access to political leaders. He found no relationship between elections and political repression in transitional or democratic countries.Footnote 21 In a follow-on study, he found that governments also tend to reduce media restrictions during election years, perhaps as a way to institutionalize dissent.Footnote 22 David Richards, however, in a study of elections in seventy-four countries (including some autocracies) from 1981 to 1987, found that the presence of national elections had no effect on general levels of government respect for human rights in an election year.Footnote 23 Focusing on democracies, David Cingranelli and Mikhail Filippov argued that both incumbents and opposition leaders strategically choose to engage in (or ignore) poor human rights practices in the absence of proper electoral incentives, and that among democracies, certain electoral rules are associated with better protections for human rights.Footnote 24
What is clear from the research agenda on elections and repression is that there is a strong connection between a stable, liberal democratic form of government and government protection for certain human rights, but that many elections are taking place in countries where democracy has yet to be fully consolidated. To date, research in this field has not used measures of election-specific violence perpetrated by incumbent governments, nor has it distinguished between the pre- and post-election periods. Instead, it mostly relies on aggregate annual measures of human rights abuses, which may or may not be related to election-specific violence. And it has produced conflicting results about the relationship between repression and elections.
Protest And Repression
As this article demonstrates, election violence can spark protests that lead to more government-sponsored election violence. From 1960 to 2010 there were more than 350 unique cases of post-election protest.Footnote 25 Although there is a rich literature on how various kinds of protests increase the use of repression generally, and a smaller literature on the role of elections in sparking protests, few empirical studies have examined both election protests and election-specific violence.
Existing research on (non-electoral) protest has found evidence that government repression provokes various forms of public dissent, including protests, strikes, demonstrations and rebellions.Footnote 26 Studies also have found that the use of repression has led to protests. Davenport documented that governments tend to respond to domestic threats such as protests with repression, and that they are more likely to apply censorship and political restrictions as the frequency and intensity of dissent rises.Footnote 27 Sabine Carey, however, found that only guerrilla warfare increases the risk of political repression, whereas non-violent or spontaneous forms of dissent do not create threats that are substantial enough to warrant a violent government response.Footnote 28 Other studies have shown that the relationship between repression and dissent is non-linear: governments overreact to small demands with violence, but as demands increase governments often exercise more restraint.Footnote 29 In some cases, government repression and accommodation in response to protests have been substitutes.Footnote 30
A separate research agenda focuses on elections that provoke protest afterwards. The most relevant finding of this research is that manipulated elections can serve as a focal point for collective action, and post-election protest (or the threat of protest) can be an important part of self-enforcing democracy.Footnote 31 Consistent with this research, this article documents that election fraud and violence in the pre-election period make post-election protest more likely.
We build upon this research to investigate the role that post-election protest plays in a government's decision to use violence following an election and evaluate the relationship between pre-election violence, post-election protest and the use of violence against protesters.
Argument And Implications
Our central argument is that information about an incumbent's popularity in different phases of the election cycle, and institutionalized constraints on her decision-making powers, work together to influence her decision to use election violence prior to and after an election. In brief, if an incumbent anticipates an unfavourable electoral outcome – such as an outright win for the opposition or a result that makes the incumbent look weak – she has incentives to use violence in the pre-election period as a strategy to stay in power. Pre-election violence can help the incumbent stay in power by reducing her electoral competition: inducing opposition parties to boycott, making it less likely that a promising opposition candidate will run or manipulating voter turnout, all of which make a manufactured ‘victory’ more likely. However, not all incumbents act on these incentives. As we will explain below, accountability groups that place institutional constraints on the incumbent can mitigate incentives for violence. The implication is that an incumbent who is uncertain about electoral victory and does not face significant institutional constraints is more likely to use election violence.
The incumbent's decision to use violence (or fraud) in an effort to reduce her electoral competition during the election can lead to an unintended consequence: public demonstrations against the handling or outcome of the election. Although it is relatively well documented that pre-election violence and fraud can trigger post-election protest, this relationship has not yet been evaluated within the broader context of when incumbents choose to use election violence.Footnote 32 For our purposes in this article, protests are important because they can topple governments, leading to the resignation of the incumbent or new elections. Thus, like the threat of an unfavourable electoral outcome, such as losing the election, post-election protests can threaten the incumbent's hold on power and thus create incentives for the incumbent to use violence against protesters, particularly when she faces few institutionalized constraints.
Because pre-election violence is one factor that can lead to post-election protest, and because post-election protest can provoke violence, another observable implication of our argument is that the decision to use violence in the pre-election period can create incentives to use violence in the post-election period. Finally, and consistent with the implications of our argument in the pre-election period, if post-election protests occur, an incumbent who lacks significant institutional constraints is more likely to use violence against protesters.
Fear of Losing Power
Elections put incumbents in a bind: they can bring a number of advantages, such as legitimizing a leader's hold on power, but they may also introduce uncertainty regarding their outcome.Footnote 33 The fear of losing power because of an election (losing the vote, facing post-election protest or other unfavourable outcomes) can prompt an incumbent to respond with various types of political repression, including violence.Footnote 34 These threats to the incumbent motivate election violence, but these threats take different forms in the pre- and post-election periods, which we describe in the next sections.
Pre-election violence
Prior to an election, the incumbent government must anticipate whether the outcome of the election is likely to be favourable to her and/or her party. If she believes that she is popular enough to win the election outright (or to win by a large enough margin), pre-election violence – as one potential tactic in the ‘menu of manipulation’ – is unnecessary, risky and even counterproductive.Footnote 35 However, if she cannot be certain of a decisive victory, or if she believes that the election outcome is likely to be unfavourable, she may resort to pre-election violence (alongside other fraudulent strategies) in an effort to reduce her political competition.
In the pre-election period, election violence is a strategy to reduce the incumbent's political competition in at least two ways. Harassment of the opposition – for instance, the incarceration and torture of opposition candidates – increases the likelihood that the opposition will boycott the election. When opposition parties withdraw before an election takes place, the incumbent government's odds of winning improve substantially.Footnote 36 A second way in which pre-election violence makes a favourable electoral outcome more likely is by influencing who turns out to vote. The incumbent government may use violence in an effort to persuade voters to stay home on election day, coerce would-be opposition voters into voting for the incumbent or threaten voters who would otherwise prefer to abstain into turning out to vote for the incumbent.Footnote 37 Such methods of intimidation, which increase turnout for the incumbent and decrease turnout for the opposition, are often combined with other methods of election fraud.Footnote 38
In Cambodia's UN-administered elections in 1993 – the country's first potentially democratic, multiparty elections – the incumbent government's Cambodian People's Party (CPP) faced a strong challenge from the royalist National United Front for an Independent, Neutral, Peaceful and Cooperative Cambodia (FUNCINPEC) party, and sought to use violence to intimidate their candidates and supporters in order to reduce electoral competition. According to one opposition party operative, ‘the State of Cambodia is creating the terror because they know that FUNCINPEC will win’.Footnote 39 The Cambodian government was responsible for over seventy documented killings – and more than 100 injuries – of members of the political opposition prior to the election.Footnote 40 The perpetrators were affiliated with the government and the political parties that were most threatened by the elections: the CPP, led by Prime Minister Hun Sen, and the party affiliated with the ‘Khmer Rouge’, which boycotted the elections.Footnote 41 Ultimately, the incumbent party's fears were justified, as they fell far short of a majority and only managed to join the ruling coalition when CPP leader Hun Sen threatened to reignite the country's civil war.
Incumbents are most threatened by elections when they might lose, but judging whether they might lose is difficult, particularly in countries in which the flow of information is restricted and expression is limited. Some incumbents are able to gauge their popularity prior to an election through public opinion polls, and the most straightforward electoral threat to the incumbent is revealed by reliable public opinion polls that indicate the incumbent is unpopular. If reliable polls indicate that the incumbent is likely to lose the election, she will be more likely to use election violence in an effort to reduce her political competition; if reliable polls indicate that she is popular, violent pre-electoral tactics are unnecessary.
Yet a lack of information about the incumbent's popularity can also signal a threat. If public opinion polls are not available, or if polls are known to be unreliable, the incumbent may have difficulty estimating her actual popularity; thus her chances of a favourable election outcome will be uncertain. We expect that if reliable polls are not available prior to the election, the incumbent may also resort to election violence. Both uncertainty about her popularity and reliable proof of her unpopularity prior to an election can motivate an incumbent to use election violence as a strategy to stay in power.
Polls are not the only source of information about the incumbent's popularity. The incumbent's and opposition candidates’ own statements about their probability of victory provide additional clues as to whether the incumbent appears to be concerned about an unfavourable election outcome. In general, a leader who is confident of victory has little reason to use election violence. Gauging the incumbent's level of confidence is thus another way to gauge the threat to the incumbent and predict the likelihood that she will use violence.
Post-election violence
Even after election day, incumbents who remain in power may still be challenged by an election-induced threat. One of the main sources of threats comes from public protests. Post-election protests indicate that citizens are willing to mobilize against the regime and have solved their collective action problem.Footnote 42 Post-election protest can reduce the incumbent's credibility and build momentum to unseat her.
Figure 2 shows the history of post-election protests and their ‘success’ in contributing to the cancellation of an election or the resignation of the incumbent. An increasingly large share of protests has resulted in the ouster of the incumbent or the cancelling of an election. Like polls or other information about an incumbent's popularity in the pre-election period, protests can serve as an indicator of the incumbent's popularity in the post-election period.
History of post-election protests and protest ‘success’ Note: successful protests include any case in which election protests contributed to an election being cancelled or an incumbent being deposed. Repressed protests are cases in which the government used violence against demonstrators.43
Existing scholarship demonstrates that post-election protests are triggered by (among other things) election violence and fraud.Footnote 44 Although an incumbent uses pre-election violence in an effort to reduce her electoral competition, her decision to use violence before an election can have the unintended consequence of increasing the likelihood of post-election protest. Because post-election protests are a threat to the incumbent government's power, they can provoke the incumbent to respond with more violence in an effort to dissolve public protest and stay in power.Footnote 45
Institutionalized Constraints
We have thus far focused on how the fear of losing power, either because of the election or because of post-election protest, can provide incumbents with a motivation to use violence. Yet a number of incumbents who are not confident of a decisive victory prior to an election, or who face protests after the election, never turn to violence as a strategy to stay in power. A leader's choice to use election violence is constrained by her ability to engage in, and the anticipated consequences of engaging in, violence in both stages of the election cycle. During both stages, ‘institutionalized constraints’ on the authority of the incumbent leader may be imposed by accountability groups including legislatures, ruling parties, councils of nobles, military and courts.
One way that institutionalized constraints can reduce the likelihood that an incumbent will resort to election violence is by preventing her from taking actions such as issuing directives, mobilizing the police for partisan harassment or making policy decisions that will result in violence. An example of this form of institutionalized constraint is a legal limitation on the incumbent's ability to declare a state of emergency. A government that declares a state of emergency, for instance, can legally restrict certain human rights, which can lead to violence.Footnote 46 However, some executives cannot use this policy without oversight from national accountability groups such as legislatures. In Guinea-Bissau and South Africa, only the legislature has the power to declare a state of emergency, while in Haiti the legislature must approve a state of emergency and thus acts as a check on the executive's decision-making powers.Footnote 47
Another way that institutionalized constraints can mitigate violence when the incumbent is uncertain of victory (or faces post-election protests) is by threatening to hold her accountable for the decision to use violence. Violence can lead to legal or political prosecution.Footnote 48 Human rights abuses – such as torturing the political opposition or opening fire on citizen protesters – are in most cases illegal and unpopular among citizens. When they face powerful accountability groups, perpetrators of such crimes risk getting caught and punished either while they are in office, or after they are no longer in power. Legislatures and courts may punish leaders for perpetrating violence. For example, the Extraordinary Chambers in the Courts of Cambodia (which involves both national and foreign justices) sentenced former Khmer Rouge leader Kaing Gech Eav for crimes against humanity and war crimes, including his role in overseeing the torture and death of more than 10,000 people in the 1970s – a time when he had no reason to believe he would one day be held accountable.Footnote 49 He was sentenced to life in prison and required to testify in the trials of three other former leaders in the Khmer Rouge. Consistent with this example, we argue that election violence is an attractive strategy for leaders facing an uncertain election only when serious consequences are not anticipated because constraints on the incumbent's decision-making powers are not deeply institutionalized.
Observable Implications
To summarize, our argument generates three observable implications, which we examine in the remainder of this article: (1) an incumbent who is uncertain about electoral victory and does not face significant institutional constraints is more likely to use election violence; (2) an incumbent who uses pre-election violence (or fraud) increases the likelihood of post-election protest against her regime and (3) facing protests, an incumbent who lacks significant institutional constraints is more likely to use violence against protesters in the post-election period. In the next section we provide examples of these implications in elections in two countries with prominent histories of election violence.
Illustrative Examples
We have chosen five elections in two electoral autocracies – Zimbabwe and Iran – to illustrate the observable implications of our argument at different stages in the election process. In both countries, leaders faced the threat of losing power as a result of an election process and had few institutionalized constraints preventing or discouraging election violence. The cases vary, however, in the factors that provoked – and the timing of – election violence. For each election described, we present detailed monthly data on instances of election violence collected from an analysis of all reports available on Lexis-Nexis, as well as supplemental materials by non-governmental organizations (NGOs) and election watchdogs for the pre- and post-election periods.Footnote 50
Election Violence in Zimbabwe
Robert Mugabe has been president of Zimbabwe – a nominal parliamentary democracy – since the country gained independence in 1980. Since 2000, Mugabe and his political party associates in the Zimbabwe African National Union-Patriotic Front (ZANU-PF) have faced opposition from the Movement for Democratic Change (MDC) and their leader, Morgan Tsvangirai. Presidential and legislative elections in 2000, 2002, 2005 and 2008 show variation in the degree to which the MDC threatened ZANU-PF's hold on power, culminating in the very close 2008 presidential elections that nearly resulted in an end to Mugabe's rule. In addition to using direct electoral fraud, ZANU-PF has regularly rigged elections in its favour by terrorizing political opposition members and supporters in an effort to reduce the competition.Footnote 51
Elections in Zimbabwe show how even an autocratic leader like Mugabe can feel threatened by the electoral process and therefore become motivated to employ tactics of election violence. Reliable public opinion polls were virtually non-existent prior to elections in 2000, 2002, 2005 and 2008. Although autocratic leaders like Mugabe tend to project confidence before elections, a suppressed informational environment generates uncertainty about their true popularity and creates incentives to use tactics of manipulation pre-emptively in order to avoid any unfavourable electoral outcomes.
Uncertainty about Mugabe's true popularity created incentives for the ZANU-PF to violently harass MDC candidates and target – and even kill – citizens prior to each election. The violence worked to reduce electoral competition, provoked several opposition boycotts and manipulated voters into supporting ZANU-PF.Footnote 52 Mugabe's authority was virtually unchecked by domestic accountability groups: there were very few regular limitations on the president's actions, the constitutional restrictions on his actions were largely ignored, the legislative assembly had limited power or independence, and rule by decree was often used.Footnote 53 These conditions – uncertainty about the regime's popularity, a potential threat from an opposition movement and few institutionalized constraints – explain the repeated bouts of pre-election violence in Zimbabwe.
To illustrate the patterns of election violence in detail, Figure 3 maps monthly data on state-sponsored violence before and after elections in Zimbabwe. The figure shows the increase in politically motivated violence, both in terms of the number of events and the number of people affected, across four elections: the 2000 parliamentary elections, the 2002 presidential elections, the 2005 parliamentary elections, and concurrent presidential and parliamentary elections in 2008, including a run-off.
Variation in political violence by election in Zimbabwe Note: the count of events and deaths is based on a search of all news reports and human rights reports, including those available on Lexis-Nexis, for cases of election-related and government-sponsored human rights abuses in the pre- and post-election periods (one year before and one year after election day).
Mugabe won the 1996 presidential elections with more than 90 per cent of the vote. The opposition was not particularly strong, and the 2000 elections were the first in which any opposition party posed a real challenge to the ZANU-PF dominance. As the Financial Times reported, the MDC ‘managed to defy a state-sponsored campaign of violence and intimidation to attract voters from all regions and ethnic groups…’Footnote 54 Mugabe stepped up his efforts to use election violence prior to the election and ‘showed signs of nervousness as votes were counted…positioning armed riot police in Harare and the nearby suburb of Budiriro’, conceivably in an effort to prevent post-election protests.Footnote 55
Although the MDC had little chance of winning the 2000 legislative elections (in part because Mugabe could appoint thirty of the 120 legislative seats), the newly formed MDC was widely viewed as a serious challenger to Mugabe's authority. As a result, during the 2000 election, police, intelligence officials, war veterans and ZANU-PF supporters murdered, tortured and intimidated MDC supporters: the government reportedly killed more than thirty people for political reasons.Footnote 56 Violence began several months prior to, and spiked during, the election (Figure 3).
Since 2000, the MDC has threatened Mugabe's hold on power, particularly during elections. In response, Mugabe's government has engaged in a campaign of election-related violence against the MDC, especially during presidential elections in which his personal hold on power is most directly threatened. In 2002, prior to and during the presidential election, ZANU-PF ran torture camps across Zimbabwe to ‘re-educate’ opposition supporters.Footnote 57 The Times of London reported that the violence campaign led to dozens of deaths and disappearances and hundreds of abductions, assaults and torture victims.Footnote 58 As in 2000, violence began in 2002 several months prior to the election, and hundreds of people were victimized in the months immediately following the election, including 344 members of the Young Women's Christian Association who were arrested during a peaceful post-election protest against the results of the presidential election.Footnote 59 Not included in these figures are MDC supporters who fled Zimbabwe after the election, fearing persecution.
The US State Department accused ZANU-PF of manipulating the electoral process in 2005 through corruption and intimidation, including unlawful killings, politically motivated kidnappings and state-sanctioned actions by security forces to torture members of the opposition, union leaders and civil society activists.Footnote 60 Mugabe's use of violence was somewhat lower than in the other elections shown in Figure 3, in part because the ZANU-PF also relied on the politicization of food aid during a period of severe economic crisis, which we did not code as a form of election violence.Footnote 61 In this election, the party also employed the support of traditional leaders, who threatened their subjects with eviction if they failed to vote correctly.Footnote 62
The 2008 elections marked the first concurrent presidential and parliamentary elections, and were the most serious threat to Mugabe. Before the 2008 presidential election Mugabe banned all political rallies and arrested Tsvangirai – ostensibly for violating the ban while attending a prayer meeting. Tsvangirai was severely beaten, sustained a massive head injury and was denied access to medical treatment.Footnote 63 Nevertheless, the challenge posed by Tsvangirai and the MDC was greater than in any previous election, and the MDC won a parliamentary majority for the first time, clearly indicating that Mugabe's regime, and Mugabe himself, were increasingly threatened by the electoral process and by the increasing public support for the MDC. The government delayed releasing the results of the presidential election for more than a month, a move perceived to be an effort to remedy Mugabe's poor performance. When official election results were finally announced, ZANU-PF received 43 per cent of the vote and MDC received 47 per cent, just shy of the 50 per cent majority needed to win the first round outright. Before the run-off, Mugabe's agents instigated a deadly wave of violence against MDC supporters. Due to the degree of violence directed toward his supporters, with more than eighty-five confirmed murdered and thousands injured, Tsvangirai chose to boycott the run-off in an effort to avoid risking the lives of more of his supporters in this ‘violent, illegitimate, sham of an election process’.Footnote 64
In summary, the lack of institutionalized constraints in Zimbabwe from 2000–2008, and Mugabe's use of election violence in response to his waning popularity, illustrate part of our argument. Election violence was triggered by the rising popularity of the MDC and was successful at generating short-term reductions in political competition.
Post-election Violence in Iran
The 2009 election in Iran illustrates a case in which the highest levels of violence occurred in the month after the election, as a response to public protest against fraudulent results. Like in Zimbabwe, the chief executives in the Iranian government experience very few institutionalized constraints on their decision-making powers. This combination of unpopularity and mass post-election protest against a government with few institutionalized constraints helps to explain why the government resorted to significant violence against protesters.
Typically, the Iranian Guardian Council's process of candidate screening guarantees that the majority of candidates are prohibited from running. In 2009, the incumbent, President Ahmadinejad, was apparently caught by surprise when popular sentiment turned against him just before the election, and (albeit unreliable) polls conducted a few days prior to the election suggested that one of the permitted candidates, Mir-Hossein Mousavi, could gain enough votes to force a run-off election.Footnote 65
Following the election, both candidates declared victory. In an abnormally rapid vote ‘count’, authorities declared the incumbent president the winner. Protests erupted and millions of people took to the streets to dispute the fraudulent results. The protests were a clear indication of the people's dissatisfaction with the incumbent and a threat to the regime's legitimacy; the government responded with violence. On 14 June, plain-clothes forces attacked a Tehran University dormitory and reportedly killed five student protesters. On 16 June, the government banned foreign journalists from the streets and arrested almost 100 people, including former government ministers and senior political figures. Riot police dispersed protests in Tehran and were videotaped killing Neda Agha, a young bystander who became an icon for the anti-government movement. Protests continued and the government responded with more violence. Over the next few months 4,000 protesters would be arrested, and others would be killed as a direct consequence of election-induced violence. Figure 4 maps monthly data on state-sponsored violence before and after the 12 June 2009 election, illustrating the increase in election violence in terms of the number of events and number of people affected.
Variation in political violence in Iran, 2009 presidential election Note: the count of events and deaths is based upon a search of all news reports and human rights reports, including those available on Lexis-Nexis, for cases of election-related and government-sponsored human rights abuses in the pre- and post-election periods (one year before and one year after election day).
As President Ahmadinejad was sworn into office, government-controlled courts began show trials, with many detainees allegedly coerced into confessing that they participated in a foreign-backed attempt to overthrow the government. Security officials shut down the offices of a committee collecting information about torture and other abuses against protesters and detainees. Journalist Ali Reza Eshraghi was sent to prison, followed by academic Kian Tajbakhsh and other prominent intellectuals, political figures and journalists. Many were sentenced to death.Footnote 66 The secrecy surrounding the vote tally means that what actually unfolded is not public, but observers speculate that the Iranian leadership, having already screened the presidential candidates, was uncomfortable with any results that would have suggested a close election. Facing a worse-than-expected performance by the incumbent, they engaged in a hurried falsification of the results.
In short, the election revealed that an opposition candidate posed a greater threat to Ahmadinejad than anticipated, and perceived election fraud provoked a post-election protest movement that further threatened the regime's grip on power. In response to this threat, the government diffused protests by committing widespread violence against protesters, detaining and killing leaders of the opposition movement, and creating a climate of fear. The leaders of Iran responsible for the political violence, like the leaders of Zimbabwe, had few institutionalized constraints on their decision-making powers and could order and carry out violence with little reason to fear accountability.
Elections in Iran and Zimbabwe illustrate how unpopular governments use political violence to manipulate elections in the pre-election period – provoking boycotts and manipulating voters – and suppress dissent in the post-election period – harassing, even killing, protesters. In the next section we evaluate our broader argument using new cross-national data on the use of election-related violence.
Cross-National Analysis
In order to more systematically assess the observable implications of our argument, we use a cross-national analysis of elections data from 1981–2004, much of which comes from the newly available National Elections across Democracy and Autocracy (NELDA) dataset.Footnote 67 These data contain information on elections for national office for all sovereign states with a population greater than 500,000, including detailed information on the existence of several types of election violence, as well as information on post-election protest.Footnote 68 Sources for the NELDA data are diverse and rely primarily on newswire reports, newspaper archives, academic research (including data handbooks on elections),Footnote 69 archives from specific countries and from intergovernmental organizations such as the Inter-Parliamentary Union, and other sources that are listed in the dataset's codebook.Footnote 70
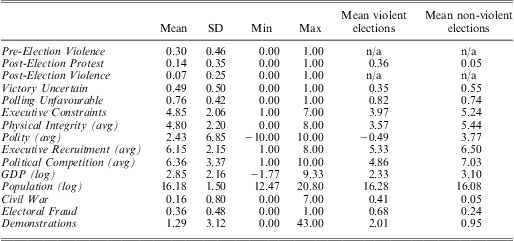
These data allow us to conduct more fine-grained tests of the correlates of election violence than existing cross-national studies, most of which do not measure election violence directly but instead rely on aggregate annual indicators of various forms of human rights abuses on entire country populationsFootnote 71 or aggregate counts of demonstrations or protests that may or may not be election related.Footnote 72 In contrast to annual indices of political repression, which measure human rights abuses during a given calendar year, our data focus on election-specific violence perpetrated by the incumbent government and distinguish between pre- and post-election violence against civilians and opposition parties. These data also measure other election- and regime-specific characteristics central to our argument, such as whether public opinion polls are available and reliable and whether the incumbent has made public statements alluding to their confidence of victory. Table 1 provides summary information for each of the variables used in the subsequent analysis.
Summary Information
Note: (avg) indicates the three-year moving average lagged by one year.
Pre-Election Violence
The first observable implication of our argument is that an incumbent who anticipates an unfavourable election outcome and lacks significant institutional constraints on her decision-making powers is more likely to use election violence. To test this implication, we estimate the following two models for each election i in country j:
 $${ & Pr(Pre {\hbox {-}} Election\,Violenc{{e}_{ij}}\, = \,1)\, = \,f\,({{\beta }_1}\,Polling\, Unfavourabl{{e}_{ij}}\:\cr &\times \:Executive \ Constraint{{s}_{ij}}\: + \:{{\beta }_2}\ Polling\ Unfavourabl{{e}_{ij}}\: \cr & + \:{{\beta }_3}\ Executive\ Constraint{{s}_{ij}}\: + \:\varphi {{X}_{ij}}\: + \:{{\gamma }_i} + {{{\epsilon}}_{ij}}) }$$
and
 $${ & Pr(Pre{\rm{ {\hbox {-}} }}Election\ Violenc{{e}_{ij}}\:\,=\, \:1)\: \,=\, \:f\,({{\beta }_1}Victory\ Uncertai{{n}_{ij}} \:\cr &\times \:Executive\ Constraint{{s}_{ij}}\:+ \:{{\beta }_2}\,Victory\,Uncertai{{n}_{ij}}\:\cr &+ \:{{\beta }_3}\,Executive\,Constr aint{{s}_{ij}}\:+ \:\varphi {{X}_{ij}}\:+ \:{{\gamma }_i}\:+ \:{{{\epsilon}}_{ij}}), \cr}$$
where Xij is a vector of control variables and γi are country random effects that account for the likelihood that the effect of electoral uncertainty may differ systematically for each country. Since our argument is about the threat of losing power, we limit our analyses to any national election in which the office of the incumbent is at stake.Footnote 73
We code our dependent variable, Pre-Election Violence, as 1 if the government engaged in election-specific violence against civilians (coded from Nelda33) or harassed political opposition members (Nelda15), and 0 otherwise.Footnote 74 According to the NELDA codebook, Nelda33 includes ‘any significant violence relating to the elections that resulted in civilian deaths’. Nelda33 includes no specific threshold for deaths, but violence must be ‘significant’ and at least one civilian must have been killed. Violent attacks against civilians, such as bombings, do not count unless they result in civilian casualties. Harassment of political opposition members (Nelda15) may include a more diverse set of activities, including murder, torture, beatings, violence against participants in opposition rallies, indefinite detention of candidates or opposition supporters, forced eviction, harassment of media and a number of other methods.Footnote 75 The NELDA data do not define any specific time period during which election violence is possible, and the coding is specific to each round of an election rather than more aggregated units like country-years. Violence is coded as election related if reports connect the violence or harassment to the election in any way. Violence unrelated to elections is not coded in any of the NELDA measures of election violence.
We use two distinct (and unique) measures of whether the election outcome was in doubt. The first measure evaluates information provided by public opinion polls and the second relies on public statements that allude to the incumbent's confidence of victory. Even in authoritarian environments, public opinion polls can provide reliable information about whether an incumbent is certain to win an election, and reliable polls are available in over 63 per cent of our sample. We draw data on polling from two NELDA variables. Nelda25 indicates whether ‘reliable polls … indicated the popularity of the ruling political party or of the candidates for office before elections’. Nelda26 indicates whether those polls were ‘favourable to the incumbent’.Footnote 76 (Incumbents win approximately 76 per cent of elections in which polling existed and was in their favour.) Using these data we create Polling Unfavourable, which equals 1 under two conditions: (1) if reliable polls existed that did not favour the incumbent or (2) if reliable polls did not exist. Polling Unfavourable equals 0 if reliable polls existed and favoured the incumbent.
This variable allows us to test the argument that either a clear signal that the incumbent is unpopular or a noisy signal that creates uncertainty about the incumbent's popularity increase incentives for Pre-Election Violence. We also estimate the model excluding cases without reliable polls (where Nelda25 equals ‘no’) in order to evaluate whether the same logic holds when we limit Polling Unfavourable to cases in which reliable polls existed that did not favour the incumbent.
Our second measure is based on Nelda12, which indicates whether the ‘incumbent or ruling party was confident of victory before the elections’. Nelda12 equals ‘yes’ in cases in which the incumbent made ‘public statements expressing confidence’ of victory, the opposition indicated that they were ‘not likely to win’ or there were cases in which the ‘incumbent or ruling party has been dominant for a number of years and is projected to win in a landslide’.Footnote 77 We created Victory Uncertain, which equals 1 if Nelda12 equals ‘no’ and 0 if Nelda12 equals ‘yes’.Footnote 78 As face validation of this measure, when Victory Uncertain is 1, the incumbent wins approximately 92 per cent of the time.Footnote 79
An important part of our argument concerns institutionalized constraints on the incumbent: leaders are less likely to use violence when they face strong constraints on their decision making powers. To measure these constraints we use Executive Constraints from the Polity IV dataset. This index ranges from 1–7 and measures ‘the extent of institutionalized constraints on the decision-making power of chief executives’.Footnote 80 At the highest level of Executive Constraints, accountability groups such as legislatures and courts have authority equal or greater to that of the executive. Examples of Executive Constraints include the ability of a legislature or ruling party to initiate much (or most) important legislation. Even greater Executive Constraints include cases in which an accountability group, such as a legislature, chooses the executive and the executive is dependent on its continued support to remain in office. At the lowest level of Executive Constraints, leaders have virtually unlimited authority with few, if any, constitutional or legislative constraints. Examples include the frequent revision or suspension of the constitution by the executive, cases in which no legislative assembly exists, and the existence of an assembly that can be called and dismissed at the executive's pleasure. Low Executive Constraints also include cases of extensive executive control over accountability groups – such as a legislature or court.
Since election violence is more likely in repressive regimes, we run the risk of estimating which regimes are more likely to be repressive rather than which regimes are more likely to use election-specific violence. Also, democratic states are more likely to have competitive elections as well as lower levels of repression.Footnote 81 Therefore, we control for the pre-existing level of government repression (as distinct from pre-election violence) by including a measure of Physical Integrity from the Cingranelli-Richards dataset.Footnote 82 This variable is an index (0–8) that measures the annual level of government-sponsored repressive activity, coded mainly from Amnesty International reports. Since this variable is intended to control for overall trends in repression, we use the three-year moving average and lag it by one year to ensure that it is not picking up election-year violence.
We also want to ensure that our results are not an artefact of the level of democracy in a country. We thus include measures of political competitiveness and executive recruitment from the Polity IV project.Footnote 83Political Competitiveness is an index (1–10) that measures both the level of regulation of political participation and the competitiveness of participation. Executive Recruitment is an index (1–8) that measures the openness and competitiveness of executive selection, as well as the institutionalization of executive power transitions. To ensure that Political Competitiveness and Executive Recruitment pick up overall trends in democracy, and not election-specific components, we use the three-year moving average of these variables lagged by one year.
We also include several additional control variables. Because wealth and population influence the use of violence, we include GDP (log) and Population (log) from the World Development Indicators.Footnote 84 Individual leaders may be more likely to use election violence based on their time in office or their experience, and all models therefore include Leader Tenure and Leader Age from the Archigos dataset.Footnote 85 Because internal conflict is correlated with human rights violations, we also include a binary measure of Civil War from the Major Episodes of Political Violence dataset.Footnote 86
All models include Electoral Fraud to account for another prominent tactic of electoral manipulation. Electoral Fraud (Nelda11) is a binary variable that indicates whether there were ‘significant concerns that the elections will not be free and fair’; this measure relates to ‘domestic or international concern’ about the quality of the election, including whether ‘elections were widely perceived to lack basic criteria for competitive elections, such as more than one political party’.Footnote 87 We also include Demonstrations in all models to account for other types of civic mobilization that are distinct from post-election protest, and that also may predict pre-election violence. Demonstrations is a count of the total number of anti-government demonstrations, anti-government strikes and riots during a year (based on Banks Cross National Time Series Data Archive coding).Footnote 88
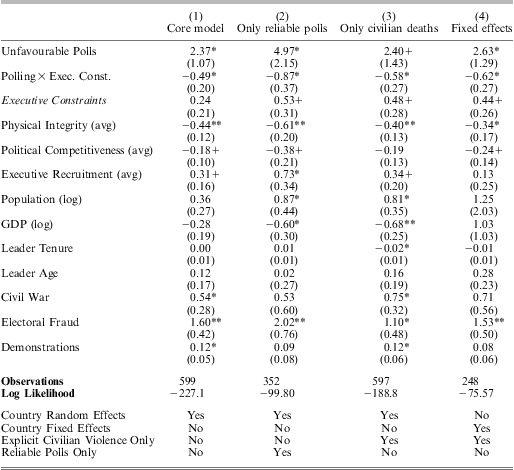
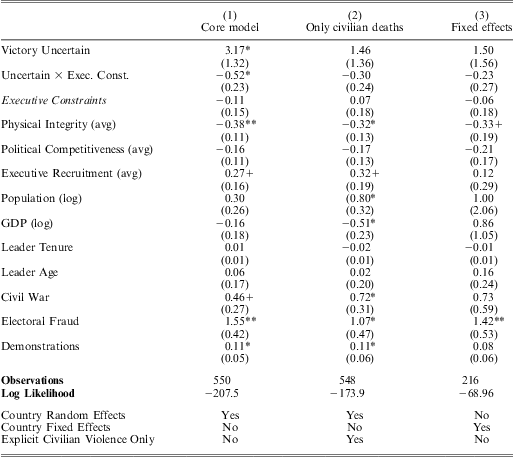
We report our estimates in Tables 2 and 3.
Logit Estimates of the Effect of Polling Unfavourable on Pre-Election Violence
+p ≤ 0.1 *p ≤ 0.05 ; **p ≤ 0.01. Standard errors are in brackets. All models are restricted to elections in which the office of the incumbent is contested.
Logit Estimates of the Effect of Victory Uncertain on Pre-Election Violence
+p ≤ 0.1 *p ≤ 0.05 ; **p ≤ 0.01. Standard errors are in brackets. All models are restricted to cases in which the office of the incumbent is contested.
Figure 5 presents a more meaningful picture of the estimated effect of uncertainty on Pre-Election Violence: it plots the interactive estimates from Table 2, Model 1 and Table 3, Model 1. Each point estimate is the first difference when Polling Unfavourable or Victory Uncertain changes from 0 to 1, estimated at each value of Executive Constraints. The left panel illustrates that when Executive Constraints are at their minimum, a change in Polling Unfavourable from 0 to 1 increases the average probability of Pre-Election Violence by nearly 0.25. The right panel illustrates that when Executive Constraints are at their minimum, Victory Uncertain is associated with an average increase in the probability of Pre-Election Violence of nearly 0.50. When Executive Constraints are at their maximum, there are no significant effects of either Polling Unfavourable or Victory Uncertain. Incumbents are more likely to resort to election violence when they cannot be certain of a decisive victory; however, the presence of institutionalized constraints mitigates these incentives to use violence.
Effect of Polling Unfavourable and Victory Uncertain on Pre-Election Violence Note: the effects of Polling Unfavourable and Victory Uncertain on the probability of Pre-Election Violence are shown as simulated first differences. For each value of Executive Constraints, point estimates represent the change in the probability of Pre-Election Violence when the relevant variable (Polling Unfavourable or Victory Uncertain) changes from 0 to 1. Estimates are based on Table 2, Model 1 (for effects of Polling Unfavourable) and Table 3, Model 1 (for effects of Victory Uncertain). Vertical lines indicate the 95 per cent confidence interval.
Tables 2 and 3 also provide alternative specifications of the core models.Footnote 89 Beginning with the polling estimates shown in Table 2, Model 2 drops all cases in which reliable polls are not available. This limited sample includes only cases in which reliable polls existed that were not favourable to the incumbent. The coefficients remain consistent in sign and significance with those reported in Model 1. When Executive Constraints are at their minimum in this model, a change from 0 to 1 (favourable to unfavourable polls) is associated with a 0.25 increase in the average probability of Pre-Election Violence.
In Table 2, Model 3, we recode Pre-Election Violence to exclude harassment of political opposition members (Nelda15). This change focuses the analysis on whether the government engaged in election-specific violence against civilians (Nelda33), which is a much narrower conception of election violence than our definition. The coefficients are consistent in sign and significance with the coefficients in Model 1, although the estimated substantive effect is smaller. When Executive Constraints are at their minimum in this model, a change from 0 to 1 in Polling Unfavourable is associated with an increase of 0.04 in the average probability of significant election-related violence that resulted in civilian deaths.
Finally, in Table 2, Model 4, we re-estimate the model using country fixed effects. This specification validates that our results are not just driven by time-invariant characteristics of countries, such as unobserved institutional or geographical characteristics. Yet because many countries have no cases of Pre-Election Violence, country fixed effects yield results that we interpret with care. All observations from countries without variation in election violence drop out of the model. The coefficients on our variables of interest remain very similar to those from the random-effects models. We do not provide predicted probabilities for the fixed-effects models, because doing so in a country fixed-effect logit model is problematic.Footnote 90
Next we turn to the alternative specifications shown for Victory Uncertain. In Table 3, Model 2, we restrict the analysis to cases of election-specific violence involving civilian deaths. Although the signs on the coefficient estimates are consistent with the estimates reported in Model 1, the estimated effect of Victory Uncertain on Pre-Election Violence is insignificant for all levels of Executive Constraints. In our view, including harassment and violence involving the political opposition in the operationalization of pre-election violence is much closer to our theoretical conception of election violence. Limiting the measure to only those cases of election violence that involve civilian deaths is a much narrower conception of election violence, thus the smaller coefficient is unsurprising.
In Table 3, Model 3, we provide estimates of our core model using country fixed effects. The coefficient on Victory Uncertain is still positive, but about half its original size, perhaps because the fixed-effects model drops more than half of our observations, or because the relationship is more apparent between, rather than within countries over time.
Post-Election Protest and Violence
We analyse post-election protests in this article because, when they occur, protests are a central source of threat to an incumbent's hold on power in the immediate post-election period. In estimating post-election protests the relevant universe of elections therefore includes those elections in which the incumbent has not lost and conceded defeat in the immediate post-election period.Footnote 91 The existing literature suggesting that fraud and pre-election violence increase the probability of post-election protest informs our models of protest.Footnote 92 Our estimation approach for predicting post-election protest is represented below for each election i in country j:
 $$Pr(Post{\rm{ \hbox{-} }}Election\ Protes{{t}_{ij}}\: = \:1)\: = \:f\,({{\beta }_1}\,Pre{\rm{ \hbox{-} }}Election\ Violenc{{e} _{ij}}\: + \:\varphi {{X}_{ij}}\: + \:{{\gamma }_i}\: + \:{{{\epsilon}}_{ij}},)$$
and
 $$Pr(Post{\rm{ \hbox{-} }}Election\ Protes{{t}_{ij}}\: = \:1)\: = \:f\,({{\beta }_1}\,Electoral\ Frau{{d}_{ij}}\: + \:\varphi {{X}_{ij}}\: + \:{{\gamma }_i}\: + \:{{{\epsilon}}_{ij}},),$$
where Xij is a vector of control variables and γi are country random effects. We measure Post-Election Protest using Nelda29, which indicates whether there were ‘riots or protests after the election’ that were ‘at least somewhat related to the outcome or handling of the election’.Footnote 93Electoral Fraud (Nelda11) measures whether there were concerns before the election that it would not be free and fair.Footnote 94 As in the pre-election models, we control for the three-year lagged moving average of Physical Integrity, as well as for GDP (log), Population (log), Leader Tenure, Leader Age and Civil War. We also control for the three-year moving average of Polity, coded from the Polity IV dataset.Footnote 95
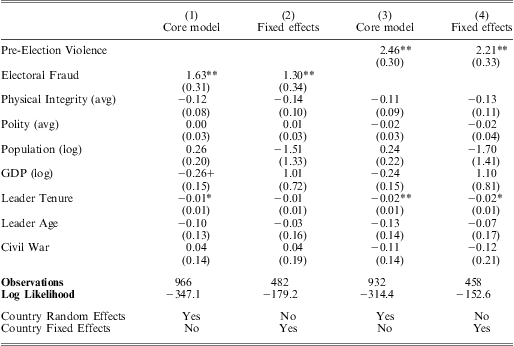
We present logit estimates of these equations in Table 4 and illustrate the results of our core models in Figure 6, which shows the simulated effect of Pre-Election Violence and Electoral Fraud on the predicted probability of Post-Election Violence when all other variables are held at mean values. Our core models (in Models 1 and 3) include country random effects; we show the same models (in Models 2 and 4) with country fixed effects.
Logit Estimates of the Effect of Fraud and Violence on Post-election Protests
+p ≤ 0.1 *p ≤ 0.05 ; **p ≤ 0.01 Standard errors are in brackets. All models are restricted to elections in which the incumbent did not lose the election and leave office.
Effect of fraud and election violence on post-election protest Note: this figure plots the simulated effect (predicted probabilities) of Electoral Fraud and Pre-Election Violence on Post-Election Protest from the estimates in Table 4, Models 1 and 3. All other variables are set at the mean. Vertical lines indicate the 95 per cent confidence interval.
Both electoral fraud and pre-election violence are strong predictors of post-election protest: both variables are associated with sizable increases in the probability of protest across both specifications.Footnote 96 As shown in Figure 6, Electoral Fraud increases the probability of Post-Election Protest by nearly 0.13. Pre-Election Violence increases the probability of Post-Election Protest by over 0.20. The fact that pre-election violence increases the likelihood of post-election protest suggests that the use of pre-election violence can also have unintended consequences for the incumbent after the election.
The existence of post-election protest allows us to evaluate a final implication of our argument: if an incumbent faces post-election protest, is she more likely to use violence against protesters in the post-election period if she lacks significant institutional constraints? Our approach for estimating post-election violence against protesters is represented below for each election i in country j:
 $$Pr(Post{\rm{ \hbox{-} }}Election\ Violenc{{e}_{ij}}\: = \:1)\: = \:f\,({{\beta }_1}\,Executive\ Constraint{{s}_{ij}}\: + \:\varphi {{X}_{ij}}\: + \:{{\gamma }_i}\: + \:{{{\epsilon}}_{ij}},)$$
We measure Post-Election Violence using Nelda31, which indicates, in cases of post-election protest, whether the government used violence against demonstrators. This variable equals 1 if the incumbent used violence against demonstrators and 0 otherwise. As in the above models, control variables include the three-year (lagged) moving average of Physical Integrity, Political Competitiveness and Executive Recruitment, as well as GDP (log), Population (log), Leader Tenure and Leader Age, and Civil War. We also include Pre-Election Violence as an additional control to ensure that we are not picking up the overall likelihood that incumbents will use election violence.Footnote 97 Since violence against protesters is only possible when protests occur, we include in this sample only elections in which post-election protests occurred, regardless of whether or not the incumbent decided to exit power after the election.
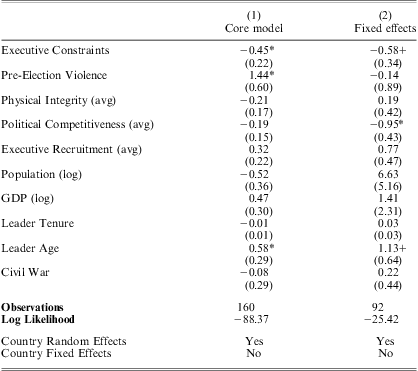
We report logit estimates of this equation in Table 5. Model 1 reports estimates that include random effects, and Model 2 reports estimates including country fixed effects. Our results are consistent across both specifications: the coefficients on Executive Constraints are negative and statistically significant. Figure 7 shows the predicted effects from Model 1 of Table 5. A decrease in Executive Constraints from 7 to 1 increases the average probability of violence to 0.73 from 0.22, suggesting that the incentives to repress protesters are mitigated by the presence of institutionalized constraints.
Logit Estimates of the Effect of Executive Constraints on Post-Election Violence
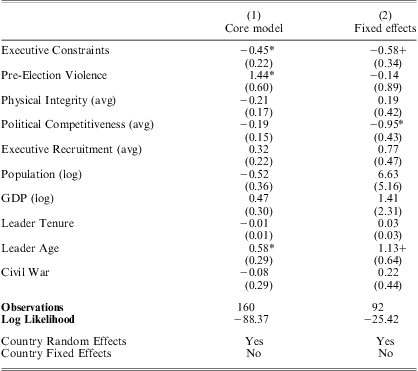
+p ≤ 0.1 *p ≤ 0.05 ; **p ≤ 0.01. Standard errors are in brackets. All models are restricted to elections in which post-election protests occurred.
The effect of executive constraints on post-election violence Note: this figure plots the simulated effect (predicted probabilities) of Executive Constraints on Post-Election Violence from the estimates in Table 5, Model 1. All other variables are set at the mean. Vertical lines indicate the 95 per cent confidence interval.
Conclusion
Using newly available data for all elections held in the world from 1981–2004, this article evaluates the conditions under which governments are most likely to use violence as an election strategy. These new data have several advantages: (1) they measure specific forms of electoral violence directly, rather than assuming election violence is captured by annual measures of political repression; (2) they separate pre- and post-election violence and (3) they measure important variations in the popularity of incumbents and the information available to them about the potential threats induced by the election. In contrast to previous research, we have shown that incumbent leaders are more likely to resort to repression – specifically violence – against political opposition candidates, voters or citizens when they fear losing power but have few institutionalized constraints on their decision-making powers. We have also shown that pre-election violence can have the unintended consequence of increasing the probability of post-election protest, and that once post-election protests are initiated against the incumbent regime, institutionalized constraints on the executive can mitigate incentives for the government to respond with violence. Using new monthly data and examples from Zimbabwe and Iran, we provided illustrations for our core argument that incumbent governments are likely to use election violence when they fear losing power – because they possess some information that they are unpopular – and face few institutionalized constraints.
It is clear that as elections have spread to nearly all countries, some incumbents – including those in countries like Azerbaijan, Cambodia, Iran or Zimbabwe – have used violence to stay in power. In effect, elections exacerbate human rights violations in these places in the short term; without elections, the violations would probably be fewer. However, our results do not speak to whether leaders who use election violence actually succeed in staying in power, or whether periods of electorally induced political violence are inevitable parts of political liberalization.Footnote 98 Many of the world's longest-standing consolidated democracies, including France, the United Kingdom and the United States, have experienced periods of election violence.Footnote 99 This history raises fundamental questions about the long-term relationship between political violence, elections and democratization. Some scholars and pundits may be tempted to interpret the fact that leaders sometimes use political violence to manipulate elections as confirmation that elections are necessarily ‘bad’ for countries without a history of elections and democracy. Yet our analysis does not support this conclusion.
Rather, several important implications follow from the evidence we provide in this article. First, the countries that are most likely to experience election violence are precisely those places in which the incumbent government feels threatened by an organized and potentially powerful opposition. Although all repression is clearly detrimental to democracy in the short term, competition is important for democracy in both the short and long term. If our analysis is correct, then more often than not, election violence may be a symptom of a threatened and potentially weakening incumbent government rather than a sign that democratization – and future protection for human rights – is doomed.
Secondly, and perhaps most importantly, our analysis draws attention to the fact that there are a variety of sources of information about the incumbent's popularity that to our knowledge have never been studied systematically, and that can help predict the likelihood of election violence. Though it may seem self-evident to suggest that incumbents turn to violence when they feel threatened, it is not obvious how to gauge these threats. That is why anticipating actual election violence in the real world has been extremely difficult to do; even the most dedicated organizations that support democratic elections are rarely able to predict when violence will break out. Predicting violence is not just an academic exercise; understanding the conditions under which election violence is most likely to occur – and how it can be mitigated – can inform the strategies of NGOs, international organizations and other interested actors, allowing them to better anticipate where measures aimed at preventing election violence are most likely to be useful.