1. Introduction
In policy discussions about the debt crisis in the Euro area, one key issue has been the deleterious effect of sovereign debt restructuring on bank’s balance sheets and, consequently, on the economy as a whole. The mechanism runs as follows: sovereign debt restructuring leads to lower prices for sovereign debt, and thus implies a reduction in the value of banks’ assets. This in turn forces banks to deleverage, reducing credit in the economy and leading to a sharp fall in economic activity. In consequence, tax revenues fall.Footnote 1 A recent literature has evolved to assess the importance of this sovereign-bank loop – the so called diabolic loop.Footnote 2
However, sovereign default is effectively a transfer from debt holders to the government, not a destruction of wealth. Hence, on the one hand, a default episode tightens the constraints on banks and forces them to deleverage, which leads to lower investment and lower output. But on the other hand, it loosens the government’s budget constraint – since, presumably, servicing debt would require higher taxes or less government spending. Therefore, one of the main factors dictating what then happens to the economy is the fiscal response after default.
This paper studies how different fiscal policy responses affect the sovereign-bank loop in a quantitative macroeconomic model. Banks are leverage-constrained as in Gertler and Kiyotaki (Reference Gertler, Kiyotaki, Friedman and Woodford2010) and Gertler and Karadi (Reference Gertler and Karadi2011) and hold sovereign bonds. Several fiscal policy instruments are considered: government purchases; lump-sum taxes; taxes on labor; taxes on capital income; taxes on banks; and taxes on consumption. The model portrays a closed economy and abstracts from nominal rigidities and monetary policy. Compared to models with an endogenous default decision, ours is simpler, but also easier to quantify and, in this sense, more transparent.
The model is calibrated to capture the sovereign-bank loop in the Greek economy following the 2012 Bond Exchange. We consider a counterfactual steady state with no default and simulate an exogenous debt restructuring episode, modeled as a sharp fall in current debt payments that phases out over time. We study how the reaction of the economy to the debt restructuring shock depends on the fiscal policy response.
Debt restructuring in place of higher lump-sum taxation leads to a very persistent but mild output drop. Even though no other cost of default is considered, the restructuring shock leads to a fall in economic activity owing to its effects on banks’ balance sheets, since banks are forced to deleverage. Moreover, restructuring debt instead of cutting government consumption leads to a larger fall in investment and output. Intuitively, the increase in government consumption following default crowds out investment, aggravating the diabolic loop.
However, when distortionary taxation is considered, results are very different. We first consider a tax on labor income. While debt restructuring forces banks to deleverage, it also avoids an increase in taxes that would lead to a reduction in labor supply. In our laboratory economy, this effect on labor supply is the dominating force and brings a halt to the diabolic sovereign-bank loop.
In the case of consumption taxes, the response of the economy in the short run is very similar to the case of labor taxes, but since lower consumption taxes also crowd out investment, after a few years, output is below its level in case of no default.
When sovereign debt restructuring occurs in place of increases in taxes on capital income or banks’ profits, the effect on investment is positive. Intuitively, default is a one-off transfer from banks to the government, but so are taxes on banks and the latter also affect marginal lending decisions. Owing to these positive effects on bank credit, sovereign debt restructuring is less harmful than an increase in taxes on capital income or on banks. The effect is particularly strong in the medium and long run – the output response peaks only after 5 years.
We then let fiscal policy react to a greater extent to default, so taxes decrease more, but debt recovers faster. This has a positive effect on output in the short run. However, sovereign debt issuance crowds out space for capital investment in banks’ balance sheets, and a more expansionary fiscal policy exacerbates this effect. In consequence, the overall impact on the economy of a more expansionary fiscal stance is negative.
In sum, in our laboratory economy, the type of fiscal instrument and the speed of adjustment interact with the financial disruption caused by debt restructuring. As it turns out, this interaction is very important to determine how the economy responds.
This paper is organized as follows: the next subsection connects our contribution to the literature. Section 2 presents the model, Section 3 briefly describes the Greek Debt Restructuring from 2012, explains how we calibrate the model, and details the simulation exercise. Results are presented in Section 4 and Section 5 concludes.
1.1. Related literature
Empirical work has explored the links between sovereign risk and banks’ financing conditions. Borensztein and Panizza (Reference Borensztein and Panizza2009) show empirical evidence that default episodes tend to magnify the probability of banking crises and domestic credit crunches, associated with balance sheet effects and collapses in confidence. Andritzky (Reference Andritzky2012) points out that the subprime crisis has affected the investor base for government securities in some advanced G20 economies. Following the European debt crisis, Bank of International Settlements (2011) highlighted that the increase in sovereign risk could affect the market value of banks through their holdings of sovereign debt. Gibson et al. (Reference Gibson, Hall and Tavlas2017) show that sovereign ratings, sovereign spreads, and bank ratings strongly interacted with each other during the Euro crisis. Gennaioli et al. (Reference Gennaioli, Martin and Rossi2018) provide evidence that sovereign bonds generate a liquidity benefit for banks in normal times, but are costly during debt crises.
Motivated by this evidence, a growing literature studies the financial disruption triggered by sovereign default and the so-called sovereign-bank (diabolic) loop: when leveraged-constrained banks hold large amounts of domestic sovereign debt, default (or an increase in default risk) leads to less credit, lower output, and tax revenues, generating a feedback loop that further worsens the government’s repayment capacity.
Sosa-Padilla (Reference Sosa-Padilla2018) extends a standard quantitative sovereign default model to endogenize the output costs of default via credit crunch and calibrates the model to match the Argentinian default. Bocola (Reference Bocola2016) models two channels through which this loop can be provoked. In addition to the common liquidity channel, also present in this paper and many others, he shows that news about sovereign risk generate a precautionary motive for banks to deleverage (the “risk channel”). Perez (Reference Perez2015) stresses the relevance of the liquidity value of public debt for banks and studies the effects of post-default bail-outs. Broner et al. (Reference Broner, Erce, Martin and Ventura2014) analyze creditor discrimination in the presence of secondary markets. Their model highlights the crowding-out effect present in this paper: public credit displaces credit for productive investment. Brunnermeier et al. (Reference Brunnermeier, Garicano, Lane, Pagano, Reis, Santos, Thesmar, Van Nieuwerburgh and Vayanos2016) and Brunnermeier et al. (Reference Brunnermeier, Langfield, Pagano, Reis, Van Nieuwerburgh and Vayanos2017) propose a way to break the feedback mechanisms that perpetuate the loop. They argue that changes in sovereign bonds’ prices would be almost completely smoothed out by imposing banks to hold a quasi risk-free asset consisting of a diversified portfolio with senior tranches of government debt.
While much of the literature explicitly models the government’s decision about defaulting or not, we model sovereign debt restructuring as an exogenous policy shock – as Albonico et al. (Reference Albonico, Ascari and Gobbi2020). They study how debt reduction affects output in an OLG framework with no banks, while we focus on the sovereign-bank loop. Our model is able to capture the liquidity effects resulting from default and also generates the crowding-out effect that is key in this literature. Our contribution is to study how the sovereign-bank loop is affected by different fiscal policy instruments and the speed of fiscal policy response.
The nature of losses from sovereign default is a question that dates back to Eaton and Gersovitz (Reference Eaton and Gersovitz1981) and Bulow and Rogoff (Reference Bulow and Rogoff1989). In a survey of this literature, Panizza et al. (Reference Panizza, Sturzenegger and Zettelmeyer2009) argue that there is not much evidence that external penalties are the main reason why governments repay their debts and highlight the importance of domestic costs following defaults. Indeed, a recent literature on debt crises has aimed at exploring the channels through which default can trigger domestic output costs. A branch of this literature has turned its attention to the link between sovereign default and liquidity crises.Footnote 3 Our results, however, raise question marks about the magnitude of these costs. The model also builds on the literature about the role of financial frictions in business cycles and the so called “financial accelerator” channel. Many of the main contributions to this literature introduce financial frictions as an agency problem.Footnote 4 We closely follow the modeling of financial frictions from Gertler and Kiyotaki (Reference Gertler, Kiyotaki, Friedman and Woodford2010) and Gertler and Karadi (Reference Gertler and Karadi2011).Footnote 5 Gertler and Karadi (Reference Gertler and Karadi2011) and Gertler et al. (Reference Gertler, Kiyotaki and Queralto2012) study the recent financial crisis and the effects of unconventional monetary policy using a financial accelerator model where banks face a no-moral-hazard constraint that limits their ability to raise funds. As in other models in this literature, these frictions amplify the effects of exogenous shocks to business cycles.Footnote 6 Building on this framework, Kirchner and Van Wijnbergen (Reference Kirchner and Van Wijnbergen2016) investigate fiscal policy efectiveness during a crisis when private sector and government compete for credit from leverage-constrained banks. They show that fiscal policy is less effective if debt cannot be directly held by households, causing a crowding-out effect in credit provision.
There is also recent research investigating the links between sovereign risk and macroeconomic stability. Corsetti et al. (Reference Corsetti, Kuester, Meier and Mueller2013) and Corsetti et al. (Reference Corsetti, Kuester, Meier and Mueller2014) develop macroeconomic models with financial frictions using Curdia and Woodford’s (2016) framework, but they assume an exogenous connection between sovereign risk and banks’ spreads (loan over deposit rates). Here, this connection is endogenous and crucial for our analysis. Auray et al. (Reference Auray, Eyquem and Ma2018) also study interaction between sovereign risk and banks and focus on the effects on unconventional monetary policies. They consider labor taxes, while we study how different fiscal instruments affect the response to a debt restructuring shock.Footnote 7
2. Model
Our stochastic general equilibrium model is composed of a closed real economy and abstracts from nominal rigidities and monetary policy.Footnote 8 The model considers a government that issues nonstate contingent debt (that can be defaulted on) and a variety of fiscal policy instruments. The modeling of financial frictions follows Gertler and Kiyotaki (Reference Gertler, Kiyotaki, Friedman and Woodford2010) and Gertler and Karadi (Reference Gertler and Karadi2011). The economy is populated by five types of agents: households, good producers, capital producers, bankers, and government.
2.1 Households
There is a representative household with a continuum of members of measure unity, with a fraction
 $1-f$
that are workers and a fraction f that are bankers. Workers supply labor and return wages to the family, while bankers own a financial intermediary and return dividends to their household. Households can save in form of deposits held by intermediaries. They supply funds to banks in the form of noncontingent short-term debt (deposits, denoted
 $D_t$
) that pay a risk-free gross real return rate
 $R_t$
. We additionally assume households cannot buy government bonds directly.
Households choose consumption (
 $C_t$
), labor supply (
 $L_t$
), and riskless debt to maximize expected discounted utility. We assume preferences in logaritmic form that follow a GHH specification (Greenwood et al. (Reference Greenwood, Hercowitz and Huffman1988)) to avoid the wealth effects on labor supply.
Footnote 9
 \begin{equation} E_t \sum_{i=0}^{\infty} \beta^{i} \log \left[ C_{t+i} -\frac{\psi}{1+\varphi} L_{t+i}^{1+\varphi} \right].\end{equation}
Households are subject to the following budget constraint:
 \begin{equation} (1+\tau^{c}_{t}) C_t + \left( D_{t+1} - D_t \right) = (1-\tau^{w}_{t}) W_t L_t + (R_t -1 ) (1-\tau^{d}_{t}) D_t + \Pi_t - TR_t.\end{equation}
where
 $W_t$
is the wage rate,
 $TR_t$
are lump-sum tranfers payed (received) to the government, and
 $\Pi_t$
are the dividends obtained from the ownership of nonfinancial firms and banks. Tax rates are also indexed to t. Taxation is composed by consumption taxes (
 $\tau_{t}^{c}$
) and income taxes of two forms: taxes on wages (
 $\tau_{t}^{w}$
) and taxes on (net) returns of savings (
 $\tau_{t}^{d}$
).
From the first-order conditions for consumption/saving, we get:
 \begin{equation} E_t \beta \Lambda_{t,t+1} \left[ (1 - \tau^{d}_{t+1} ) (R_{t+1}-1) + 1 \right] = 1,\end{equation}
where
 $\Lambda_{t,t+1}$
is the households’ stochastic discount factor:
 \begin{equation*}\Lambda_{t,t+1} \equiv \frac{\varrho_{t+1}}{\varrho_t} \frac{(1+\tau^{c}_{t})}{\left(1+\tau^{c}_{t+1}\right)},\end{equation*}
and
 $\varrho_t$
is marginal utility of consumption,
 \begin{equation*}\varrho_t \equiv \left( C_t - \frac{\psi}{1+\varphi} L_{t}^{1+\varphi} \right)^{-1}.\end{equation*}
The first-order condition for labor supply writes:
 \begin{equation} \psi L_{t}^{\varphi} = \frac{(1-\tau^{w}_{t}) W_t}{(1+\tau^{c}_{t})}.\end{equation}
In every period, there is a probability
 $(1-\theta)$
that a banker becomes a worker. In order to maintain the fraction in each occupation constant over time, in each period there is a random fraction
 $(1-\theta)f$
of workers that become bankers. Workers who become bankers receive a “start up” capital from the household to start business. Expected survival time of a bank is thus
 $1/(1-\theta)$
. This prevents bankers from accumulating enough wealth so as to overcome their financial constraints.
Households also own nonfinancial firms (capital and goods producers). However, they are not able to acquire capital directly or to provide funds to these firms. All financial intermediation for production must be made by a bank.
2.2 Goods producers
The representative firm in this sector produces output in a competitive market, using labor and capital in a Cobb–Douglas technology:
 \begin{equation} Y_t = K_t^{\alpha} L_{t}^{1-\alpha},\end{equation}
with
 $0 < \alpha < 1$
.
As usual, labor demand implies that the real wage rate equals the marginal product of labor:
 \begin{equation} W_t = (1-\alpha) \frac{Y_t}{L_t}.\end{equation}
In order to produce in period
 $t+1$
, firms need to buy the amount of capital
 $K_{t+1}$
at the end of period t from capital producers. In order to finance the acquisition of capital, firms issue securities
 $S_t$
and an arbitrage condition ensures the value of these securities equals the value of the capital to be bought. The intermediaries buy these securities. Denoting by
 $Q_t$
the price of one unit of capital, we have:
 \begin{equation*}Q_t K_{t+1} = Q_t S_t.\end{equation*}
There are no frictions in this process. Intermediaries have perfect information about the firm and about future payoffs, so securities are state-contingent. Frictions exist within the process of banks obtaining resources from households.
In order to satisfy the zero profit condition in the competitive market, goods producers buy capital goods up to the point that gross profits per unit of capital
 $Z_t$
equal the marginal product of this input:
 \begin{equation*}Z_{t} = \frac{Y_t - W_t L_t}{K_{t}} = \alpha \frac{Y_t}{K_t}.\end{equation*}
A firm that sells
 $S_t$
securities to acquire capital must return all its profits in the next period to the bank. Call
 $R_{kt}$
the gross return to capital in time t, the amount a bank obtains as a return over each unit of credit supplied in the form of acquired securities. The representative goods producer owes a bank an amount
 $Q_t S_t R_{kt+1}$
at the end of the period. This value equals the sum of profits
 $\Pi_{ft}$
obtained through capital utilization in production (gross of capital remuneration) and the market value of the effective non-depreciated capital, that could be sold back in the market after production has taken place.
 \begin{equation*}Q_t S_t R_{kt+1} = \Pi_{ft+1} + (1-\delta) Q_{t+1} K_{t+1}.\end{equation*}
Substituting for
 $\Pi_{ft}$
and
 $S_t$
and dividing both sides by
 $K_{t+1}$
:
 \begin{equation*}Q_t R_{kt+1} = \alpha \frac{Y_{t+1}}{K_{t+1}} + (1-\delta) Q_{t+1}.\end{equation*}
Hence, the gross return to capital in period
 $t+1$
is given by the ratio between the value generated by one unit of capital acquired by the firm in period t over the price at which it was bought.
 \begin{equation} R_{kt+1} = \frac{Z_{t+1} + (1-\delta) Q_{t+1} }{Q_{t}}.\end{equation}
2.3 Capital producers
The market for capital is competitive. At the end of each period, capital producers build new capital for the following period using the final output as an input in the production. Capital goods are then sold back to goods producers at price
 $Q_t$
. They are subject to convex adjustment costs in this process.
Footnote 10
A capital producer chooses investment
 $I_{t}$
to maximize discounted profits, taking the price of capital
 $Q_t$
as given.
Adjustment costs are a convex function of investment. The capital producers’ problem is given by
 \begin{equation*}max \quad E_t \sum_{\tau=t}^{\infty} \beta^{\tau - t} \Lambda_{t,\tau} \left[ Q_{\tau} I_{\tau} - \left[ 1 + f \left( \frac{I_{\tau}}{I_{\tau-1}} \right) \right] I_{\tau} \right],\end{equation*}
with
 $f(1) = f'(1) = 0$
and
 $f''(1) > 0$
. Nonzero profits are possible when the economy is not in steady state, and profits are transfered to the household.
The first-order condition for investment is given by
 \begin{equation}Q_t = 1 + f \left( \frac{I_{t}}{I_{t-1}} \right) + \frac{I_{t}}{I_{t-1}} f' \left( \frac{I_{t}}{I_{t-1}} \right) - E_t \beta \Lambda_{t,t+1} \left( \frac{I_{t+1}}{I_{t}} \right) ^{2} f' \left( \frac{I_{t+1}}{I_{t}} \right).\end{equation}
This condition states that capital price will equal the marginal cost of investment.
The adjustment cost function assumes the form:
 \begin{equation*}f(.) = \frac{\eta_i}{2} \left( \frac{I_{t}}{I_{t-1}} -1 \right) ^{2},\end{equation*}
where
 $\eta_i$
refers to the inverse elasticity of investment with respect to the price of capital.
2.4 Government
Government spending is given by
 $G_t$
. To finance itself, government taxes households, banks, and issues debt, which for simplicity is bought only by banks.
The government issues debt with the following maturity structure: every period a fraction
 $\mu$
of the outstanding debt stock comes due and
 $1 - \mu$
goes on to add to the next period’s debt pile. This is equivalent to assuming the government always issues debt with varying maturities, being
 $1-\mu$
the ratio between the amount of debt coming due in
 $t+1$
and the amount coming due in t.
The objective of the paper is to study fiscal policy in the aftermath of a sovereign default. To capture the debt restructuring in an easily tractable way, we assume the default is caused by an exogenous policy shock. We introduce this possibility in the model by assuming that repayment is given by a random variable
 $m_t \in [0,1]$
. The variable
 $m_t$
represents the actual fraction of debt coming due at t that is repaid, and it is given by
 \begin{equation} m_t = \min \{ \iota_{t}, 1 \},\end{equation}
where
 \begin{equation} \iota_t = \rho_{\iota} \iota_{t-1} + (1 - \rho_{\iota}) + \varepsilon_{\iota t},\end{equation}
where
 $\rho_{\iota}$
is a positive constant and
 $\epsilon_{\iota t}$
is a normally distributed error term with mean 0 and standard deviation
 $\sigma_{\iota}$
. In steady state,
 $\iota_t = 1$
, meaning that the government fully repays the amount of debt that comes due in t. However, the fraction to be repaid is subject to shocks.
A debt restructuring episode triggered by a policy decision is captured by a one-off negative shock on
 $\iota$
. The auto-regressive specification captures the fact that in case of debt restructuring, sovereigns tend to repudiate short-term debt and lengthen the debt repayment profile. So repayment drops in the first periods following a default episode but grow in time, tending again to a hundred percent of the maturing fraction as the shock vanishes completely.
Footnote 11
The following section shows that in fact such a pattern was present in the Greek Bond Exchange from 2012.
In each period, the government repays
 $\mu m_t$
of the debt. Denoting
 $\chi_t$
the price of debt, the government’s financing requirement for period
 $t+1$
,
 $\chi_t A_{t+1}$
, is the difference between the fraction of debt repaid (
 $\mu B_t$
times the fraction effectively honoured
 $m_t$
) and the amount of government spending that is not covered by taxes (primary deficit):
 \begin{equation} \chi_t A_{t+1} = \mu m_t B_t + G_t - T_t.\end{equation}
Total outstanding (nominal) debt in
 $t+1$
is given by
 \begin{equation} B_{t+1} = (1-\mu) B_t + A_{t+1}.\end{equation}
Total taxes are given by the sum of all sources of taxation: lump-sum transfers, consumption taxes, income taxes (wage income and capital taxes), and taxes on banks’ profits (to be presented in the next subsection).
 \begin{equation} T_t = TR_{t} + \tau_{t}^{c} C_t + \tau_{t}^{w}W_t L_t + \tau_{t}^{d} (R_t - 1) D_t + \tau_{t}^{b} {\pi}_{t}.\end{equation}
We now turn to the fiscal rules assumed to close the model. The government has a set of tax rates to manipulate and can also increase exogenous expenditures, with the objective of not letting real value of debt deviate largely from steady state. The speed of this adjustment is given by the parameter
 $\rho_b$
and is related to the convergence of debt to the steady state level. Tax rates also have an autoregressive component,
 $\rho_x$
, as in the following equation:
 \begin{equation} X_t = (1-\rho_x) \bar{X} + \rho_x X_{t-1} + \rho_b \left( \chi_t B_t - \bar{\chi} \bar{B} \right),\end{equation}
with
 \begin{equation*} X_t = \left\{ \tau_{t}^{w}, \tau_{t}^{c}, \tau_{t}^{d}, \tau_{t}^{b}, TR_{t}, G_t \right\}. \end{equation*}
The rule implies that the government raises taxes when its debt rises (see, e.g., Bi (Reference Bi2012) for a discussion). The autoregressive parameter ensures that tax rates move slowly, in accordance to the data.
To complete this subsection, gross return on bonds is the ratio between the expected value to be payed back by the government in the next period plus the expected value of the remaining outstanding debt divided by the current price of debt:
 \begin{equation} R_{bt+1} = \frac{\mu E_t m_{t+1} + (1-\mu) E_t \chi_{t+1}}{\chi_{t}}.\end{equation}
A shock to
 $m_t$
affects not only the haircut in t but also the expected repayment in the following periods, which induces changes in bonds’ prices, directly influencing banks’ balance sheets and investment decisions. Steady-state price of government debt
 $\chi_t$
is
 \begin{equation} \bar{\chi} = \frac{\mu}{\bar{R_b} - (1-\mu)}.\end{equation}
In the limiting case where
 $\mu=1$
, price of debt is as standard the inverse of the bond yield.
2.5 Banks
Following Gertler and Karadi (Reference Gertler and Karadi2011), banks can raise funds from households in form of deposits or from retained earnings, accumulating net worth. They use the available funds to buy state-contingent securities from goods producers, but also to buy government bonds
 $B_{t+1}$
at price
 $\chi_t$
. In each period, banks pay a tax
 $\tau_{t}^{b}$
on their profits.
Banks are the only agents that buy sovereign debt in this economy. In reality, sovereign default also transfers resources from firms and households to the government and also entails a variety of costs. Since the focus of the paper is the sovereign-bank loop, we do not consider any other default cost. But then, we do not include the default on firms and households either. Accordingly, our calibration strategy will consider debt held by banks only.
A bank’s balance sheet is composed by the assets it holds (government bonds and private securities), liabilities (deposits), and net worth:
 \begin{equation} \chi_t B_{t+1} + Q_t K_{t+1} = N_t + D_{t+1}.\end{equation}
 $D_t$
are deposits raised from households and we used
 $S_t = K_{t+1}$
.
We make use of the notation
 $N_t$
to denote post-tax net worth:
 \begin{equation*}N_{t} = N_{t-1} + \pi_{t} (1-\tau_{t}^{b}), \end{equation*}
with
 \begin{equation*} \pi_{t} = r^{k}_{t} Q_{t-1} K_{t} + r^{b}_{t} \chi_{t-1} B_{t} - r_{t} D_{t}. \end{equation*}
Net worth in
 $t+1$
is the gross payoff from assets funded at t net of returns to depositors. Profits are given by subtracting the flow of compensation to depositors from earnings on assets. Let
 $R_{kt+1}$
denote the gross rate of return on a unit of a bank’s private securities from t to
 $t+1$
. Net worth before taxes is then given by
 \begin{equation} \tilde{N}_{t+1} = R_{kt+1} Q_{t} K_{t+1} + R_{bt+1} \chi_{t} B_{t+1} - R_{t+1} D_{t+1},\end{equation}
with
 \begin{equation*}R_{kt+1} = (1+r^{k}_{t+1}) = \frac{Z_{t+1} + (1-\delta) Q_{t+1}}{Q_{t}}.\end{equation*}
The objective of a banker is to maximize its future terminal value, given by the discounted value of (net) net worth, accounting for the probabilities that she might exit at each future period:
 \begin{equation} V_t = E_t \left[ \sum_{i=1}^{\infty} \left( 1-\theta \right) \theta^{i-1} \beta^{i} \Lambda_{t,t+i} N_{t+i} \right].\end{equation}
The bank’s ability to obtain funds is limited by a moral hazard constraint as in Gertler and Karadi (Reference Gertler and Karadi2011). At each period, a banker may choose to divert a fraction
 $\lambda$
of assets in the form of dividends to her family and hence defaults on part of debt. In this case, the remaining fraction
 $1-\lambda$
of her assests will be recovered by other depositors, leading the bank to bankruptcy. This fraction
 $\lambda$
is exogenous and constant. This constraint could also be interpreted as a leverage constraint imposed by official regulation, along the lines of the Basel Agreements. In equilibrium, leverage is pinned down by this constraint.
Anticipating the possibility of funds diversion, depositors will limit their lendings to ensure banks won’t divert funds. The bank’s value must be at least as large as its gain from deviating funds, so as to discourage diversion.
 \begin{equation} V_t \geq \lambda (\chi_t B_{t+1} + Q_t K_{t+1}).\end{equation}
The expressions in (17) and (18) yield the evolution of the bank’s net worth as a function of the state variables
 $K_{t}$
,
 $B_{t}$
, and
 $N_{t-1}$
:
 \begin{equation} N_t = N_{t-1} + \left[ (r^{k}_{t} - r_t) Q_{t-1} K_{t} + (r^{b}_{t} - r_t) \chi_{t-1} B_{t} + r_t N_{t-1} \right] (1-\tau_{t}^{b}).\end{equation}
Let
 $V_t(K_{t+1}, B_{t+1}, N_t)$
be the maximized value of the bank’s objective. It will satisfy the following Bellman equation.
 \begin{equation} V_t (K_{t+1}, B_{t+1}, N_t) = E_t \beta \Lambda_{t,t+1} \{ (1-\theta) N_{t+1} + \theta \max \left[ V_{t+1} (K_{t+2}, B_{t+2}, N_{t+1}) \right] \}.\end{equation}
In each period, the banker chooses a portfolio composition of capital and bonds,
 $K_{t+1}$
and
 $B_{t+1}$
, to maximize her value function subject to the incentive constraint and the law of motion for net worth, taking into account that she might exit with probability
 $(1-\theta)$
.
We conjecture the value function to be linear in the balance sheets’ components:
 \begin{equation} V_t(K_{t+1}, B_{t+1}, N_t) = \nu_{t} Q_t K_{t+1} + \zeta_{t} \chi_t B_{t+1} + \eta_t {N}_t.\end{equation}
In the Appendix, we show that this conjecture is true, as long as
 \begin{equation} \eta_t = E_t \beta \Lambda_{t,t+1} \tilde{\Omega}_{t+1} \left[ 1 + r_{t+1}(1-\tau^{b}_{t+1}) \right],\end{equation}
 \begin{equation} \nu_{t} = E_t \beta \Lambda_{t,t+1} \Omega_{t+1} \left(R_{kt+1} - R_{t+1} \right),\end{equation}
 \begin{equation} \zeta_{t} = E_t \beta \Lambda_{t,t+1} \Omega_{t+1} \left(R_{bt+1} - R_{t+1} \right),\end{equation}
with
 \begin{equation} \Omega_t = (1-\tau_{t}^{b}) \tilde{\Omega}_t,\end{equation}
and
 \begin{equation} \tilde{\Omega}_{t+1} = 1-\theta + \theta \left[\phi_{t+1} \zeta_{t+1} + \varpi_{t+1}(\nu_{t+1} - \zeta_{t+1})+ \eta_{t+1} \right].\end{equation}
The auxiliary variable
 $\varpi_t$
is the leverage only in terms of capital:
 \begin{equation} \varpi_t \equiv \frac{Q_t K_{t+1}}{N_t}.\end{equation}
Each component of the banks’ value function can be interpreted as follows:
 $\eta_t$
is saving in deposits’ costs from an additional unit of net worth. The variables
 $\nu_t$
and
 $\zeta_t$
are the marginal discounted gains of expanding, respectively, private securities’ holdings and government bonds’ holdings. Finally,
 $\tilde{\Omega}_t$
is the shadow marginal value of net worth and affects the banks’ intertemporal discount factor.
Optimization for banks will imply the following no-arbitrage condition:
 \begin{equation} E_t \beta \Lambda_{t,t+1} \Omega_{t+1} \left(R_{kt+1} - R_{t+1} \right) = E_t \beta \Lambda_{t,t+1} \Omega_{t+1} \left(R_{bt+1} - R_{t+1} \right).\end{equation}
Define
 $\phi_t$
as the leverage ratio, the maximum ratio of bank assets over equity:
 \begin{equation*}\phi_t \equiv \frac{Q_t K_{t+1} + \chi_t B_{t+1}}{N_t}.\end{equation*}
The constraint in (20) can be rewritten as
 \begin{equation*}\nu_{t} Q_t K_{t+1} + \zeta_{t} \chi_t B_{t+1} + \eta_t N_t \geq \lambda (\chi_t B_{t+1} + Q_t K_{t+1}).\end{equation*}
If this constraint binds, we get
 \begin{equation*}\phi_t = \frac{\eta_t + \varpi_t (\nu_t - \zeta_t)}{\lambda - \zeta_{t}}.\end{equation*}
Which, using (30), simplifies to
 \begin{equation} \phi_t = \frac{\eta_t}{\lambda - \zeta_{t}}.\end{equation}
2.6 Evolution of bank’s net worth
The total net worth in the banking sector equals the sum of existing banks’ net worth
 $N_{e,t}$
and entering banks’ start-up capital
 $N_{n,t}$
provided by their families. The net worth of existing banks equals the net earnings from assets over liabilities from one period to another, that is, earnings from holding securities plus earnings from holding government bonds minus costs from deposits, net of taxes. This expression must be multiplied by the fraction
 $\theta$
of banks that survive between periods:
 \begin{equation} N_{e,t} = \theta N_{t-1} + \theta N_{t-1} (1-\tau_{t}^{b}) \left[ (R_{kt}-R_{bt}) \varpi_{t-1} + (R_{bt}-R_{t}) \phi_{t-1} + (R_t-1) \right].\end{equation}
Families transfer to each new banker a constant fraction
 $\omega/\left( 1 - \theta \right) $
of total assets from exiting bankers, given by
 $(1-\theta) [ Q_{t} K_{t} + \chi_{t} B_{t}]$
, also after taxes. Hence, entering bankers’ net worth will be
 \begin{equation} N_{n,t} = \omega (1-\tau_{t}^{b}) (Q_t K_{t} + \chi_t B_{t}).\end{equation}
Total net worth from banks in the economy is thus
 \begin{equation*}N_t = N_{e,t} + N_{n,t}.\end{equation*}
2.7 Market Clearing
Output can be used for consumption, government spending, or investment (including adjustment costs). Aggregate demand is given by
 \begin{equation} Y_t = C_t + I_t \left[ 1 + f \left( \frac{I_t}{I_{t-1}} \right) \right] + G_t.\end{equation}
Market clearing in the goods market requires the expression for demand in (34) to equal supply, given by (5).
The banks’ balance sheet can be written as
 \begin{equation*}Q_t K_{t+1} + \chi_t B_{t+1} = \phi_t N_t.\end{equation*}
Demand for securities and bonds is given by the balance sheet constraint, given by (31). The supply of securities by firms is given by the expression for capital accumulation:
 \begin{equation*}K_{t+1} = (1-\delta) K_t + I_t.\end{equation*}
Finally, market clearing for deposits is obtained from balance sheet identity. Total deposits supplied by families must equal the difference between banks’ assets and net worth.
 \begin{equation*}D_t = Q_t K_{t+1} + \chi_t B_{t+1} - N_t.\end{equation*}
3. Calibration
In order to study how fiscal policy in the aftermath of debt restructuring affects the sovereign-bank loop, we simulate a debt restructuring episode and run a series of counterfactual exercises, with different fiscal policy responses. The model economy is calibrated to capture the sovereign-bank loop in the Greek economy on the verge of the 2012 debt restructuring episode. We thus begin this section by briefly describing this case.
3.1 The greek debt restructuring
The 2012 Bond Exchange in Greece was the outcome of a public budget deterioration that became evident with the countercyclical policies following the 2007–2008 Great Recession and revealed itself much worse once previous unreliable fiscal data was revised. This led to a deep confidence crisis and a sharp increase in spreads for Greek debt. A first proposal for a bond exchange in 2011 (one year after a rescue package had been agreed upon with the IMF and the EU) and the following fiscal consolidation effort by the Greek government were shown to be insufficient, since the deep recession and the postponement of structural reforms precluded a deeper adjustment. After further negotiations a huge bond exchange program was agreed upon for March 2012, with major private sector involvement, a feature already present in the 2011 proposal. Footnote 12
The Greek Restructuring consisted of a lengthening of the average maturity and large debt relief. Restructuring implied an average residual maturity increase for Greek securities from 7 years in 2011 to more than 12 years in 2012, although at the aggregate level the repayment profile for bonds shifted into the future was largely compensated by short term repayment of EFSF (European Financial Stability Facility) notes (official loans). Footnote 13
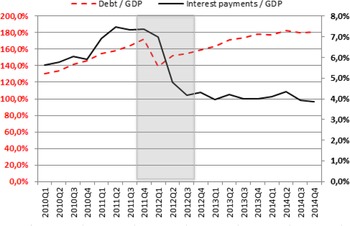
Figure 1 plots the evolution of debt in aggregated terms and interest payments, both as fractions of GDP. One can observe a drop in general government consolidated debt as a share of GDP from 2011 to 2012 which, in terms of debt relief, resulted in a face value reduction of around 52
 $\%$
, or a reduction of 12 percentage points in Debt/GDP ratio. Notwithstanding this immediate relief, debt-to-GDP ratios started to recover fast, returning to pre-default levels after a few years. The evolution of interest payments in terms of GDP is also interesting: it drops by almost half from 2011Q4 to 2012Q1, after the bond exchange was conducted. Average haircut was 65
 $\%$
, with higher losses for short- term investors.
Greece: Debt-to-GDP.

3.2 The counterfactual scenario
The paper aims at evaluating how fiscal policy affects the sovereign-bank negative loop. For this reason, in our quantitative analysis, we (i) compare a situation with debt restructuring with a counterfactual scenario with normal debt servicing and (ii) we focus only on default on bonds held by banks.
The Greek Debt Restructuring was accompanied by some degree of fiscal contraction: total taxes were raised and expenditures were cut. Nevertheless, had the restructuring not happened, the fiscal effort required for servicing debt would have been larger than observed.
In our laboratory economy, we consider a counterfactual steady state that aims at capturing a scenario with no Bond Exchange in Greece in 2012. Since the absence of default would have substantially increased debt servicing costs, the debt and tax levels in this counterfactual steady state are higher than their actual values observed in Greece before default. We then simulate a shock that resembles the Greek Bond Exchange from 2012.
The debt restructuring is thus accompanied by expansionary fiscal policy. Importantly, that is relative not to reality in 2012, but to the counterfactual steady state with higher debt and taxes. The fiscal room open right after the restructuring shock is exactly the difference between the counterfactual and the actual debt servicing levels.
In the following periods, fiscal policy will react to deviations of debt from steady state such that in the medium run debt returns to pre-default levels. After a sizeable relief on impact, debt recovers and returns to pre-default levels after some years. This assumption is in agreement with empirical evidence suggesting that debt-to-GDP ratios tend to return, on average, to pre-default levels some years after restructuring. Footnote 14 The quantitative analysis captures the idea that default opens some fiscal space in the short run, but the long run debt burden does not seem to be significantly reduced.
Second, we calculate the hypothetical increase in taxes that would have been necessary in the absence of debt restructuring considering only bonds held by banks. Sovereign default also creates some fiscal room by subtracting resources from firms, households, and foreign agents; the fiscal policy response affects how the economy reacts. However, our focus here is the sovereign-bank loop, so we abstract from default on firms and households and all resulting transfers from the government. Footnote 15
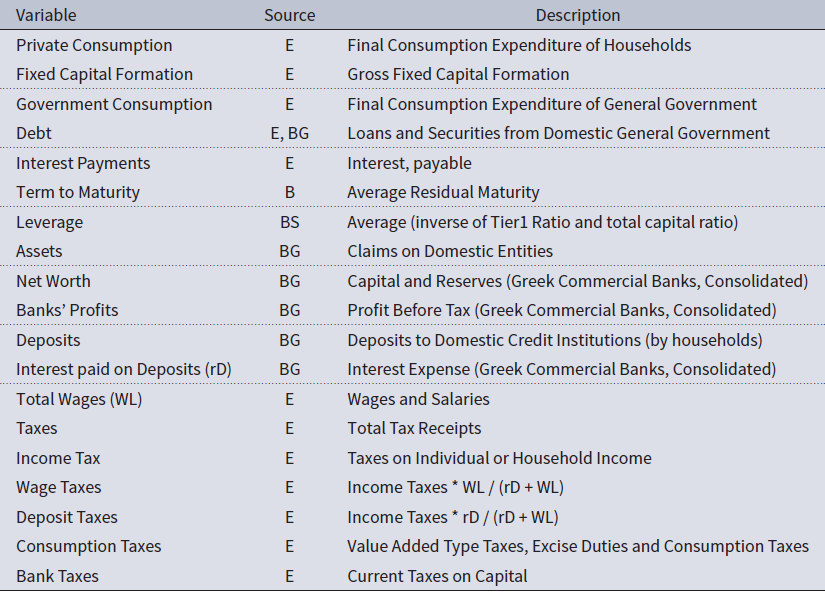
Denoting debt as the sum of securities and loans to the domestic government and assets as the sum of all domestic assets (to roughly reflect our closed economy), we get that financial institutions held
 $59.1$
billion Euros of government debt in 2011, out of a total amount of
 $356.3$
billion Euros. Hence, banks owned around
 $16.6\%$
of sovereign bonds issued by the Greek government (a figure similar to the one in Gennaioli et al. (Reference Gennaioli, Martin and Rossi2018)). Our quantitative analysis focuses on this
 $16.6\%$
share.
We then need to calculate the additional debt service in the absence of default. It comes from two sources: from the haircut itself, that is, from the face value reduction of debt; and from the decrease in interest payments over debt.
We estimate the hypothetical debt in the absence of default in 2012 as the debt observed at the end of 2011 times the average year-over-year debt growth between 2008 and 2011. This leads to
 $393.4$
billion Euros of debt. Subtracting the observed level of debt in 2012 (
 $305.1$
billion Euros) from its counterfactual level yields a haircut of
 $88.3$
billion Euros. The average interest rate from 2007 to 2011 is
 $4.2\%$
. Multiplying it by the
 $88.3$
billion Euros, we get that the haircut itself reduced debt service in 2012 by
 $3.71$
billion Euros.
Second, the average interest rate paid in 2012 by Greece was roughly
 $3.2\%$
(
 $9.7$
billion Euros in debt service devided by
 $305.1$
billion Euros of outstanding debt). The amount saved owing to the decrease in interest payments over debt was thus
 $(4.2\%-3.2\%) \times 305.1 = 3.05$
billion Euros in 2012. Hence, the estimated additional debt service in the absence of default is
 $3.71 + 3.05 = 6.76$
billion Euros.
Recall we focus only on the share of debt held by banks. Multiplying the
 $16.6\%$
share by
 $6.76$
billion Euros yields our final estimation: owing to debt restructuring, the amount paid by the Greek government to banks was
 $1.125$
billion Euros less than it would have been otherwise in 2012. This is the increase in taxes (or reduction in government spending) that would have been necessary in the absence of debt restructuring, as compared to their observed levels on 2012.
3.3 Calibration
Sovereign debt restructuring affects an economy in a variety of ways. Our model and calibration aim at capturing the sovereign-bank channel only. Hence, default on debt in the hands of households or foreign agents is not considered in our simulations. Our calibration matches key features of the Greek economy surrounding the March 2012’s Bond Exchange. The model’s steady state portrays Counterfactual Greece in 2012 and the default shock captures the main characteristics of the observed debt restructuring.
3.3.1 Fiscal variables
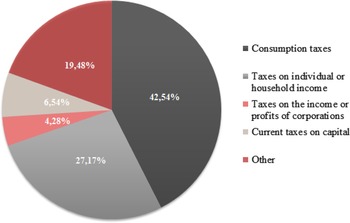
Figure 2 presents revenues per type of tax as a share of total taxes in 2012, calculated using data from Eurostat on tax items and aggregating by categories. The model is calibrated to match this tax composition. ‘Other’ taxes are bundled as lump-sum taxes.
Share of total tax collection. Source: Authors’ calculations using data from Eurostat

The estimated
 $1.125$
billion Euros not paid by the government to banks owing to debt restructuring implies that total tax revenues in case of default were 2.4
 $\%$
lower than in Counterfactual Greece (considering bank’s debt only). We target this amount of tax reduction when default hits the economy.
In all our simulations, one tax rate is cut at a time, and the rule parameter is calibrated to achieve the desired size of decrease on impact for each tax. This allows us to compare the response of the economy when different fiscal instruments are chosen, which is our aim.
The parameter
 $\rho_b$
in (14) is calibrated to target desired response of taxes after the shock (it assumes negative values in case of government expenditures) that match both the initial desired drop in taxes and the time until debt converges again to steady state in line with the already mentioned empirical evidence on default. Across the exercises, we compare scenarios for which the government uses one tax instrument at a time, leaving the other tax rates fixed at steady state values. The autoregressive component of the tax rule,
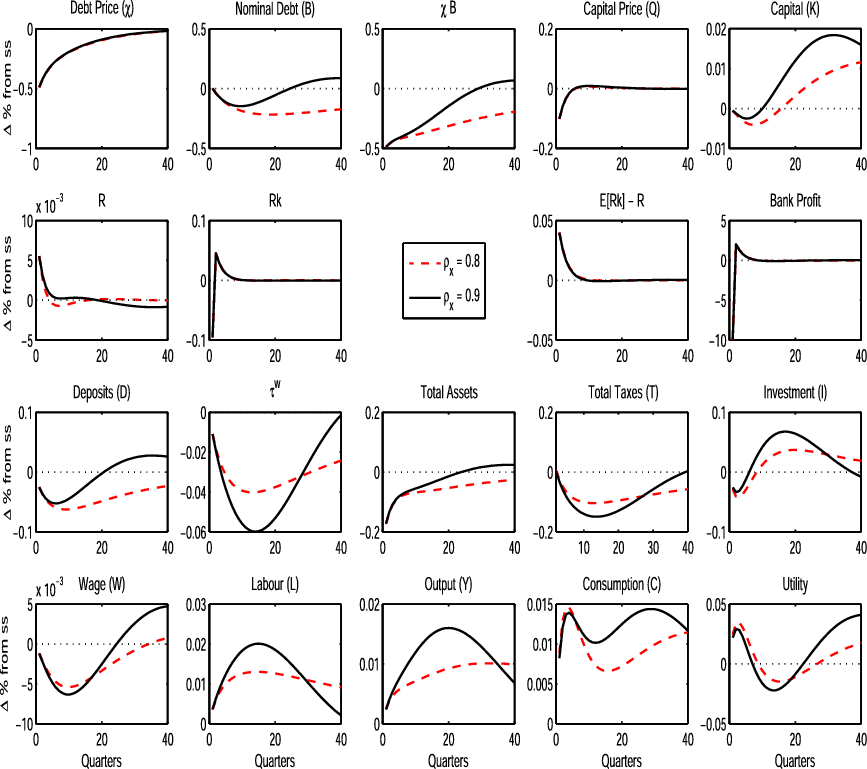
 $\rho_x$
, is set to 0.9 and is also subject to variations in sensitivity analyses.
3.3.2 Parameters and steady state
In order to match the main characteristics of the Greek macroeconomy in 2012, government consumption is set to 21.3
 $\%$
of GDP, gross capital formation is 12
 $\%$
of GDP, and consumption comprises the remaining fraction (66.7
 $\%$
), given that we consider a closed economy. These values are almost exactly the ratios found in data for Greece in 2012 (Eurostat), with deviations corresponding to net exports, that are not accounted for in the model.
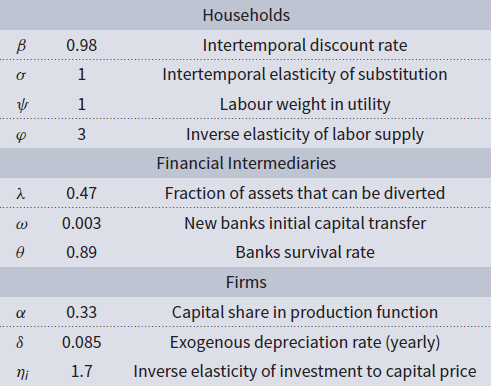
For the “real” sector, we set desired risk premium that, together with depreciation rate and capital share in output, determine the capital/labor ratio for the economy. In order to match those ratios we set depreciation rate (
 $\delta$
) to 8.5
 $\%$
per year, capital share in production (
 $\alpha$
) to 0.33 and the intertemporal discount rate (
 $\beta$
) to 0.98. The steady-state spread of capital return over the risk-free rate,
 $R_k - R$
, that in the model also represents spread from bond return over risk free
 $R_b - R$
, is set to 5.8
 $\%$
per year. This value is close to the annualized spread of 10-year Greek bonds over German bonds observed in 2010.
Footnote 16
Inverse elasticity of investment to capital price,
 $\eta_i$
, follows the conventional value from papers that add adjustment costs to investment, such as Gertler and Karadi (Reference Gertler and Karadi2011).
Parameters of the GHH preferences follow conventional calibration in the literature. Labor disutility equals 1 and the Frisch inverse elasticity of labor supply,
 $\varphi$
, is set to 3, implying a labor supply elasticity equal to 1/3. In case of labor income taxes, these values imply that the Laffer curve peaks when the labor tax rate is around 75%.
Footnote 17
Table 1 summarizes the parameters in our calibration.
Parameters

The other set of aggregates regards debt and banks (the “financial side”). We target three key ratios: debt as a fraction of total assets, the leverage ratio, and the amount collected in taxes on banks as a proportion of total taxes. Footnote 18
As mentioned before, we focus on the share of Greek bonds owned by banks (
 $16.6\%$
). Hence, our counterfactual debt-GDP ratio is
 $33.5\%$
(and not around 200% as it would have been if we had considered the total amount of debt). Using consolidated data from the Bank of Greece on Balance Sheet of Credit Institutions, we arrive at a value of
 $16.2\%$
for bank debt/assets (in line with evidence presented by Gennaioli et al. (Reference Gennaioli, Martin and Rossi2018)).
Leverage ratio is set to 6.5, in line with Bankscope data on Greek banks, most of them important creditors of their own government.
Footnote 19
Last, the amount collected in bank taxes is
 $1.8\%$
of total taxes.
We then choose
 $\mu$
accordingly to reach a debt’s term to maturity equal to 7.4 years, the value observed in data before the restructuring. As already mentioned, we only focus on the specific channel of default through balance sheets of banks. Besides, we do not account for important movements in debt’s composition after default that, as shown in the previous section, moved toward higher participation of official lenders’ loans in expense of privately held securities, the share of total debt directly affected by the bond exchange.
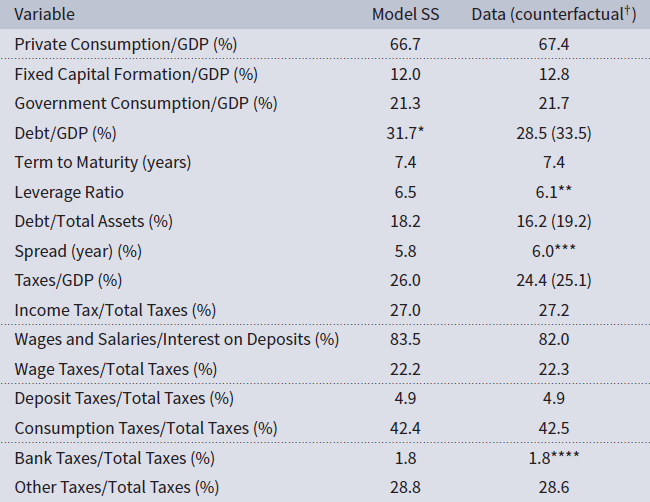
Concerning the fiscal block of the model, steady-state government consumption and debt service imply taxes are 26% of GDP, a value slightly higher than the counterfactual one presented in the previous section. Table 2 shows model steady-state aggregates and ratios and comparison to counterfactual Greece. Details on the time series used and assumptions are in appendix.
Model steady states and comparison to data*

*Data sources and details in appendix.
†Values in parentheses refer to the counterfactuals calculated from data.
*Debt/GDP in the model:
 $\chi B / 4 Y$
. **Average 2010–2012. ***2010. ****Average 2001–2008.
3.3.3 The debt restructuring exercise
The bond exchange in Greece had two important features: a substantial lengthening of the repayment profile and a considerably high average haircut, leading to a present value debt relief of almost 50
 $\%$
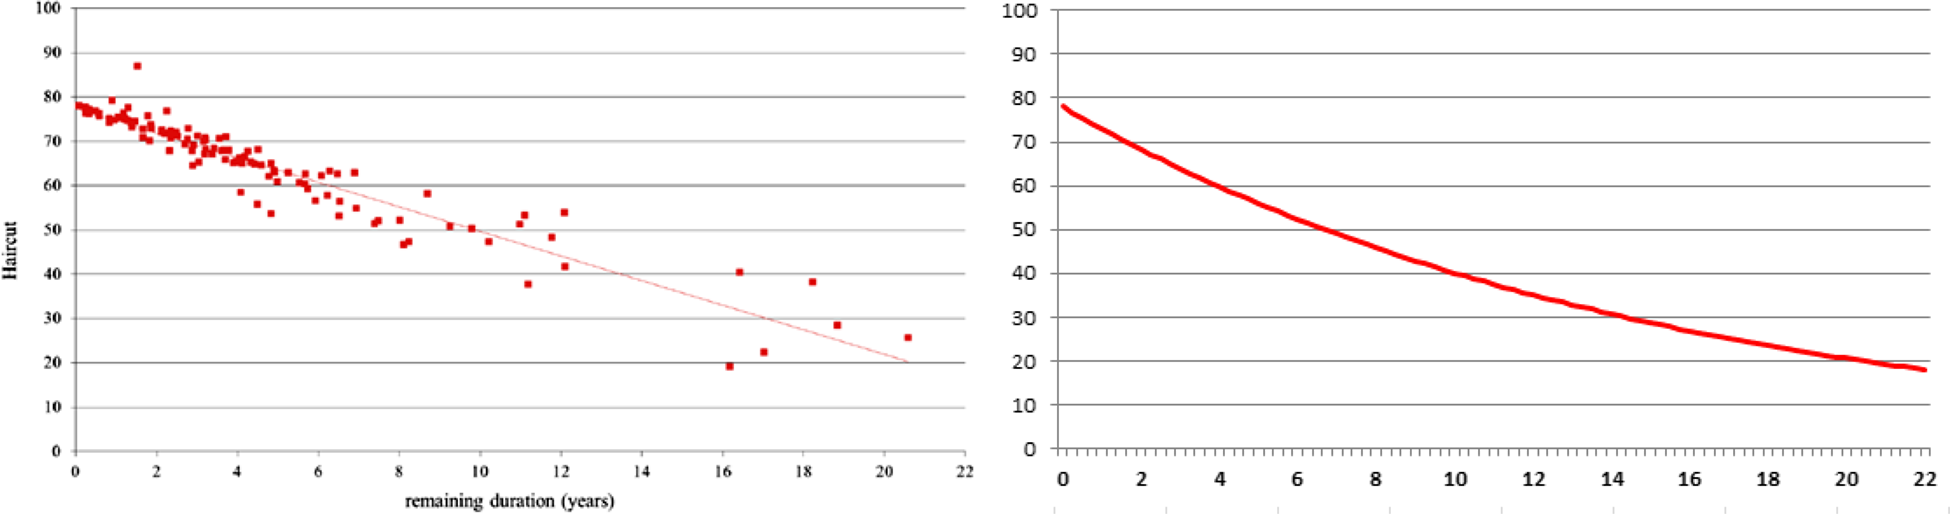
in terms of GDP (Zettelmeyer et al. (Reference Zettelmeyer, Trebesch and Gulati2013)). To match those two features, we set persistence of the shock to 0.93 and the standard deviation to 0.8, which imply the shock does not fade away during the simulation horizon. Those values refer to, respectively,
 $\rho_{\iota}$
and
 $\sigma_{\iota}$
. As showed in Figure 3, these two parameters from our shock specification match pretty closely actual haircuts according to debt maturity, as calculated in Zettelmeyer et al. (Reference Zettelmeyer, Trebesch and Gulati2013).
Actual (left panel) and Simulated (right panel) Haircuts. Source of actual haircuts: Zettelmeyer et al. (Reference Zettelmeyer, Trebesch and Gulati2013)

The baseline tax response targets the difference between taxes in the (counterfactual) steady state and the one observed in data for 2012. We target a reduction of 2.4
 $\%$
on impact in aggregate taxes and calibrate
 $\rho_b$
for each tax rate to match this reduction. We compare the response of the economy by letting one tax component react according to the fiscal rule at a time, leaving fixed the other tax rates.
As for the face value reduction, endogenous effects might produce an initial impact that might be slightly different from the targeted 50
 $\%$
drop due to endogenous response of other model’s variables when taxation is distortionary, what might affect debt price.
4. Results
The steady state of the model represents a situation with no default and, consequently, with an amount of taxes and government spending that allows for serving the full debt. Debt default would either change (reduce) the amount of taxes required for debt repayment or allow for more government spending. In this section, we study how sovereign debt restructuring coupled with different fiscal policy responses affects the sovereign-bank loop.
The fiscal response following a sovereign default can differ in two main dimensions: (i) the difference in tax revenues between the default and the counterfactual scenario can come from changes in different taxes and (ii) the post-default amount of debt can evolve in different ways. For the first point, we study the effect of a sovereign debt restructuring shock coupled with a reduction (compared to a counterfactual scenario with no default) in (i) lump-sum taxes; (ii) increases in government purchases; (iii) taxes on consumption; (iv) taxes on labor; (v) taxes on return on capital and (iv) taxes on banks. In order to deal with the second point, we allow for different speeds of convergence of the level of debt to the steady state – while always assuming that, consistently with the empirical evidence, debt eventually comes back to its pre-default level.
Simulations were conducted using Dynare. The results presented in the paper consider a first-order approximation around the steady state. Appendix A presents the linear expressions of the model.
4.1 Changes in different taxes
4.1.1 Lump sum taxes
In our baseline exercise, we consider a fiscal rule that allows only for changes in lump-sum taxes, leaving other tax rates constant at their steady-state values. As discussed in Section 3.3.1, the fall in lump-sum taxes is calibrated to generate a 2.4
 $\%$
drop in tax revenues on impact. Lump sum taxes are not common in the real world, but feature in several models exploring the nexus between sovereign and bank credit risk.
Footnote 20
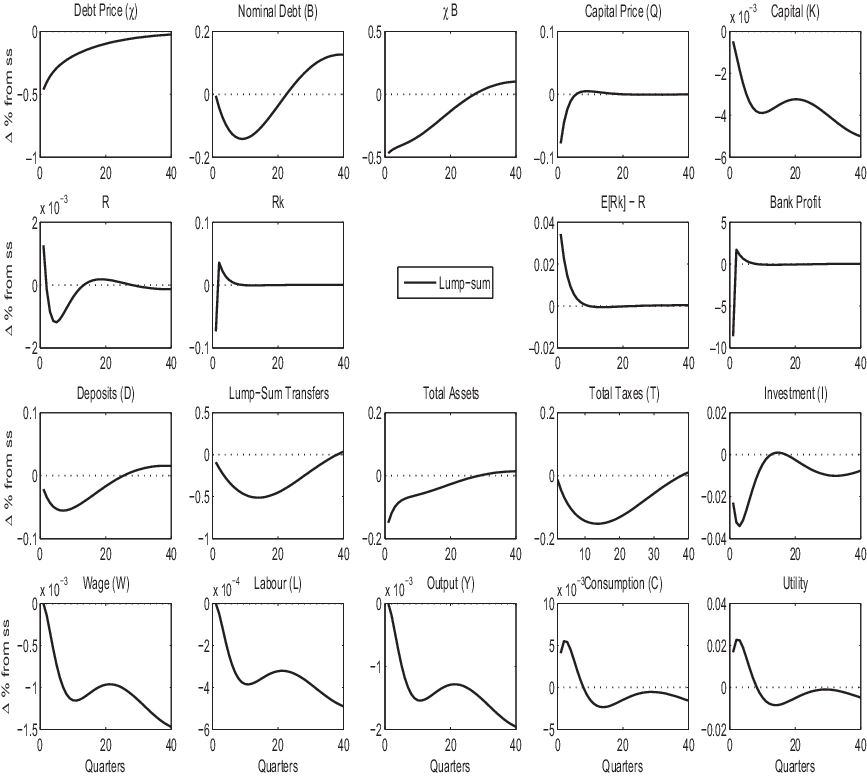
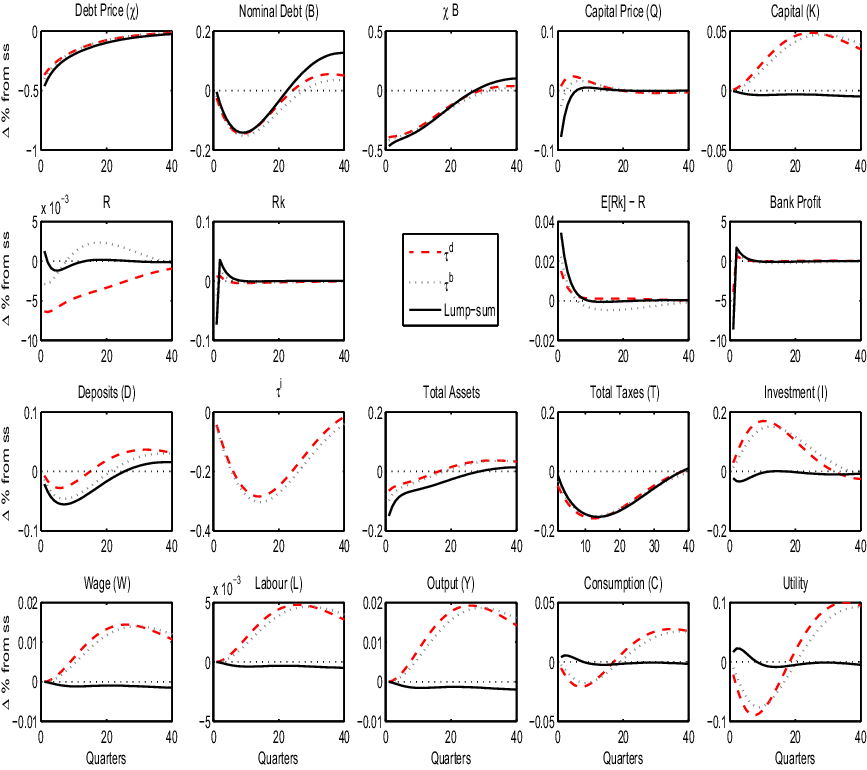
Figure 4 shows the impulse responses.
Response to debt restructuring with a change in lump-sum taxes.

The price of debt falls by more than 40
 $\%$
and recovers slowly in line with the haircut dynamics. The value of debt among banks’ assets drops by the targeted 50
 $\%$
on impact. The ensuing financial disruption is translated into a fall in the price of capital. The mechanism is the following: the decline in banks’ net worth (equation 18) together with their leverage constraint (see equations 19 and 20) forces banks to deleverage. Intuitively, the fall in assets imply a more than proportional fall in equity, so the bank has to sell some of its assets. This can be interpreted as a fire sale. Capital prices thus drop and private credit is reduced. Less private credit leads to an investment drop. The drop in asset demand by banks is reflected in the increase of the spread of capital returns over the risk-free rate on deposits. This mechanism has been discussed by the literature of the sovereign-bank loop.
The result is a very persistent but mild fall in the level of capital and output. The present value of output deviations is
 $1.3 \%$
of (yearly) GDP. Wages and labor supply behave in a similar way. A transfer from banks to the government leads to a fall in economic activity owing to the effects of this transfer on banks’ balance sheets.
In Section 4.2, we will show that the financial disruption stemming from the sovereign-bank loop has a more severe impact on the economy in case fiscal policy is more lax and the level of debt quickly returns to its previous level. In this baseline exercise, face value debt returns to steady-state levels around 6 years after default, which is in line with previous evidence from debt restructuring episodes (Benjamin and Wright, Reference Benjamin and Wright2009; Wright, Reference Wright, Primo Braga and Vincelette2011).
Next, we show that the conclusions from this section heavily rely on the type of tax considered in the exercise.
4.1.2 Government spending
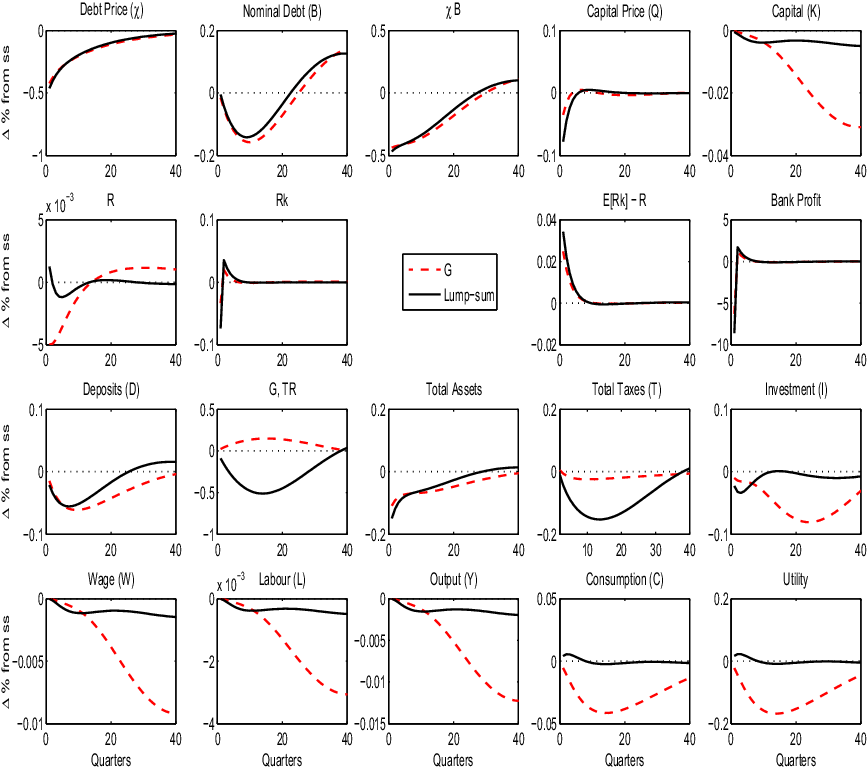
Figure 5 displays the response of the economy when all tax rates are kept fixed and sovereign debt restructuring allows for an increase in government consumption. The increase in G on impact is calibrated to compensate for the 2.4 percentage-point fall on taxes from the counterfactual.
Response to a change in government consumption vs. lump-sum taxes.

In the short run, the effect on capital and output is similar to the case with lump-sum taxes. However, after around 10 quarters, the difference between both cases is very pronounced. The increase in government consumption following default crowds-out private consumption and investment, contributing to worsen the diabolic loop. Owing to this crowding-out effect, the effects of the financial disruption are very persistent. Investment and consumption reach, respectively, a 10
 $\%$
and 5
 $\%$
fall in the medium run, and output is almost 2
 $\%$
below its steady state after 10 years.
Hence, in our laboratory economy, restructuring debt instead of cutting government expenditures leads to a fall in investment and consumption owing to the ensuing financial disruption. It follows that cutting government consumption would avoid a deep and also very long recession. Importantly, the model abstracts from any effects that government spending might have on output. The point here is simply that owing to the sovereign-bank loop, debt restructuring is more costly than a reduction in government consumption.
4.1.3 Taxes on labor income and consumption
We now consider fiscal rules that allow for changes in labor taxes and in consumption taxes, respectively. In each of these exercises, other tax rates are constant at their steady-state values. One can speculate that labor taxes would be a natural candidate for a tax raise to generate extra revenues and repay debt in the absence of sovereign debt restructuring. Such a conjecture follows from the fact that the Greek Bond Exchange was accompanied by an important change in income tax rates, which increased the share of this specific tax source in total tax revenues –
Footnote 21
and while income taxes come from wage taxes and taxes on household savings, the share of income tax revenues originating from wage taxation corresponds to around 80
 $\%$
. Hence, the case with labor taxes is a particularly interesting one.
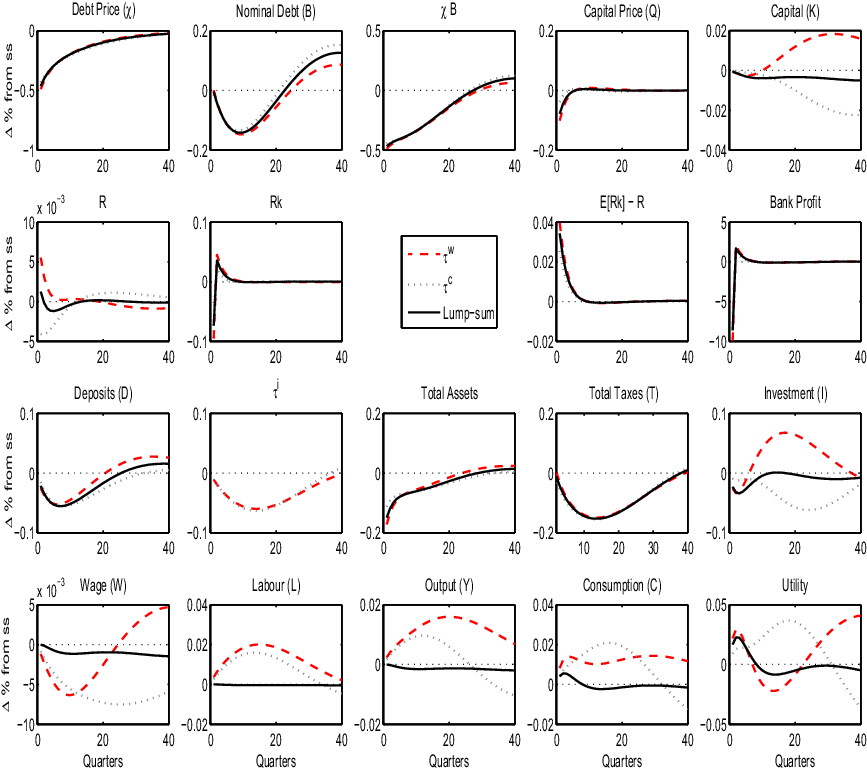
Figure 6 displays the responses of the economy following a sovereign restructuring shock coupled with reductions in labor taxes compared to a case with reductions in consumption taxes. The fall on tax revenues on impact is calibrated to match the 2.4
 $\%$
fall. Tax rates follow the fiscal rule afterward. The responses of the economy now are completely different.
Response to a change in wage and consumption taxes vs. lump-sum taxes.

With lower income taxes, workers are willing to supply more labor. Pre-tax wages are lower, but post-tax wages are larger. The reaction of labor supply is key to the economy’s response. The lower labor costs raise incentives for firms to invest. Interest rates are larger in order to incentivize households to save. The drop in investment is thus short lived. The financial disruption is quickly offset by the effect of lower labor costs.
Output goes up despite the initial drop in capital stock. The increase in output reaches 1.5
 $\%$
after 5 years. Household’s utility increases in the short run, following the increase in consumption, drops in the medium run when labor supply is very high and turns positive again in the long run. Overall, households are better off following debt restructuring.
The message from this exercise is that sovereign debt restructuring coupled with a change in labor taxes does not generate a diabolic sovereign-bank loop. The fall in the value of debt does reduce banks’ lending capacity, so investment and capital fall in the short run. However, the increase in labor taxes required to serve debt would have even more negative effects on the economy. The lower labor taxes (as compared to the counterfactual) boost labor supply and the overall effect is positive. The cost of austerity by means of larger labor taxes beats the cost of financial disruption.
On impact, the response of the economy in the case of consumption taxes is very similar to the case of labor taxes. Both labor and consumption taxes affect the net wage in terms of consumption goods. Hence, initially, the response of pre-tax wages, labor supply and output are similar in both cases.
However, the fall in consumption taxes also reduces the incentives for savings. Indeed, interest rates R fall on impact, deposits fall by more than in the case of labor taxes. As time goes by, we observe a sharp – if delayed – fall in investment. The capital stock in the medium and long run falls. The increase in consumption boosts utility in the short run, but also crowds out investment, so in a few years, consumption, output and household’s utility are below their steady-state levels.
In sum, in our laboratory economy, if sovereign debt restructuring comes in place of a hike in consumption taxes, the effect is positive in the short run, but after a few years, the ensuing financial disruption dominates and leads to a fall in economic activity.
4.1.4 Taxes on capital income and on banks
Finally, we study the response of the economy when sovereign debt restructuring occurs in place of increases in capital (deposits) and bank taxes. Figure 7 shows the response of the economy in both cases. The effects are similar (except for the response of pre-tax interest rates R, as one would expect). In both cases, the result is an increase in capital accumulation and output.
Response to a change in savings taxes and bank taxes vs. lump-sum taxation.

Default is a transfer from banks to the government, but so are taxes on bank’s profits. However, default is a one-off transfer, while taxes on banks affect their marginal lending decisions. The positive effects of sovereign debt restructuring accompanied by a fall in taxes on banks (as compared to the counterfactual with no default) stem from these positive effects on bank credit.
The effect on investment is positive – to the point that, initially, it crowds out consumption. As time goes by, the resulting increase in capital stock leads to larger output. Labor supply does not respond significantly, so wages increase. It takes more than 4 years until consumption hits its steady-state level, but then it increases even further. Overall, in our laboratory economy, sovereign debt restructuring is better than an increase in taxes on banks’ profits.
The effect of sovereign debt restructuring in place of an increase in taxes on deposits is very similar. Taxes on banks directly discourage credit, while taxes on households’ deposits make their liabilities more expensive. As shown in Figure 7, the response of the economy is basically the same in both cases.
Both in this case and in case of labor taxes, the deleterious effects of sovereign default on the banking system are more than compensated by the relatively lower taxes. However, the response of the economy is different in the short and in the long run. In the short run, output and consumption react more strongly in case of labor taxes. The main reason is that the labor supply reacts quickly to changes in taxes. In the case of deposit and banking taxes, investment is stimulated in the short run, but since capital accumulation takes time, the output response peaks only after 5 years. In terms of their effects on the sovereign-bank loop, taxes on banks’ profits and on deposits play very similar roles.
4.1.5 The fiscal response matters
In our laboratory economy, the fiscal reaction after a sovereign default that disrupts financial intermediation is crucial to determine whether and how diabolic the bank-sovereign loop is. On the one hand, sovereign debt restructuring in place of nondistortionary (lump-sum) taxation or nonproductive government expenditures harm the economy even if no other default cost is considered. On the other hand, the financial disruption caused by a sovereign default harms the economy less than the increases in (labor or capital) income taxes that would be needed to fully serve the debt.
The benefits of a sovereign debt restruturing that avoid larger taxes on banks or on capital income appear mostly in the long run – debt restructuring reduces consumption in the first 4 years following the default. In contrast, debt restructuring in place of consumption taxes provides some short run boost to the economy but has significant negative effects in the long run.
4.1.6 Sensitivity
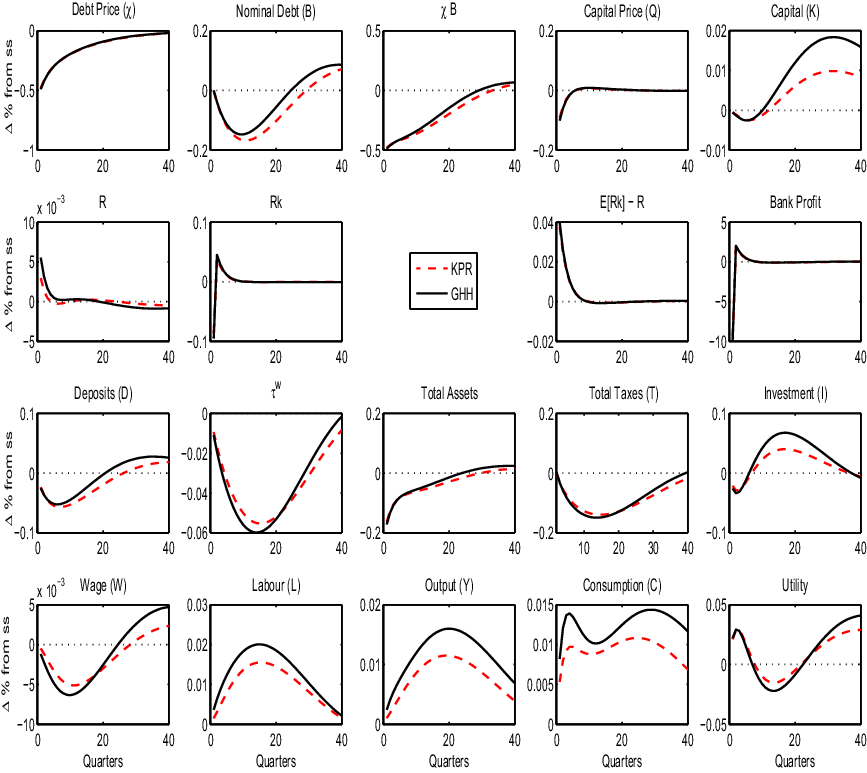
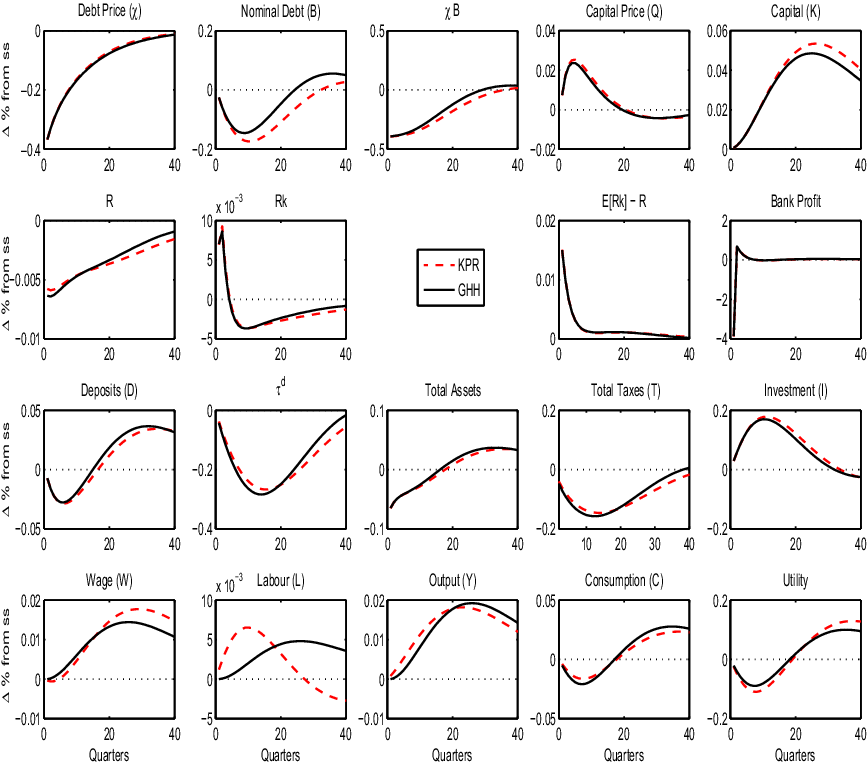
Our model assumes households have GHH-type preferences. This formulation hence shuts down the wealth effect on the labor supply, so the labor supply curve depends only on the real wage. However, our main conclusions do not rely on the particular form of utility function used. In appendix D.1, we show results using KPR-type preferences, following King et al. (Reference King, Plosser and Rebelo1988):
 \begin{equation}u(C, L) = \ln C_{t} - \psi \frac{L_{t}^{1+\varphi}}{1+\varphi}.\end{equation}
In this case, the labor response is less pronounced, so quantitative effects on output are a bit smaller, but the take-home points are very similar.
The tax rule has an autoregressive component
 $\rho_x$
set to 0.9 in the baseline exercises. Appendix D.2 shows how this parameter affects the model. For smaller values of
 $\rho_x$
, the short run response of labor, investment, and output is less pronounced, but the effects persist for longer. The overall effect on real variables is smaller for lower values of
 $\rho_x$
. However, qualitatively, results are similar.
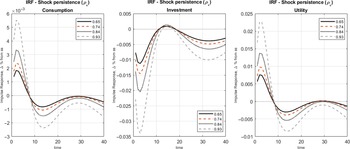
Last, we set the shock persistence (
 $\rho_\iota$
) to
 $0.93$
. Less persistent shocks lead to very similar qualitative responses, but smaller quantitative effects. This is shown in Appendix D.3.
4.2 The speed of fiscal responses
In the previous exercises, we set the parameter
 $\rho_b$
of the fiscal response to debt restructuring so as to match in all cases a decrease in total taxes of 2.4
 $\%$
(compared to a counterfactual scenario with no default). In this section, we let fiscal policy react to a greater extent to the default with a faster decrease in taxes. Debt recovers faster than in the baseline case and is back to its steady-state level in less than seven years. We analyze the cases of lump sum, labor, and deposit taxes. In the case analyzed in Section 4.1.1, debt restructuring coupled with a relief in lump-sum taxes gives rise to a very mild recession. Here, we observe that larger falls in taxes on impact give rise to a more pronounced fall in economic activity. In case taxes respond so quickly that the value of outstanding debt
 $\chi B$
is back to its steady-state level in around two years, the fall in capital is large and leads to an output drop that reaches
 $0.6\%$
(with a similar effect on wages). Intuitively, the fall in taxes is partly compensated by government debt issuance. Leverage-constrained banks have thus less room for buying firms’ assets. Hence, owing to its effects on banks balance sheets, sovereign debt crowds out capital accumulation.
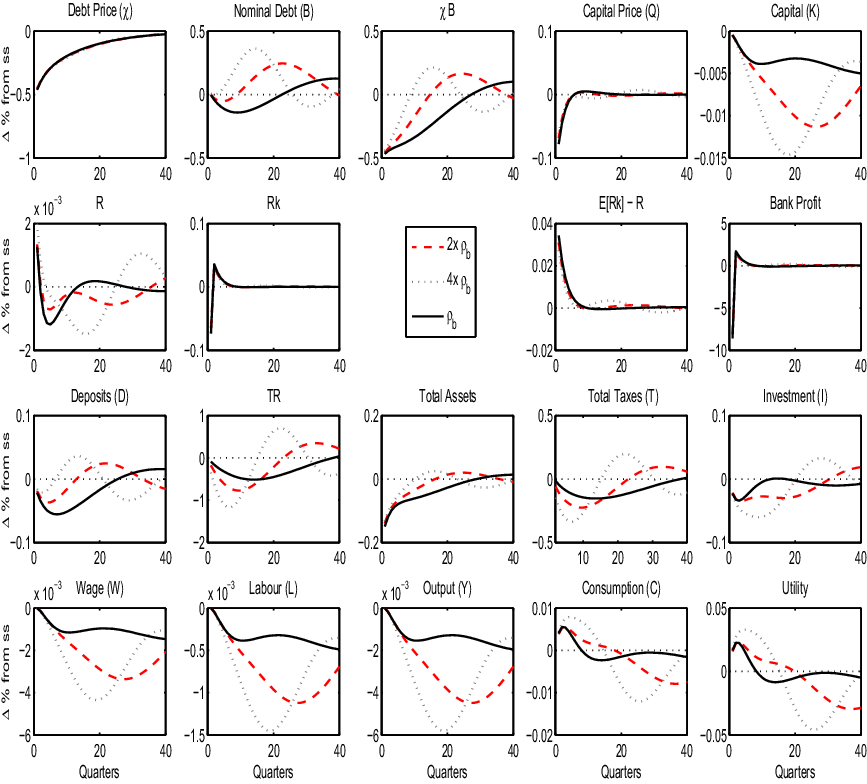
Figure 8 considers the case of changes in lump-sum taxes and compares the response of the economy when the parameter
 $\rho_b$
of the fiscal rule is, respectively, two and four times higher.
Response to a change in lump-sum taxes: effect of speed.

In the short run, there is a consumption boost because agents have more disposable income but investment cannot grow owing to the constraints on banks. The overall effect is however negative. Table 3 shows that the cumulated negative effect on output of a sovereign restructuring coupled with a relief in lump-sum taxes is not so small if
 $\rho_b$
is large. It compares the present value percentage drop in output due to the shock relatively to remaining in steady state. The table shows that annualized loss of output almost doubles when the speed of adjustment is four times larger.
Present value of output deviations, varying the speed of adjustment (accumulated up to 15 years, annualized)

Figure 8 also makes clear that different speeds of adjustment generate responses that are not a simply scaled version of one another. In particular, they have different implications in the short and in the long run. The deeper the initial fall in taxes following debt restructuring, the faster nominal debt starts to grow and the largest is the crowding-out effect of sovereign debt issuance on capital accumulation. Footnote 22
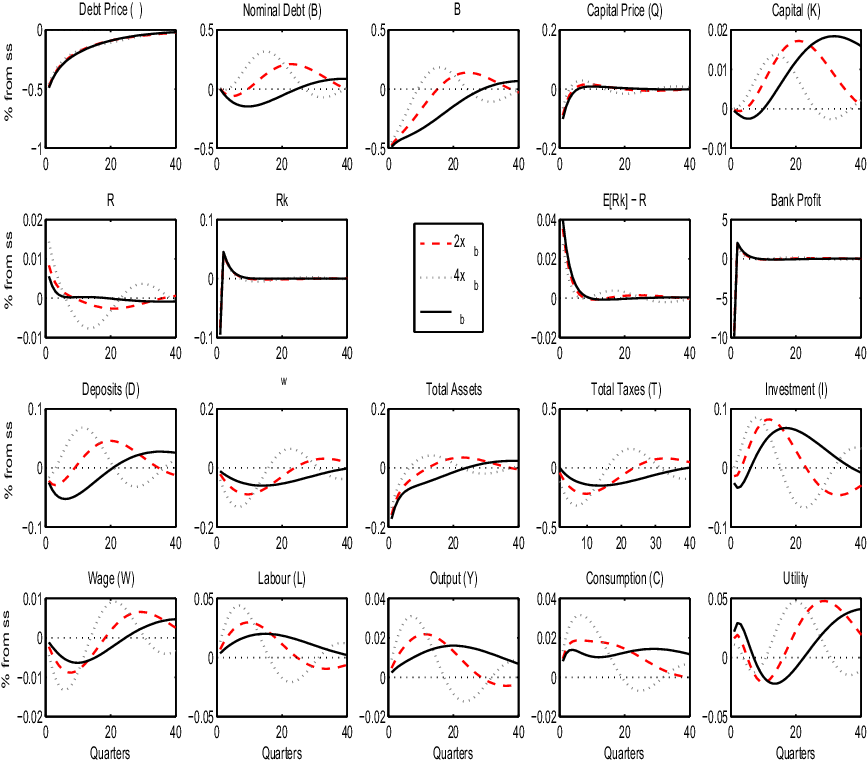
Figure 9 shows a similar comparison for labor taxes. In this case, there is a clear trade-off between short-run and long-run effects. In the short run, a more responsive fiscal rule further stimulates labor supply and output, contributing to alleviate the financial disruption and increase investment. Nevertheless, the subsequent faster increase in nominal debt makes tax cuts short-lived and in the medium run taxes start to increase, discouraging labor supply and generating a downward movement in the economic cycle. From the perspective of the financial disruption following default, the short-run recovery of asset value is faster, both because real debt value increases via nominal debt and because investment grows since firms are expanding. But this recovery is also not long lasting and is different in its composition: asset value recovers mainly because banks buy more debt at a lower price. In contrast, in the baseline case, the stimulus provided is smooth but prolongued, and capital recovery is more pronounced in the long run. This is due to little crowding-out effect of sovereign debt on capital accumulation – debt remains low for a longer time. Moreover, a very responsive fiscal stance is more likely to generate cycles, whereas a more contained rule avoids volatility and the economy returns to steady state after a shorter horizon. Footnote 23
Response to a change in labor taxes: effect of speed.

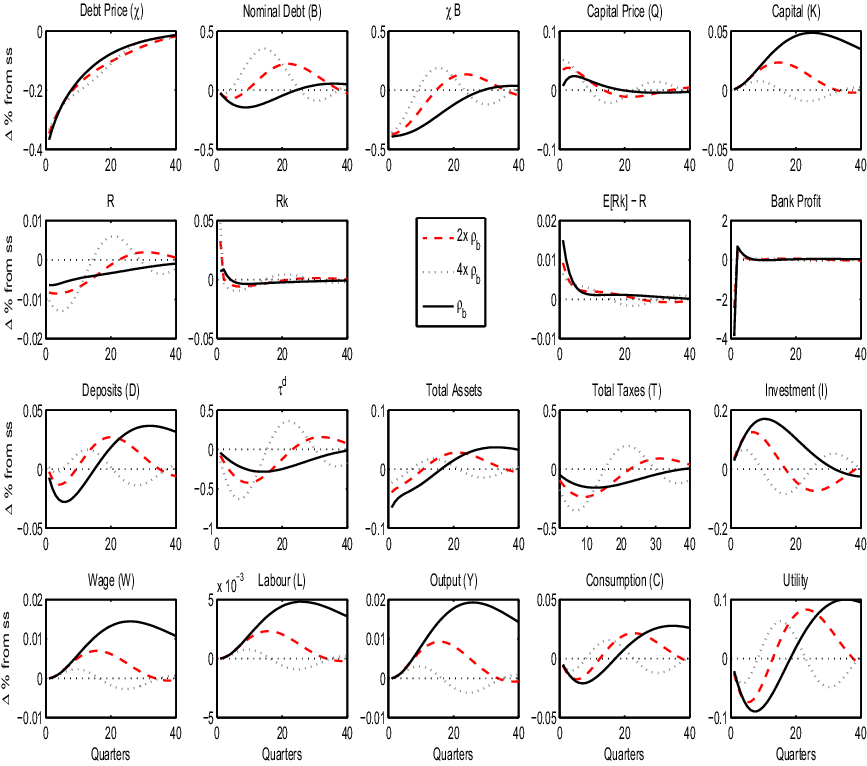
Figure 10 shows a similar exercise letting deposit taxes respond. The crowding-out effect here is very important. In the baseline case, the response of output, capital, and labor is very strong. The effect on output and capital in the other two cases is always weaker, if not negative, no matter the horizon. This happens precisely because faster debt increases after the restructuring crowds out capital recovery, owing to the leverage constraints faced by banks. The difference between this and the exercise with labor taxes is that in the latter case, the labor response to tax cuts stimulates firms’ demand for capital, which leads to more investment and attenuates the crowding-out effect.
Response to a change in deposit taxes: effect of speed.

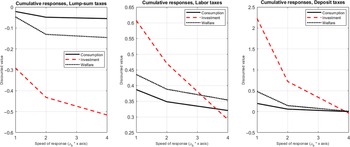
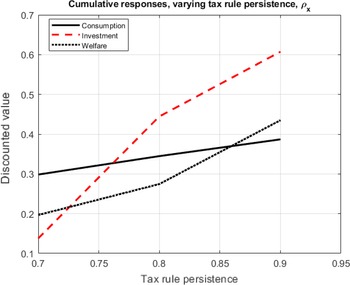
Last, Figure 11 shows the cumulative responses of consumption, investment, and welfare as we vary the policy response
 $\rho_b$
. The first graph shows that when debt restructuring leads to lower lump-sum taxes, the welfare effect is negative owing to the sovereign-bank loop, but the other 2 pictures show that the same is not true when debt restructuring leads to lower labor taxes or deposit taxes. We can also see that the speed of response is quantitatively important. More responsive policy, captured by higher values of
 $\rho_b$
, lead to more negative effects in all cases. If policy is excessively responsive, the crowding-out effect inhibits accumulation of capital. In the short run, the effect depends on the chosen tax instrument, but in the long run, a smoother fiscal stance is always better.
Cumulative responses as functions of
 $\rho_b$
.

5. Final remarks
We presented a simple model that captures the sovereign-bank loop and calibrated it to the Greek economy in the quarters surrounding the 2012 Bond Exchange. Our contribution is to study how rules targeting different tax instruments and speeds of fiscal reaction shape the response of this laboratory economy to a debt restructuring shock.
Sovereign default forces leverage-constrained banks to deleverage, which has a negative impact on investment and output. As it turns out, different fiscal policy responses interact with this deleveraging effect in different ways: increasing government consumption crowds out investment, which prevents the economy from recovering in the medium run; lower labor taxes (compared to a counterfactual scenario with no debt restructuring and larger taxation needs); raise the marginal productivity of capital and the demand for investment, which more than offsets the losses from financial disruption; lower consumption taxes also raise the labor supply in the short run, but the stimulus for consumption crowds out investment and hence hurt the economy in the medium run; lower taxes on banks offset the effect of default and also affect marginal lending decisions, so the effect on investment is positive; lower taxes on deposits affect the economy in a very similar way by reducing the costs of funds for investment; and a more conservative fiscal stance (lower speed of adjustment) leads to a quicker recovery since government debt crowds out space for capital investment in banks’ balance sheets. Thus, how diabolic the post-default sovereign-bank loop is depends to a great extent on the way fiscal policy responds.
The paper suggests that the sovereign-bank loop by itself is not the culprit for the weak post-default economic performance in Greece, but our simple linearized framework has limitations. First, debt restructuring is represented by an exogenous shock, so the choice of fiscal instrument has no effect on (past and current) default risk. This might be quantitatively relevant. Second, in equilibrium, interest rate on capital and on government debt are perfect substitutes. A more sophisitcated modeling of portfolio choices could add insights to how different fiscal instruments affect the economy after debt restructuring. Exploring these nonlinear effects is left for future research.
Acknowledgements We thank the associate editor, four anonymous referees, Luis Araujo, Chryssi Giannitsarou, Carlos Eduardo GonÇalves, Pontus Rendahl, Marcel Ribeiro, and Vladimir Teles, and seminar participants at Banco Central do Brasil, U Cambridge, Econometric Society NASM 2014 (Minneapolis), ESEM 2014 (Toulouse), LAMES 2014 (Sao Paulo), RIDGE 2015 (Montevideo), SBE 2014 (Natal), and Sao Paulo School of Economics – FGV for useful comments. This paper subsumes the material in “Financial disruption as a cost of sovereign default: a quantitative assessment”. Diniz gratefully acknowledges financial support from FAPESP. Guimaraes gratefully acknowledges financial support from CNPq.
Appendix A. Banks allocation problem
Using the conjecture for the value function form suggested in (23), we can write the Lagrangian for the banks’ maximization problem. Banks will maximize its terminal value (19) subject to the constraint (20).
 \begin{equation*}\mathcal{L} = \nu_{t} Q_t K_{t+1} + \zeta_{t} \chi_t B_{t+1} + \eta_t N_t - \mu_t \left[ \lambda (Q_t K_{t+1} + \chi_t B_{t+1}) - (\nu_{t} Q_t K_{t+1} + \zeta_{t} \chi_t B_{t+1} + \eta_t N_t) \right].\end{equation*}
That can be simplified to
 \begin{equation*}\mathcal{L} = \left[ \nu_{t} Q_t K_{t+1} + \zeta_{t} \chi_t B_{t+1} + \eta_t N_t \right] (1+\mu_t) - \mu_t \lambda (Q_t K_{t+1} + \chi_t B_{t+1}),\end{equation*}
where
 $\mu_t$
is the Lagrangian multiplier with respect to the incentive constraint. The first-order conditions for
 $K_{t+1}$
,
 $B_{t+1}$
and
 $\mu_t$
are
 \begin{align*} \nu_t (1+\mu_t) &= \mu_t \lambda,\\[5pt]\zeta_t (1+\mu_t) &= \mu_t \lambda,\\[5pt]\lambda (Q_t K_{t+1} + \chi_t B_{t+1}) &= \nu_{t} Q_t K_{t+1} + \zeta_{t} \chi_t B_{t+1} + \eta_t N_t.\end{align*}
The first and second FOCs are symmetric. On the left hand side is the marginal benefit for the bank from expanding each of the assets components and on the right-hand side the marginal cost of tightening the incentive constraint by
 $\lambda$
. The last FOC is the incentive constraint itself.
The constraint binds (
 $\mu_t > 0$
) only if the marginal discounted value of both the banks assets is positive. In case the constraint binds, the FOCs for securities and bonds show that the discounted marginal value for each of those components should be equal. It means that in the margin, the bank is indifferent from investing resources in government bonds or private securities.
Now we show that the conjectured form of the value function holds. From (21), (22) and (23) we have:
 \begin{equation*}\nu_t Q_t K_{t+1} + \zeta_t \chi_t B_{t+1} + \eta_t N_t = E_t \beta \Lambda_{t,t+1} \{ (1-\theta) N_{t+1} + \theta \left[ \nu_{t+1} Q_{t+1} K_{t+2} + \zeta_{t+1} \chi_{t+1} B_{t+2} + \eta_{t+1} N_{t+1} \right] \}.\end{equation*}
Using the definitions of
 $\varpi_t$
and
 $\phi_t$
, we simplify the above equation to:
 \begin{equation*} LHS = E_t \beta \Lambda_{t,t+1} \{ (1-\theta) N_{t+1} + \theta N_{t+1} \left[ \nu_{t+1} \varpi_{t+1} + \zeta_{t+1} ( \phi_{t+1} - \varpi_{t+1}) + \eta_{t+1} \right] \}. \end{equation*}
Inserting the definition of
 $\tilde{\Omega}_t$
we get
 \begin{equation*} LHS = E_t \beta \Lambda_{t,t+1} \tilde{\Omega}_{t+1} N_{t+1}. \end{equation*}
Substituting for
 $N_{t+1}$
:
 \begin{equation*}LHS =E_t \beta \Lambda_{t,t+1} \Omega_{t+1} \cdot \left[ \left(r_{t+1}^{k} - r_{t+1}\right) Q_{t} K_{t+1} \left(1-\tau_{t+1}^{b}\right) + \left(r_{t+1}^{b} - r_{t+1}\right) \chi_{t} B_{t+1} \left(1-\tau_{t+1}^{b}\right) + \left( 1 + r_{t+1} \left(1-\tau_{t+1}^{b}\right) \right) N_{t} \right].\end{equation*}
Comparing the terms for
 $K_{t+1}$
,
 $B_{t+1}$
and
 $N_t$
, we see that the conjecture holds if (25), (26) and (24) hold.
Appendix B. Linear expressions for the model
The model is log-linearized around its steady state. For the approximate linear expressions, we suppress time notations, and a top bar denotes the steady-state value of a variable (for example,
 $\bar{x}$
would be the steady-state value of a variable x). Hence, for a standard production function
 \begin{equation*}Y_t = K_t^{\alpha} L_t^{1-\alpha},\end{equation*}
the log-deviation form Y, presented here, is
 \begin{equation*}Y = \ln {Y_t} - \ln {\bar{Y.}}\end{equation*}
We present the approximate linear expressions for the model in what follows. The notation is consistent with how variables are declared in Dynare.
B.1 Households: Equations (1)–(4)
GHH version
 \begin{equation} 0 = \bar{\varrho} \bar{C} (\varrho + C) + \frac{\psi}{(1+\varphi)} \bar{\varrho} \bar{L}^{(1+\varphi)} (\varrho + (1+\varphi) L),\end{equation}
 \begin{equation} \frac{t^c}{1+\bar{t^c}} + \varphi L = W - \frac{t^w}{1-\bar{t^w}},\end{equation}
 \begin{equation} 0 = (\bar{R} + \bar{t^d} - \bar{R} \bar{t^d}) \Lambda_{+1} + \bar{R} (1-\bar{t^d}) R - (\bar{R} -1) t^d_{+1},\end{equation}
 \begin{equation} \Lambda = \varrho - \varrho_{-1} - \frac{t^c - t^c_{-1}}{1+\bar{t^c}}.\end{equation}
KPR version
 \begin{equation} \varrho = -C,\end{equation}
 \begin{equation} \frac{t^c}{1+\bar{t^c}} + \varphi L = W - \frac{t^w}{1-\bar{t^w}} - C,\end{equation}
 \begin{equation} 0 = (\bar{R} + \bar{t^d} - \bar{R} \bar{t^d}) \Lambda_{+1} + \bar{R} (1-\bar{t^d}) R - (\bar{R}-1) t^d_{+1},\end{equation}
 \begin{equation} \Lambda = C_{-1} - C - \frac{t^c - t^c_{-1}}{1+\bar{t^c}}.\end{equation}
B.2 Firms: Equations (5)–(11)
 \begin{equation} Y = \alpha K_{-1} + (1-\alpha) L,\end{equation}
 \begin{equation} W = Y - L,\end{equation}
 \begin{equation} \bar{R_k} (R_k + Q_{-1}) = \bar{Z} Z + (1-\delta) Q,\end{equation}
 \begin{equation} Z = Y - K_{-1},\end{equation}
 \begin{equation} \bar{I} Q = \eta_i (I - I_{-1}) - \beta \eta_i (I_{+1}-I),\end{equation}
 \begin{equation} \bar{I} I = \bar{K} (K - (1-\delta) K_{-1}),\end{equation}
 \begin{equation} \bar{Y} Y = \bar{C} C + \bar{G} G + \bar{I} I.\end{equation}
B.3 Banks: Equations (12)–(24)
 \begin{equation} \bar{\nu} \nu = \beta \bar{\Omega} (\bar{R_k} - \bar{R}) (\Lambda_{+1} + \Omega_{+1}) + \beta \bar{\Omega} (\bar{R_k} R_{k+1} - \bar{R} R),\end{equation}
 \begin{equation} \bar{\zeta} \zeta = \beta \bar{\Omega} (\bar{R_b} - \bar{R}) (\Lambda_{+1} + \Omega_{+1}) + \beta \bar{\Omega} (\bar{R_b} R_{b+1} - \bar{R} R),\end{equation}
 \begin{equation} \bar{\eta} \eta = (\beta \bar{\tilde{\Omega}} + \beta \bar{\tilde{\Omega}} (\bar{R}-1) (1-\bar{t^b})) (\Lambda_{+1} + \tilde{\Omega}_{+1}) + \beta \bar{\tilde{\Omega}} (1-\bar{t^b}) \bar{R} R - \beta \bar{\tilde{\Omega}} (\bar{R}-1) t^b_{+1},\end{equation}
 \begin{equation} \Omega = \tilde{\Omega} - (t^b/(1-\bar{t^b})),\end{equation}
 \begin{equation} \bar{\tilde{\Omega}} \tilde{\Omega} = \theta \bar{\phi} \bar{\zeta} (\phi + \zeta) + \theta \bar{\varpi} \bar{\nu} (\varpi + \nu) - \theta \bar{\varpi} \bar{\zeta} (\varpi + \zeta) + \theta \bar{\eta} \eta,\end{equation}
 \begin{equation} \varpi = Q + K - N,\end{equation}
 \begin{equation} \bar{\phi} (\lambda- \bar{\zeta}) \phi = \bar{\eta} \eta + \bar{\phi} \bar{\zeta} \zeta,\end{equation}
 \begin{equation} \bar{K} (Q + K) + \bar{\chi} \bar{B} (\chi + B) = \bar{\phi} \bar{N} (\phi + N),\end{equation}
 \begin{equation} \bar{N} N = \bar{N_e} N_e + \bar{N_n} N_n;\end{equation}
 \begin{align} \bar{N_e} N_e = & - \theta \bar{N} ((\bar{R_b}-\bar{R}) \bar{\phi} + (\bar{R}-1)) t^b + \theta (1-\bar{t^b}) \bar{N} ((\bar{R_b}-\bar{R}) \bar{\phi} + (\bar{R}-1)) N_{-1}\nonumber\\[4pt] & + \theta \bar{N} N_{-1} + \theta (1-\bar{t^b}) \bar{N} (\bar{\varpi} \bar{R_k} R_k + \bar{R_b} (\bar{\phi}-\bar{\varpi}) R_b + \bar{\phi} (\bar{R_b}-\bar{R}) \phi_{-1} + \bar{R} (1-\bar{\phi}) R_{-1}),\end{align}
 \begin{equation} \bar{N_n} N_n = - \omega (\bar{K} + \bar{\chi} \bar{B}) t^b + \omega (1-\bar{t^b}) (\bar{K} Q + \bar{K} K_{-1} + \bar{\chi} \bar{B} \chi + \bar{\chi} \bar{B} B_{-1}),\end{equation}
 \begin{equation} \bar{K} (Q + K) + \bar{\chi} \bar{B} (\chi + B) = \bar{N} N + \bar{D} D,\end{equation}
 \begin{equation} prem = R_{k+1}-R,\end{equation}
 \begin{equation} \bar{nt} nt = \bar{R_k} \bar{K} R_k + (\bar{R_k}-1) \bar{K} (Q_{-1} + K_{-1}) + \bar{R_b} \bar{\chi} \bar{B} \bar{R_b} + (\bar{R_b}-1) \bar{\chi} \bar{B} (\chi_{-1} + B_{-1}) - \bar{R} \bar{D} R_{-1} - (\bar{R}-1) \bar{D} D_{-1},\end{equation}
B.4 Government: Equations (25)–(30)
 \begin{equation} \mu \bar{\chi} \chi + \bar{\chi} B = \mu m + \frac{\bar{G} G - \bar{T} T}{\bar{B}} + (\mu+\bar{\chi} (1-mu)) B_{-1},\end{equation}
 \begin{equation} R_{k+1} = R_{b+1},\end{equation}
 \begin{equation} m = \iota,\end{equation}
 \begin{equation} \bar{R_b} \bar{\chi} (R_b + \chi_{-1}) = \mu m + (1-\mu) \bar{\chi} \chi.\end{equation}
B.5 Fiscal rules: Equations (32)–(39)
 \begin{equation} \bar{T} T = \bar{TR} TR + \bar{C} t^c + \bar{C} \bar{t^c} C + \bar{W} \bar{L} t^w + \bar{t^w} \bar{W} \bar{L} L + \bar{t^w} \bar{W} \bar{L} W + \bar{D} (\bar{R}-1) t^d + \bar{D} \bar{t^d} (\bar{R}-1) D_{-1} + \bar{R} \bar{t^d} \bar{D} R_{-1} + \bar{nt} t^b + \bar{nt} \bar{t^b} nt.\end{equation}
We perform different experiments changing one type of tax each time. In case we change consumption taxes:
 \begin{equation*} t^c = \kappa t^c_{-1} + \rho_b \bar{\chi} \bar{B} (\chi + B_{-1}).\end{equation*}
In case of labor taxes:
 \begin{equation*} t^w = \kappa t^w_{-1} + \rho_b \bar{\chi} \bar{B} (\chi + B_{-1}).\end{equation*}
In case of taxes on deposits:
 \begin{equation*} t^d = \kappa t^d_{-1} + \rho_b \bar{\chi} \bar{B} (\chi + B_{-1}).\end{equation*}
In case of taxes on banks:
 \begin{equation*} tb = \kappa tb_{-1} + \rho_b \bar{\chi} \bar{B} (\chi + B_{-1}).\end{equation*}
In case of lump-sum taxes or transfers:
 \begin{equation*} \bar{TR} TR = \kappa \bar{TR} TR_{-1} + \rho_b \bar{\chi} \bar{B} (\chi + B_{-1}).\end{equation*}
In case of government spending:
 \begin{equation*} \bar{G} G = \kappa \bar{G} G_{-1} - \rho_b \bar{\chi} \bar{B} (\chi + B_{-1}),\end{equation*}
 \begin{equation} XB = \chi + B,\end{equation}
 \begin{equation} (\bar{K}+ \bar{\chi} \bar{B}) AST = \bar{K} (Q+K) + \bar{\chi} \bar{B} (\chi + B),\end{equation}
 \begin{equation} KV = Q + K,\end{equation}
 \begin{equation} tcons = (t^c/\bar{t^c}) + C,\end{equation}
 \begin{equation} twage = (t^w/\bar{t^w}) + W + L,\end{equation}
 \begin{equation} tdep = (t^d/\bar{t^d}) + D_{-1} + (\bar{R}/(\bar{R}-1)) R_{-1},\end{equation}
 \begin{equation} tbank = (t^b/\bar{t^b}) + nt,\end{equation}
 \begin{equation} nwage = W - t^w/(1-\bar{t^w}).\end{equation}
B.6 Shocks: Equation (40)
 \begin{equation} \iota = \rho_{\iota} \iota_{-1} - e_{\iota,}\end{equation}
Appendix C. Data
Data sources and description

E: Eurostat, BG: Bank of Greece, B: Bloomberg, BS: Bankscope.
Appendix D. Sensitivity analysis
D.1 KPR preferences
This specification makes utility separable in consumption and labor. Labor supply choice will not be independent from consumption and wealth effects are present. The first-order conditions change to
 \begin{align} \psi L_{t}^{\varphi} & = \frac{(1-\tau^{w}_{t}) W_t}{(1+\tau^{c}_{t}) C_t},\nonumber\\[5pt]\Lambda_{t,t+1} & \equiv \frac{C_{t}}{C_{t+1}} \frac{(1+\tau^{c}_{t})}{(1+\tau^{c}_{t+1})}.\end{align}
Figures 12 and 13 (in appendix) address the exercises with labor and capital taxes for this type of preferences. Qualitatively results do not seem to change much. The key difference in both cases lies in the labor response and generates a small quantitative difference for the utility path.
Response to a change in labor taxes: GHH vs. KPR utility function.

Response to a change in deposit taxes: GHH vs. KPR utility function.

For the case of labor taxes, the KPR preferences make labor react less to the fiscal rule, for the same cut in taxes. This milder reaction also causes investment not to increase as much as for GHH preferences, and so GDP and consumption increase less. This is exactly due to the wealth effect from equation (79): an increase in real wage also increases consumption, so that labor responds less to a similar increase in net wage. Output increases around 1/3 less, due to smaller labor and capital reaction.
The case of deposit taxes is distinct in that labor supply reacts more in the short run. The decrease in capital taxes stimulates savings at the expense of consumption, as in the GHH case. But with KPR preferences, this implies an immediate increase in labor supply. In the long run, labor supply falls as consumption starts to increase following output expansion. Quantitatively, the effect on output and utility, as well as the size of the effects on banks and the fiscal side, is very close.
Reaction for consumption and bank taxes (available upon request) follows, respectively, the qualitative response of labor and deposit taxes. This subsection clarifies thus that the qualitative effects discussed above do not lie on the assumption about the utility function neither do much the quantitative ones.
D.2 Persistence of tax rule (
 $\rho_x$
)

The autoregressive component of the tax rule,
 $\rho_x$
, is calibrated to 0.9 in the baseline exercises. Figure 14 shows how the response of labor taxes is affected when we set this parameter to 0.8.
Response to a change in labor taxes: effect of rule persistence.

Qualitatively, the economy behaves in a similar way. The effect of a less persistent tax rule is similar to the case of a less responsive fiscal rule: the effects are smaller in the short run but persist for longer. Indeed, the effect on output peaks after more than 20 quarters.
Figure 15 shows the cumulative effect on consumption, investment, and welfare. A larger
 $\rho_x$
leads to a higher cumulative response. The difference in short-run responses is quantitatively more important than the difference in long-run effects.
Cumulative effect of rule persistence.

D.3 Persistence of the shock (
$\rho_\iota$
)

Figure 16 shows what happens to consumption, investment, and utility when we vary the shock persistence
 $\rho_\iota$
.
Impulse responses.

Qualitatively, the responses of consumption, investment, and utility are very similar. Lower shock persistence
 $\rho_\iota$
leads to smaller quantitative effects, which look like scaled-down versions of the baseline effects
 $\rho_\iota = 0.93$
. The same holds for the other key economic variables. Intuitively, a less persistent shock is very similar to a smaller shock.