INTRODUCTION
Emotional information in spoken language, besides using visual body cues (Batty & Taylor, Reference Batty and Taylor2003; Krauss et al., Reference Krauss, Chen and Chawla1996; Künecke et al., Reference Künecke, Wilhelm and Sommer2017; Parkinson, Reference Parkinson2005), is translated into two main channels: verbal and vocal cues. The simultaneous interplay of the two levels (semantic and prosodic cues) delivers the speaker’s emotions and intentions and listeners identify and interpret the information (Brosch et al., Reference Brosch, Pourtois and Sander2010; Buck, Reference Buck1984; Pell et al., Reference Pell, Jaywant, Monetta and Kotz2011; Tonhauser, Reference Tonhauser, Cummins and Katsos2019). The use of sarcasm, which often intentionally contrasts intonation with semantic content (Cheang & Pell, Reference Cheang and Pell2008) to emphasize a negatively intended meaning, exemplifies such interaction. If someone says, “Great!” or “Fantastic!” with a negative or an ironic tone, listeners generally interpret the remark as opposite to the positive semantic meaning.
The interpretation of prosodic cues is imperative for the perception of spoken emotional messages (Celce-Murcia et al., Reference Celce-Murcia, Dörnyei and Thurrel1995; Hellbernd & Sammler, Reference Hellbernd and Sammler2016; Min & Schirmer, Reference Min and Schirmer2011; Tonhauser, Reference Tonhauser, Cummins and Katsos2019). This can be, however, challenging for second language learners and users. When the intonational systems of the target language and that of the first language differ significantly (Pell & Skorup, Reference Pell and Skorup2008), second language learners and users experience greater difficulties in distinguishing subtle intentional elements expressed through the use of prosodic cues. This is the case for Korean learners of English because there exist some major differences in speakers’ use of phonological and nonphonological intonational features between Korean and English.
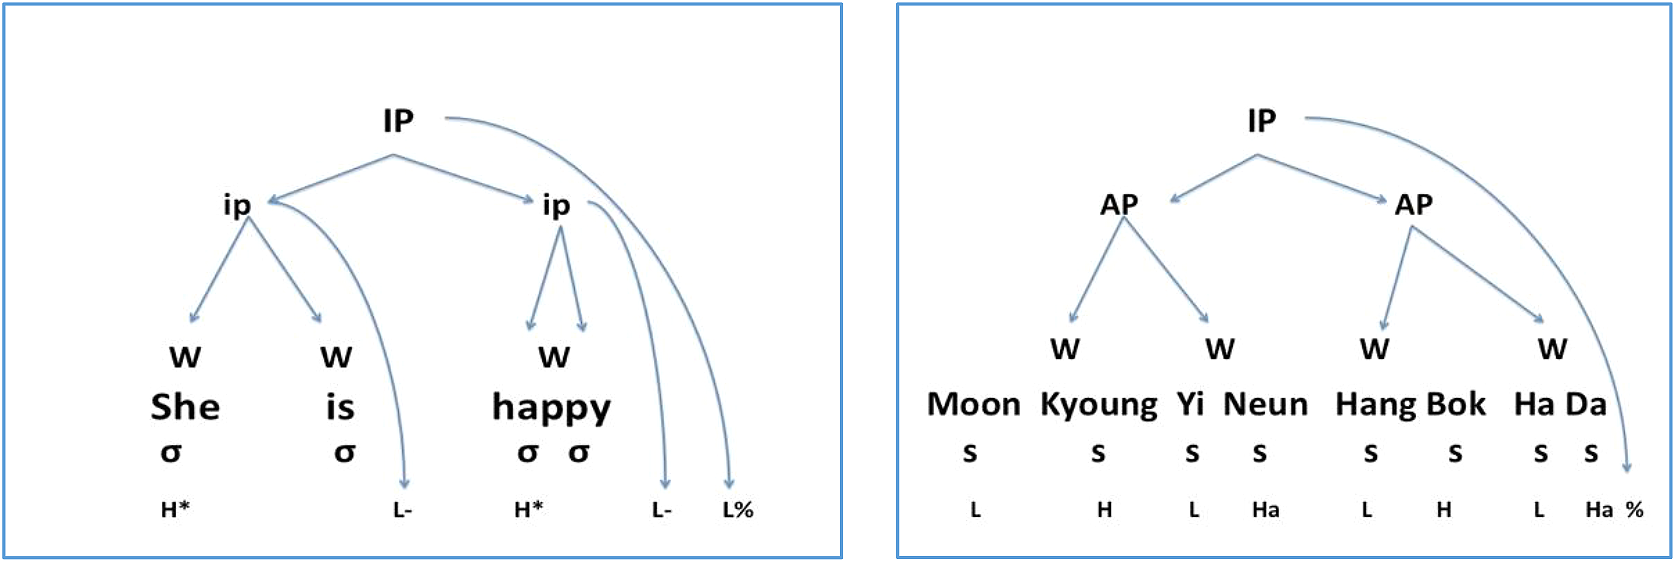
The phonological features relate to the overall intonation contour patterns. English and Korean use distinctively different patterns partly due to the way that prominence is marked. English marks prominence of a word by pitch accent whereas in Korean, the prominence is more associated with the location of a word in a phrase (Jun, Reference Jun2005; MacDonald, Reference MacDonald2011). The difference in prosodic units also links to the different contour patterns. English has two prosodic units higher than words: an Intonation Phrase (IP) and an Intermediate Phrase (ip) (Beckman & Pierrehumbert, Reference Beckman and Pierrehumbert1986). An IP, the highest prosodic unit, consists of at least one ip, a unit lower than an IP. An ip contains at least one pitch accent, the prominence of a stressed syllable. Figure 1 shows an example of the intonation structure of an English declarative sentence analyzed by the autosegmental-metrical model (Pierrehumbert, Reference Pierrehumbert1980). The intonation structure of a declarative sentence, “She is happy” can be structured as shown in Figure 1 when it does not signal any other pragmatic meanings, such as “She IS (now) happy” or “SHE (not someone else) is happy,” rather than conveying the state of being happy. Each sigma (δ) stands for an individual syllable, and “W” for each word. In this sentence, the predicate, “she is” and the adjective phrase “happy” made two ips. Within the two ips, the syllable “She” and the first syllable of the word, “Happy” mark pitch accent (*). Each ip ends with low phrase accent (L-), and the sentence finally ends with the low boundary (L%).
Example of the intonation structure of English and Korean.

Although Korean also has prosodic units higher than words, namely an IP and Accented Phrase (AP), an AP, a unit lower than an IP yet higher than words, differs from the English ip. AP is marked by a phrase-final rising tone (Jun, Reference Jun2005; MacDonald, Reference MacDonald2011) unlike the English ip, which is marked by a phrase final lengthening or a pause. The typical AP pattern of four syllables is that the initial two syllables generally have a high plateau (HH: High and High) or a rising tone (LH: Low to High), and the last two syllables have a rising tone (LHa; rising from Low to High). For instance, HHLHa or LHLHa are the typical Korean AP pattern of four syllables. Figure 1 shows the translated version of “Moon Kyoung is happy,” “문경이는 (Moon Kyoung Yi Neun) 행복하다 (Hang Bok Ha Da).” In the intonation structure below (see Figure 1), each AP consists of four syllables. Accordingly, the AP structure follows the typical LHLHa pattern.
The different intonational structures between the two languages also contribute to the extent of using pitch modulation, one of nonphonological intonational elements. In English, pitch range substantially contributes to determining the degree of the valence (positive vs. negative) of utterances when other syntactic and semantic features of the utterances coincide (Murray & Arnott, Reference Murray and Arnott1993; Protopapas & Lieberman, Reference Protopapas and Lieberman1997; Scherer, Reference Scherer2003). For instance, if the sentence, “it’s good,” is spoken with a wider pitch range keeping the other syntactic features and intonation pattern identical, the utterance with a wider pitch fluctuation is likely to be perceived as amplifying the positive meaning. The role of pitch modulations, however, places relatively less significance on the communication of the degree of valence in Korean because the intonational structure of a Korean utterance tends to follow an existing pattern according to the number of words in a phrase. If the same expression of “it’s good” was spoken in Korean (as a response to “how’s the food?”), 맛있어’ (“Ma Si Suh”), the speaker is less likely to use inflections to highlight the good taste. The Korean speaker would instead lengthen or impose a stronger intensity on each syllable while keeping a similar pitch level range. Because of the rather neutral and monotonous intonations, Korean learners of English may come across as “insincere” when communicating with L1 users of English. At times, Korean learners also misinterpret intentional cues (e.g., sarcasm) conveyed in their interlocutor’s intonations.
The acoustic correlate of pitch, the fundamental frequency (F0 ), is measured in hertz (Hz). F0 , the lowest frequency of a periodic sound waveform of a speaker, is a physical manifestation of pitch. A higher F0 with more inflections is likely to signal high energy positiveness whereas an intonation with a lower F0 and fewer inflections signals boredom and negativeness (e.g., Johnston & Scherer, Reference Johnstone and Scherer1999; Weger et al., Reference Weger, Meier, Robinson and Inhoff2007) in English. The modulations of F0 in Korean, however, have a limited influence on the positive or negative cues (Kim et al., Reference Kim, Yu, Hong and Lee2007).
Currently, there is a growing interest in the acoustic characteristics of emotional speech (e.g., Ish & Kanda, Reference Ishi and Kanda2019; Min & Schirmer, Reference Min and Schirmer2011; Wang et al., Reference Wang, Lee and Ma2018) and the perception of emotions by L1 and LX usersFootnote 1 (Dewaele et al., Reference Dewaele, Lorette, Petrides, Juez and Mackenzie2019; Lorette & Dewaele, Reference Lorette and Dewaele2015, Reference Lorette and Dewaele2020). This is partly because using a language for communicating emotions is not only essential but also unique to human communication. The challenges of emotional intonation studies, however, lie in the complexity of emotion and intonation. It is difficult to compartmentalize the effects of individual phonological and phonetic elements from the synchronous interplay. One way to understand these multifaceted constructs is through a dimensional approach, which segmentalizes the main constructs into key constituents to understand the overall phenomenon. According to a two-dimensional model of emotion (e.g., Russell, Reference Russell2003), emotion can be defined as the integration of valence (positive vs. negative) and intensity/arousal (weak vs. strong) vectors. The dimensional framework views that a specific emotion, such as anger and happiness, is a manifestation of the different degree of the two factors. In addition, as mentioned earlier, intonation can be understood in terms of phonological and nonphonological elements. The investigation of the role of pitch modulations in the perception of the valence aspect, therefore, can contribute to understanding the perception of spoken emotional messages.
THE VERBAL CHANNEL: EMOTION WORDS
Some studies have investigated whether bilinguals’ perception of language emotionality differ in their L1 and the LX (e.g., Dewaele, Reference Dewaele2013; Dewaele et al., Reference Dewaele, Lorette, Rolland and Mavrou2021; Pavlenko, Reference Pavlenko2005, Reference Pavlenko2012). These studies used an introspective method such as questionnaires and interviews. For instance, a large-scale online survey was administered to examine the factors contributing to multilinguals’ language preference in expressing emotions (Dewaele, Reference Dewaele2013; Dewaele & Salomidou, Reference Dewaele and Salomidou2017). According to the results language dominance, age of onset of acquisition, context of acquisition, and order of acquisition were significantly related to their choice of language in using emotion words. Specifically, languages used less frequently, acquired later and in more formal settings typically have weaker emotional intensity. Multilinguals may experience emotional “detachment” in their LX (Marcos, Reference Marcos1976; Pavlenko, Reference Pavlenko2012).
Generally, stronger emotionality in the L1 was observed in emotional expression of anger (Dewaele, Reference Dewaele and Pavlenko2006), in swear words (Dewaele, Reference Dewaele2004, Reference Dewaele2016), and words expressing affect (Dewaele, Reference Dewaele2008, Reference Dewaele2018a). Pavlenko (Reference Pavlenko2012) argues that the L1 elicits higher levels of emotional intensity than the language learned later because childhood experiences imprint stronger emotional scripts on our minds that contribute to a stronger embodiment of the L1. Interestingly, however, the results of the study by Dewaele (Reference Dewaele2016) contradicted the general stronger emotionality found in the L1, showing that LX users estimated the degree of offensiveness of English offensive words more strongly than did L1 users, with the exception of the word “cunt” (Dewaele, Reference Dewaele2018d). It was, however, speculated that the result was due to the fact that most LX users might have received cautionary advice about the use of English offensive words in a formal classroom setting. It is, therefore, not clear whether the stronger self-reported offensiveness from LX users indicates LX users’ actual emotionality or their instructed “perception” of English offensive words. In other words, it is possible that LX users simply evaluated the English offensive words in the list as highly “inappropriate” without experiencing emotional resonance.
The differences in the semantic representations of emotion words were also studied amongst three different types of English L1 users (Dewaele, Reference Dewaele2018b). The three groups of Americans living in the United States, in the United Kingdom, and in non-English-speaking countries participated in an online survey about the perceived offensiveness of four offensive words of American origin and another four of British origin. The study showed that the British offensive words were less stable in Americans’ mental lexicon and more susceptible to change after exposure to other varieties of English. The Americans who lived in the United States perceived the four British words as less offensive than did the two groups who did not live in the United States. Therefore, the study suggests that the semantic representations of the L1 emotion words that originated from another variety are likely to change when L1 users live in a language environment where the other varieties are more frequently used.
The findings gained from these studies support the view that emotion words are represented and processed differently and that their emotional resonance is very different in the L1 or LX of individuals.
THE VOCAL CHANNEL: EMOTIONAL SPEECH
Speakers’ emotional states markedly impact on how they sound. The emotion that the speaker experiences, influences on modulations of prosodic and phonation cues (Brosch et al., Reference Brosch, Pourtois and Sander2010; Hellbernd & Sammler, Reference Hellbernd and Sammler2016; Murray & Arnott, Reference Murray and Arnott1993; Scherer, Reference Scherer2003), such as voice quality (e.g., Gobl & Ní Chasaide, Reference Gobl and Ní Chasaide2003), utterance duration and intensity (Juslin & Laukka, Reference Juslin and Laukka2003; Juslin & Scherer, Reference Juslin, Scherer, Harrigan, Rosenthal and Scherer2005), and pitch levels and contours (Bachorowski & Owren, Reference Bachorowski and Owren1995; Pell, Reference Pell2001; Pell et al., Reference Pell, Paulmann, Dara, Alasseri and Kotzb2009; Rodero, Reference Rodero2011). Emotional speech researchers adopt different theoretical models of emotional speech types. Some emotional speech studies examine the acoustic characteristics of specific emotional speech types (e.g., Grandjean et al., Reference Grandjean, Bänziger and Scherer2006) while others investigate the valence and intensity (or arousal) aspects of emotional speech (e.g., Johnstone et al., Reference Johnstone, van Reekum, Hird, Kirsner and Scherer2005). Despite the different theoretical views, results of emotional speech studies generally support that acoustically identifiable regularities are observed in emotional speech.
The acoustic regularities allow us to investigate the perception of emotional speech because we could assume that listeners, due to systematic differences interpret and identify emotional utterances differently from neutral utterances. Although there has been much debate about which specific acoustic features most contribute to the perception of emotion, three acoustic correlates—voice quality (e.g., Ishi & Kanda, Reference Ishi and Kanda2019), pitch levels (e.g., Patterson & Ladd, Reference Patterson and Ladd1999), and intonation contour (e.g., Protopapas & Lieberman, Reference Protopapas and Lieberman1997)—are frequently and persistently recognized as the factors most contributing to the systematic differences of emotional speech. For instance, voice tends to have a wider range of F0 with a higher Max F0 and more contour fluctuations when positive emotions rather than boredom are felt (Johnston & Scherer, Reference Johnstone and Scherer1999; Weger et al., Reference Weger, Meier, Robinson and Inhoff2007). Voice quality tends to become tenser and harsher when speakers are angry compared to those loudly speaking to someone far away (Ish & Kanda, Reference Ishi and Kanda2019).
Of the three features, voice quality refers to an intravocal characteristic or “voice color” such as “breathy” or “soft” that differs across individuals. The judgment of voice quality is more susceptible to listeners’ internal systems and preferences. Vocal quality also comprises an intricate array of multiple factors such as phoneme sequence, energy distribution, pitch contour, and utterance duration (Ish & Kanda, Reference Ishi and Kanda2019). The measurement of voice quality, therefore, faces more technical elaboration due to its multidimensionality. Furthermore, when conducting systematic comparisons among those from different linguistic backgrounds, measuring voice quality characteristics is even more difficult. However, the fact that emotions are still delivered in speech communication despite the idiosyncratic voice quality of each speaker gives evidence for certain intervocal “regularity” in emotional speech (Buck, Reference Buck1984, p. 15). In particular, the overall effect of intonation contour and pitch levels in emotional speech has been recognized in many studies (Bulut & Narayanan, Reference Bulut and Narayanan2008; Johnston & Scherer, Reference Johnstone and Scherer1999; Ladd, Reference Ladd1996; Patterson & Ladd, Reference Patterson and Ladd1999; Protopapas & Lieberman, Reference Protopapas and Lieberman1997).
Intonation contours refer to the overall shape of pitch movements. Different scholars have suggested theoretical models of intonation and these models generally focus on the sequence of “up-and-down” of tone. The autosegmental-matrical model (Pierrehumbert, Reference Pierrehumbert1980), for instance, provides a bitonal (High and Low) convention to analyze intonation contours.
The Rise and Fall Connection (RFC) model (Taylor, Reference Taylor1994) also describes the movement of the rise and fall of intonation. In these models, intonation contour is a relative concept, meaning it does not set an absolute pitch level as the threshold to determine a high or a low. Rather, it is compared to the pitch level of the previous unit. For instance, speakers can say the sentence, “she’s happy” using the same contour of LH*L but a different pitch level.
The overall shape of intonation contour is also tightly related to the focus location of an utterance. The understanding of intonation contours requires the analysis of pitch levels because these two parameters work in tandem. The pitch accent or focus delivers the key part of information; thus, speakers tend to distinguish pitch levels to either highlight or contrast the focus information (Tonhauser, Reference Tonhauser, Cummins and Katsos2019). The influence of emotion on focus location has also been acknowledged in emotional speech (e.g., Pell, Reference Pell2001). The study asked five participants to speak two short (e.g., Mary sold the teapot) and two long (e.g., Mary sold the teapot for a dollar) utterances while expressing different emotions (e.g., happy and sad). The results showed that happy contours displayed a higher end point pitch than sad contours. Similarly, other studies (e.g., Johnston & Scherer, Reference Johnstone and Scherer1999; Weger et al., Reference Weger, Meier, Robinson and Inhoff2007) have also shown that positive emotional speech tends to have more inflections with a higher pitch while negative emotional utterances are likely to use fewer inflections with a lower pitch. Protopapas and Lieberman (Reference Protopapas and Lieberman1997) also argue that the maximum F0 along with the range of F0 contribute to the perception of emotional stress the most.
The majority of emotional speech studies, however, generally investigate the role of emotional intonation in the context of first language use. Only recently, emotional intonation in the context of communication between L1 users and LX users has been investigated due to its communicative value in interactions. These studies apply different methods, such as acoustic analysis (e.g., Graham & Post, Reference Graham and Post2018; Verdugo, Reference Verdugo2005; Wang et al., Reference Wang, Lee and Ma2018; Wennerstorm, Reference Wennerstorm2001), psycholinguistic tasks (e.g., Kitayama & Ishii, Reference Kitayama and Ishii2002; Pell & Skorup, Reference Pell and Skorup2008), or perception-judgment tasks (e.g., Graham et al., Reference Graham, Hamblin and Feldstein2001; Min & Schirmer, Reference Min and Schirmer2011) to investigate the different aspects of emotional speech.
The studies can also be categorized into perception and production studies in terms of the direction of the speech process of emotional intonation. The production studies usually focus on the different patterns of the acoustic features between L1 and LX groups. For instance, Graham and Post (Reference Graham and Post2018) studied whether Spanish and Japanese L2 users of English demonstrated different patterns of high pitch location (H*) compared to American L1 users of English. This study divided each L2 group (Spanish and Japanese) into two different proficiency levels (Basic vs. Advanced). The study used a total of 32 dialogue structure test items to elicit target answers demonstrating varying stress patterns (e.g., Experimenter: What is Melanie looking for? [Picture shown]; Participant: She’s looking for a MONkey). Ten Spanish and another 10 Japanese L2 users of English and 5 American L1 English speakers participated in the task. The acoustic analysis of the recordings showed that the high pitch alignment of Spanish L2 users of English was more consistent with American L1 users of English than Japanese L2 users of English. This might be due to a closer typological proximity between Spanish and English. Advanced English learners were likely to place an L1 speakerlike pitch location, indicating that targetlike contour patterns emerge as proficiency advances. However, Wennerstorm (Reference Wennerstorm2001) examined if heightened pitch is related to evaluative language in L1 users of English and Japanese learners of English. Six L1 English and six L2 Japanese users of English were asked to tell an emotionally charged story (e.g., embarrassing mistake) and their stories were taped for acoustic analysis. Each word in the recorded responses was categorized by narrative components. The narrative component categories of the highest pitched 10% of the words and the top three highest-pitched words were identified. The results showed that 60% of the highest 10% pitched words were linked to evaluative emphasis in both groups. Sixty-seven percent and 79% of the three highest pitched words were also categorized as evaluations for L1 users and Japanese L2 users of English, respectively. Wennerstorm (Reference Wennerstorm2001) argues that the use of emotional intonation utilizing heightened pitch is universal and not language specific. However, the study did not compare any of the acoustic parameters of the narratives spoken by the two groups. It only associated the highest pitched words with the evaluative narrative category. The argument, therefore, posits a rather simplistic theoretical view of the structure of emotional intonation.
However, perception research is much more interested in how L1 and LX users perceive emotional intonation differently. According to the results of the perception studies, both L1 and LX users integrate verbal and vocal emotion cues in their perception (e.g., Min & Schirmer, Reference Min and Schirmer2011). Research suggests that LX users of English, however, experience difficulty in recognizing emotional contents expressed through L1 users’ intonation (e.g., Graham et al., Reference Graham, Hamblin and Feldstein2001; Verdugo, Reference Verdugo2005). Studies by Lorette and Dewaele (Reference Lorette and Dewaele2015, Reference Lorette and Dewaele2020) have shown that English LX users had significantly more difficulty than English L1 users in accurately identifying emotions in audio-only recordings of an actress displaying six emotions. This difference disappeared when the LX users watched the audio-visual version of the same stimuli. This suggests that LX users need the assistance of visual information to complement vocal and verbal channels to overcome a deficit in recognizing emotional intonation contours and prosody. A study by Mavrou and Dewaele (Reference Mavrou and Dewaele2020) found that Spanish LX users tended to provide higher ratings of emotionality and pleasantness of audiovisual stimuli displaying complex emotions than Spanish L1 users. L1 users seemed to rely more on parallel channels to judge emotionality that LX users.
Drawing on support from these results and theoretical underpinnings, the present study adopted a dimensional approach to emotional speech. The study investigated whether pitch modulations measured by F0 influence the two different linguistic groups’ (American vs. Korean L2 users of English) perception of the degree of valence in emotional utterances.
RESEARCH QUESTIONS
-
1. Do pitch modulations contribute to the recognition of semantic meaning and intonation type congruency for English emotional utterances by American L1 users of English and Korean L2 users of English?
-
2. Do the congruency (congruent vs. incongruent) and valence (positive vs. negative) types of English emotional utterances influence American participants and Korean EFL participants’ performance in the congruency task?
-
3. How do the Korean EFL students’ perceptions of English emotional utterances differ from those of Americans participants when the utterances were modulated by pitch levels?
METHOD
PARTICIPANTS
The present study compared the task results of the two groups (Korean EFL vs. American). For the Korean group, 49 EFL undergraduates (23 males, 26 female) participated in the experiment. They all spoke the Gyeonggi dialect, which is considered as standard Korean language, according to the Language History background survey (Li et al., Reference Li, Zhang, Tsai and Puls2013). Korean students’ average age was 22 and they had studied English for an average of 14 years (see Table 1). The Korean participants represented typical university students who spent, on average, more than 10 years studying English, often beginning English lessons in public schools at about 9 or 10 years of age. Korean participants who lived or studied in an English-speaking environment longer than 3 months were excluded.
Descriptive statistics of Korean participants’ background information

In addition, recruiting students whose English proficiency is higher than intermediate level was important to preclude or minimize the influence of another extraneous variable, the lack of semantic understanding. Korean participants were considered advanced English learners with a relatively high mean TOEIC score of 842 (see Table 1). The current study intended to examine Korean students’ difficulties in perceiving the type of English intonation modulated by pitch variations despite their understanding of the semantic meaning of the presented utterances. In addition, past research asserts that proficiency level is strongly linked to emotional speech perception in a second language and that higher-level LX users tend to do better at perceiving emotions in English (Lorette & Dewaele, Reference Lorette and Dewaele2015, Reference Lorette and Dewaele2020; Rintell, Reference Rintell1984). Therefore, recruiting Korean participants with similar proficiencies was important to control for this effect.
Concerning the American group, 49 undergraduates participated in this study (37 females, 12 males). The mean age of American perception participants was 20 (SD = 2). Forty-four of them had never learned a second language. Five of them had experience in taking a foreign language course, but they could only understand and speak few minimal phrases in the language. Their language perception skills, therefore, were likely to be unaffected by experiences of learning another language. In addition, the following presents the distribution of the home states of the participants: Connecticut (3), Massachusetts (1), Maryland (1), Maine (1), New Hampshire (1), New Jersey (3), New York (3), Oklahoma (1), Pennsylvania (1), Rhode Island (31), and Utah (1).
None of the Korean or American participants had any difficulties hearing or reading. In addition, to establish construct validity, ensuring that the participants’ emotional instability or abnormal conditions did not influence their performance of judging on the congruency between the semantic meaning and the intonation type, all participants were asked to take the Beck Depression Inventory II (Beck et al., Reference Beck, Steer and Brown1996). The average Beck score of both Korean (M = 7, SD = 4.2) and American (M = 9, SD = 6.2) participants was low, and the mean difference of the Beck score was not statistically significant: t (96) = 1.86, p = 0.06. None of American students received a Beck score higher than 25, which indicates that their responses were likely reflect to normal judgment.
MATERIALS: EMOTIONAL SENTENCE
This study aimed to measure the actual use of emotional intonation and not the internal process of using emotional intonation. Thus, sentence-level items, albeit manipulated, were created for the perception task. To create a declarative sentence with the selected emotion words, each emotion word received one subject word, “She,” and a matching copular verb, “is,” to form a sentence structure with minimal extra contextual information. Restricted contextual information was also required because participant responses should primarily come from a mixture of verbal channel (emotion words) and vocal channel (emotional intonation) inputs, not from other substantial contextual information. The third-person singular subject was chosen because the use of a first-person subject, such as “I” or “We,” self-praising or self-deprecating utterances (e.g., “I am adorable” or “we are useless”) can provoke negative responses in both cases. This is highly plausible in Korean culture where “humility” rather than “confidence” is preferred. Self-praise is considered extremely inappropriate. Thus, sentences such as “I am confident,” “I am brave,” or “I am kind” for example, can incite a “negative” reaction regardless of the different patterns of intonation. In addition, self-deprecating utterances (e.g., “I am useless”) can also incite stronger negative reactions than the sentences expressing emotional states (e.g., “I am angry”). The plural subject “they” was also eliminated for the sake of conceptual simplicity.
The present study defined “emotion” in terms of two domains: valence (positive vs. negative) and intensity (weak vs. strong) (Russell, Reference Russell2003). The study initially selected emotion words from the Affective Norms for English Words (ANEW) data (Bradley & Lang, Reference Bradley and Lang2010). The present study focused on the valence domain by controlling the intensity rating variable. For both positive and negative words, the mean intensity ratings are manipulated as 5.91 and 5.4, respectively, on a 9-point scale (1: very weak, 9: very strong). For the initial selection, 53 words (positive: 18; negative: 18; neutral: 17) were chosen from the ANEW (Bradley & Lang, Reference Bradley and Lang2010) as American speakers’ baseline rating data. The average of the valence ratings of the positive words is 7.9 and that of the negative words is 2.3 on a 9-point rating scale (1: very negative; 5: neutral; 9: very positive). Each set of positive, negative, and neutral words was controlled for word length and frequency. The present study used log Hyperspace Analogue to Language (HAL) frequency data, which is a statistical model based on word co-occurrence frequency. According to one-way ANOVA, the mean difference of Log HAL frequencies of the selected positive (M = 8.9, SD = 1.4), negative (M = 8.8, SD = 1.2), and neutral words (M = 9.6, SD = 1.8) were not statistically significant (F(2, 39) = 1.062, p = 0.3).
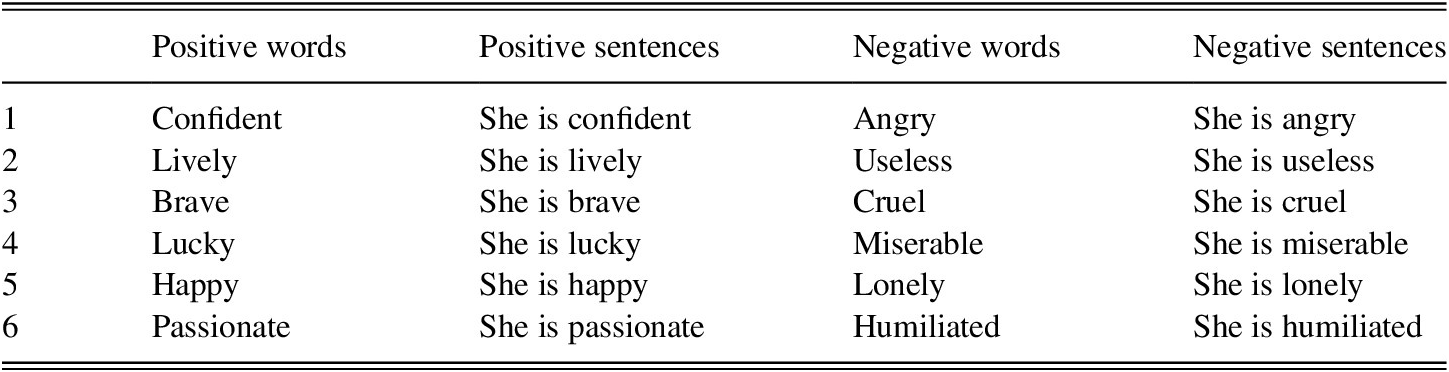
These 53 words were used to create a survey for Korean participants using the same format as the ANEW to finalize the words displaying a similar rating value between the American and Korean groups. This process was important because the congruency task aimed to investigate different patterns in perceiving English intonation between the Korean and American groups despite a similar degree of emotional reaction to the presented emotional sentences. According to the analysis of the ANEW (American rating data) and the emotion word survey (Korean rating data), a total of 12 words were selected (positive: 6; negative: 6) for creating emotional sentences (see Table 2). The selected positive and negative words served as the predicate adjective of the emotional sentences starting with “She is” (e.g., She is angry).
Selected emotional words and sentences

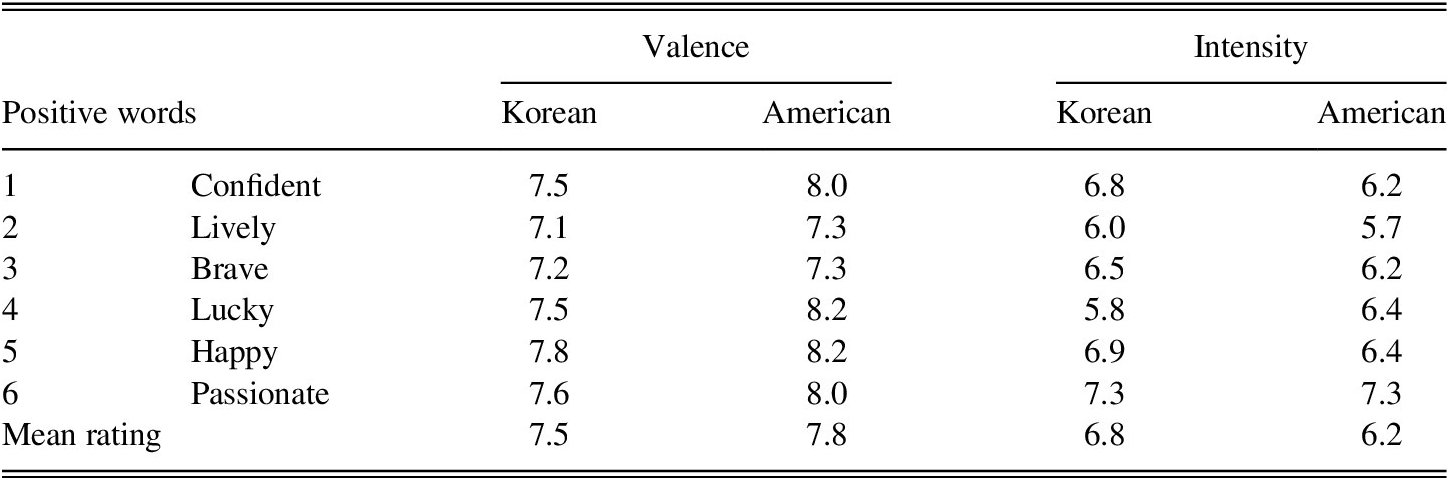
In terms of the six positive words (see Table 3), an independent-samples t-test indicates that the mean difference between Korean (M = 7.5, SD = 0.3) and American (M = 7.8, SD = 0.4) participants on the valence rating was not significant: t (96) = 1.9, p = 0.08. The group difference between Korean (M = 6.8, SD = 0.6) and American (M = 6.2, SD = 0.5) participants in the intensity rating of the six positive words was also not statistically significant: t (96) = 0.67, p = 0.6. The Korean participants also provided a clear, translation-equivalent definition in the survey, showing their semantic understanding of the words. Therefore, the words were valid to use for the production and perception tasks.
The mean valence and intensity rating of the selected positive words

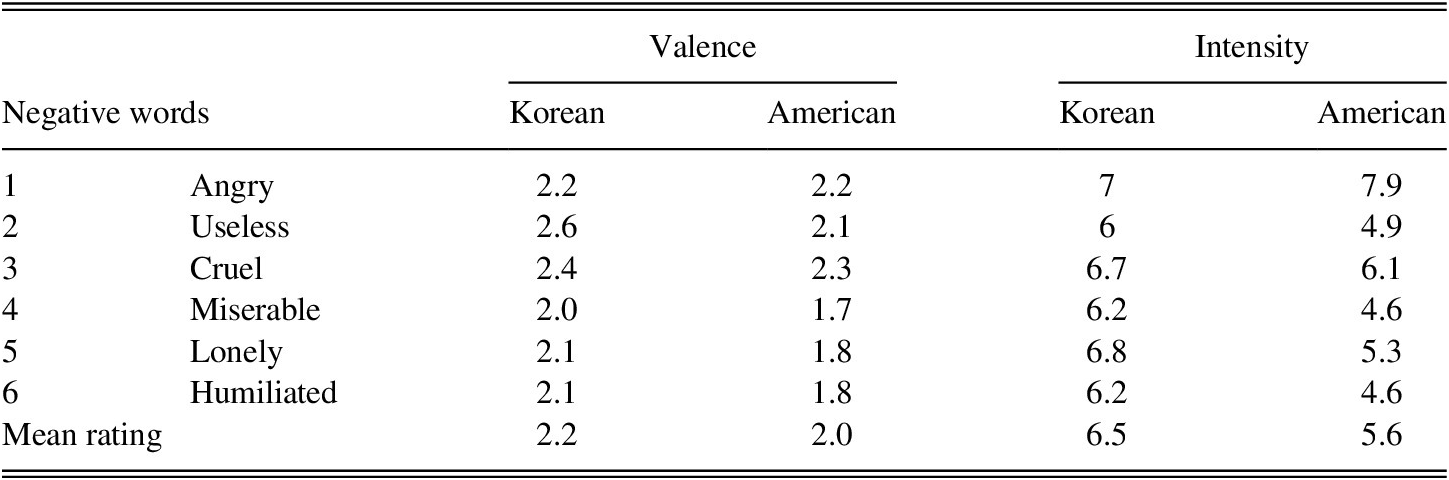
The Korean participants also provided a clear definition for the six negative words (see Table 4) in the survey. An independent-samples t-test indicated that the difference between Korean (M = 2.2, SD = 0.22) and American (M = 2.0, SD = 0.24) participants was not statistically significant: t (96) = 1.82, p = 0.09. The intensity rating difference of the six negative words between Korean (M = 6.5, SD = 0.4) and American (M = 5.6, SD = 1.3) participants was also not statistically significant: t (96) = 1. 68, p = 0.14.
The mean valence and intensity rating of the selected negative words

MATERIAL: THE CONGRUENCY TASK AUDIO FILES
The study aimed to investigate the perception of valence by using actual speech samples rather than synthetic sound files. The study, therefore, selected the sound files representing similar acoustic characteristics other than pitch variations. The acoustic parameters of the sound files were analyzed using Praat software (Boersma & Weenink, Reference Boersma and Weenink2019). Initially, a total of 24 congruency task items (12 positive sentence items and 12 negative sentence items) were selected from 1,200 utterances spoken by 50 American participants (Cho, Reference Cho2018). The 24 sound files were controlled for three conditions: (1) congruency (congruent vs. incongruent), (2) the valence of the semantic meaning (positive vs. negative), and (3) the speaker’s gender (male vs. female). Three utterances had the same conditions out of the 24 files (e.g., three positive incongruent utterances spoken by a male speaker; three negative congruent utterances spoken by a female speaker).
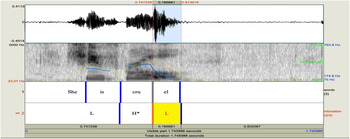
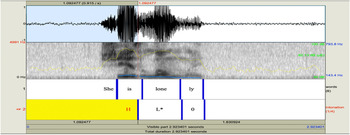
The task item selection processes were: (1) selecting the sound files without noise, (2) selecting the sound files showing the typical intonation contour, (3) controlling for acoustic parameters (intensity, and duration, and voice quality), and (4) selecting sound files demonstrating intended positive and negative pitch patterns. First, the audio files with unwanted acoustic qualities such as background noise were excluded. After the initial selection, the sound files demonstrating a typical positive (LH*L) and negative intonation (HL*0) contour were selected (see Figures 2 and 3). Amongst the 50 American participants, 70% of them followed the LH*L pattern when produced the positive utterances and 94% of the speakers used the HL*0 pattern for the negative for the negative utterances on average (Cho, Reference Cho2018). The LH*L and HL0 patterns were, therefore, considered to represent the general positive and negative intonation contour types of American participants.
An example of the LH*L positive intonation (“She’s cruel”).

An example of the HL*0 intonation (“She’s lonely”).

For the third step, three acoustic parameters, namely intensity, duration, and voice quality, were controlled to investigate the role of pitch variations in the perception of emotional utterances. Generally, American participants spoke the emotional utterances with one parsing (e.g., she’s/ happy); thus, the intensity and duration of the subject and predicate, “She’s”, and the adjective part (e.g., “happy”) were separately measured. The sound files with relatively minimal difference in the maximum and minimum intensity and duration were selected (see Table 5).
The mean and SD of the acoustic parameters

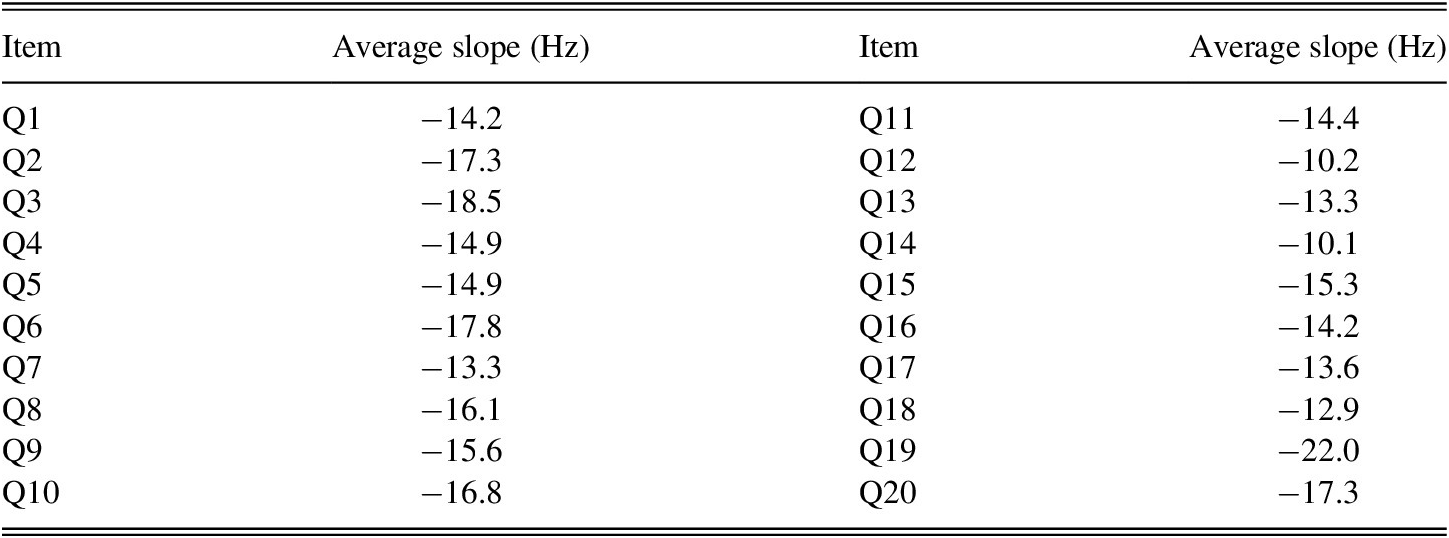
Voice quality was measured using a long-term average spectrum (LTAS) analysis (see Boersma & Kovacic, Reference Boersma and Kovacic2006), which calculates the average acoustic energy distribution between a low and a high point. Four (the congruent and incongruent case of “She’s humiliated” and “She’s passionate”) out of the initial 24 utterances were discarded due to significantly different value of the voice quality measure. As shown in Table 6, the remaining 20 files had a similar range of voice quality.
LTAS voice quality measure of each congruency task item

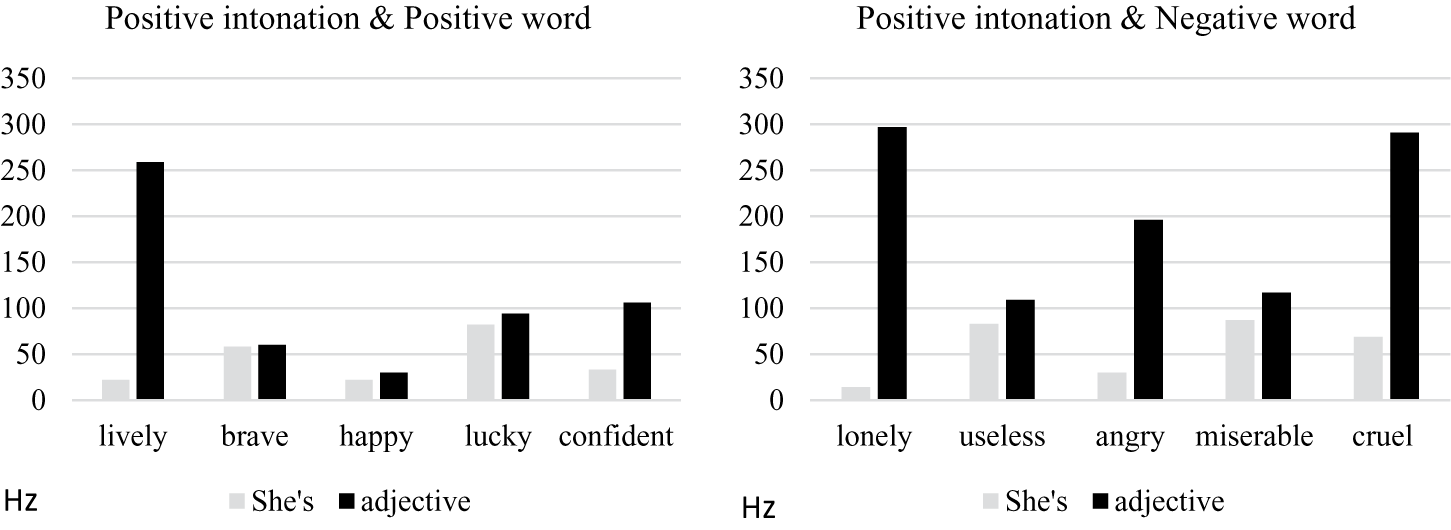
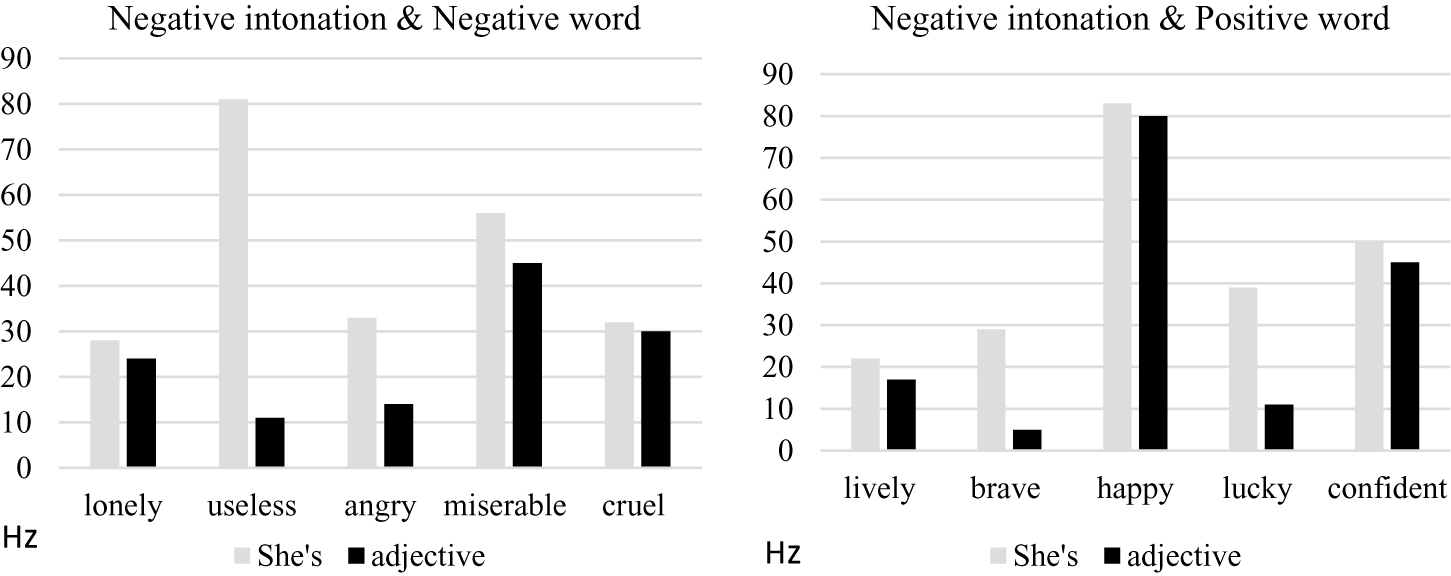
The final step involved choosing the audio files demonstrating the characteristics of positive and negative intonation. Studies of English show that a positive intonation is associated with having a higher F0 mean and a larger F0 range whereas a negative intonation tends to have a lower F0 mean and a narrower F0 range (e.g., Bulut & Narayanan, Reference Bulut and Narayanan2008). The study aimed to use actual speech samples from different speakers rather than using synthetic sounds with the identical acoustic parameters. The study, therefore, selected the sound files with a similar pitch patten rather than with the identical pitch parameters. For the 10 positive intonation items, the main adjective part of the utterance had a wider F0 range with a higher max F0 (see Figure 4).
The F0 range of the 10 positive intonation items.

The 10 negative sentences that were characterized by a lower max F0 and a smaller F0 range were chosen (see Figure 5). The female speakers tended to have a higher max F0 and a larger F0 range than the male students with both positive and negative intonation. All selected utterance samples, however, followed the same pattern.
The F0 range of the 10 negative intonation items.

PROCEDURES
Participants received verbal instructions prior to performing the tasks. They also listened to four practice sound files prior to the main congruency task. Each emotional utterance item was played twice with the same interval between each individual sentence. Participants were given 10 seconds for marking the congruency and providing an adjective descriptor. Korean participants were asked to write the definition of each highlighted adjective in the task sheet before performing the tasks. For the congruency task, participants marked the answer sheet using a dichotomous (congruent/incongruent) scale. They were also asked to provide an adjective describing the tone of each utterance immediately after having marked its congruency.
ANALYSIS
To answer RQ1 (Do pitch modulations contribute to the recognition of semantic meaning and intonation type congruency for English emotional utterances by American L1 users of English and Korean L2 users of English?) a series of independent-samples t-tests were carried out using the statistical package R (RStudio Team, 2020) to compare the emotional rating results of the Korean and American groups. Although some rating data were skewed, and variances were not homogenous, independent-sample t-tests were used because the sample size of the current study was large enough to be robust to violations of the assumptions. Due to the Central Limit Theorem (CLT) (Durrett, Reference Durrett2004), when a sample is larger than 30, it is valid to use t-tests even when a set of data violates the assumptions.
To answer RQ 2 (Do the congruency (congruent vs. incongruent) and valence (positive vs. negative) types of English emotional utterances influence American participants and Korean EFL participants’ performance in the congruency task?) Mann–Whitney U tests and Kruskal–Wallis H tests were used because the distribution of the percentage scores violated the normality and homogeneity. In this case, the log and square root transformations were insufficient to improve the violations. The two nonparametric tests therefore were selected.
It is also noted that although each task answer was binary (right or wrong), logistic regression was not chosen because a composite percentage score of the right answers out of the 20 items, a ratio variable, was calculated for analysis, not the binary result of each item.
To answer RQ3 (How do the Korean EFL students’ perceptions of English emotional utterances differ from those of Americans participants when the utterances were modulated by pitch levels?), the responses of the adjective task were categorized into similar types for frequency analysis. The responses to the congruent utterances were categorized into three different types: (1) Congruent/Authentic, (2) Neutral/Ambiguous, and (3) Incongruent/Unnatural. Congruent or Incongruent type responses refer to the adjectives that agree or disagree with the category of the utterances. For instance, for the positive congruent sentence, “she is lucky” in a positive tone, the adjective response, “upbeat” is considered as a congruent type whereas the descriptor, “depressing” is considered as incongruent. To compare the percentage of each response category between the American and Korean groups, the frequencies of the adjective responses were calculated. The Congruent and Authentic response types were treated as one category because both categories imply agreement between the positive meaning and intonation.
The adjective responses to the incongruent sentences were categorized differently from the congruent sentences; they were initially grouped into four different categories: (1) Interaction, (2) Intonation, (3) Neutral/Ambiguous, and (4) Semantic Meaning. The adjectives describing interactional aspects such as “sarcastic” were labeled under the “Interaction” Category. The adjectives implying the inconsistency between the type of intonation and semantic meaning, such as “fake” were initially classified under the “Unnatural” category. For the frequency analysis, the Unnatural Category was merged under the Interaction category because the unnaturalness entails the interaction between the contradicting intonation and semantic meaning of the incongruent sentences. The adjectives describing one aspect of the two linguistic properties (intonation or semantic meaning) were labeled following the corresponding aspect.
RESULTS
RQ 1: DO PITCH MODULATIONS CONTRIBUTE TO THE RECOGNITION OF SEMANTIC MEANING AND INTONATION TYPE CONGRUENCY FOR ENGLISH EMOTIONAL UTTERANCES BY AMERICAN L1 USERS OF ENGLISH AND KOREAN L2 USERS OF ENGLISH?
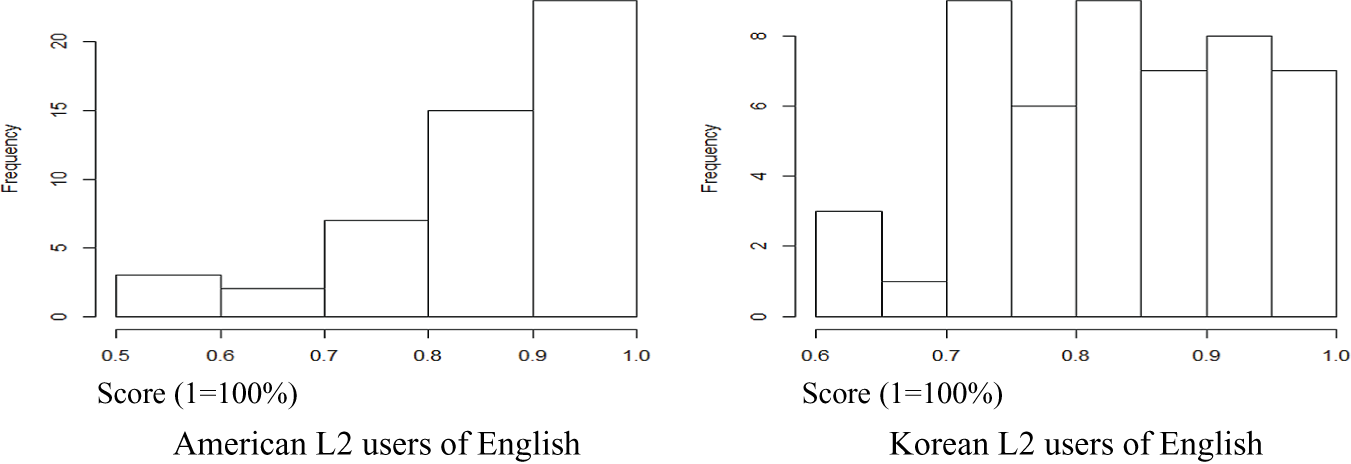
Both groups achieved a relatively higher mean score. The Korean group (M = 88%, SD = 10%) obtained a higher mean than the American group (M = 85%, SD = 11%). The difference, however, was not statistically significant (t (98) = 1.42, p = 0.16). Figure 6 shows that the mean congruency task score distribution of the American group was negatively skewed, indicating that the American group had a greater number of participants who achieved a higher score than 80% than did the Korean group.
Histogram of the congruency task mean score.

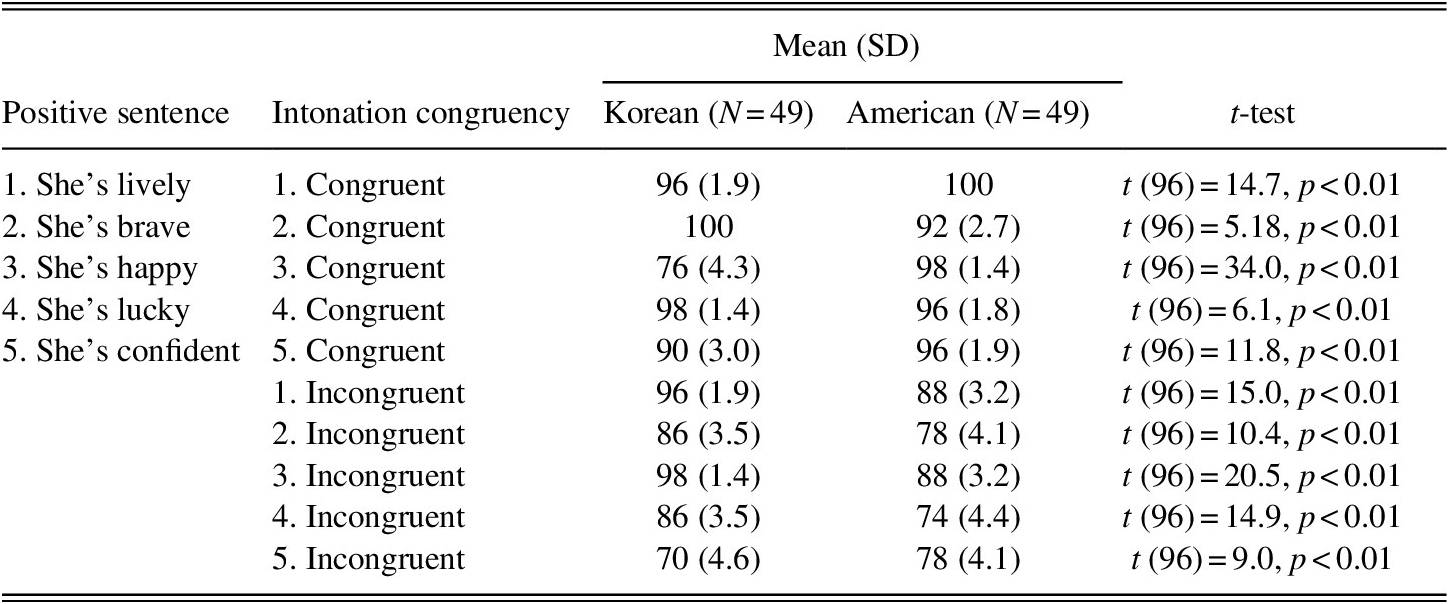
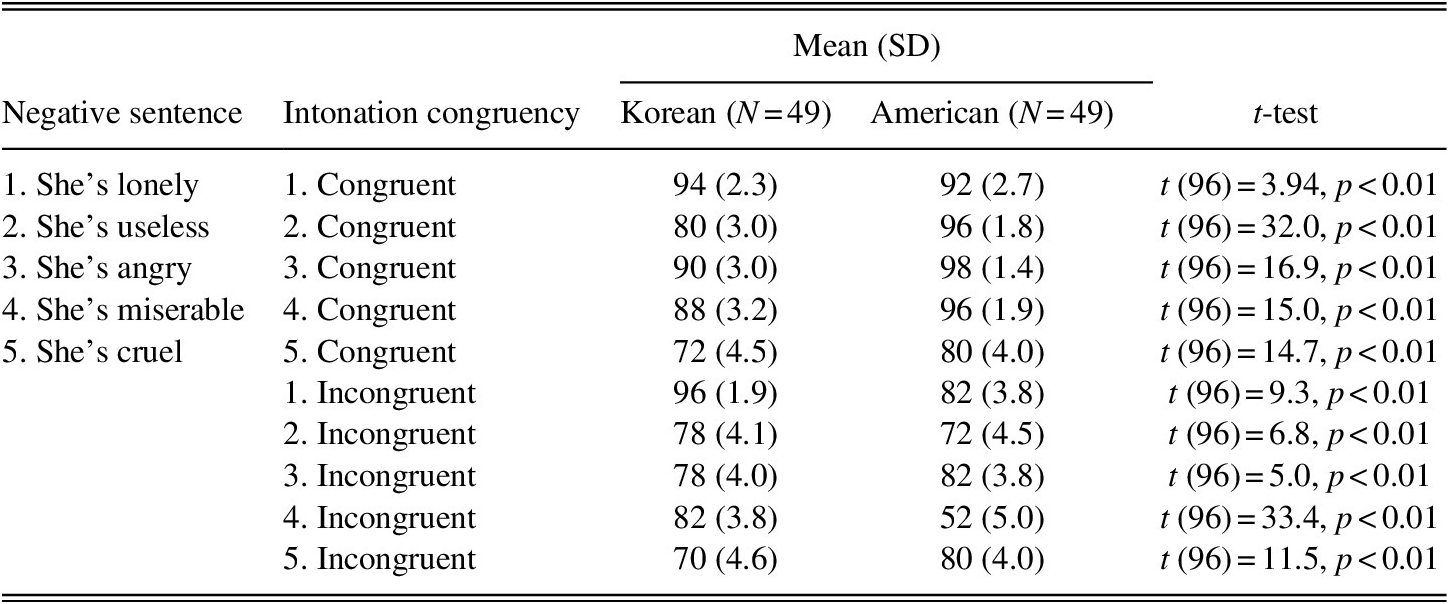
Tables 7 and 8 summarize the descriptive statistics of each task item percentage score. The item obtained the highest correct answer percentage for the Korean group was the utterance of “she’s brave” with a congruent positive intonation (M = 100). The two items received the lowest mean score were both incongruent items for the Korean group (“she’s confident” with a negative intonation (M = 70, SD = 4.6); “she’s cruel” with a positive intonation (M = 70, SD = 4.6). For the American group, the congruent item, the utterance of “she’s lively” with a positive intonation obtained the highest score (M = 100) whereas the incongruent utterance of “she’s miserable” with a positive intonation received the lowest score (M = 52, SD = 5.0). The mean difference between the two groups for all 20 items was statistically significant according to t-tests.
The descriptive statistics of the positive items

The descriptive statistics of the negative items

RQ 2: DO THE CONGRUENCY (CONGRUENT VS. INCONGRUENT) AND VALENCE (POSITIVE VS. NEGATIVE) TYPES OF ENGLISH EMOTIONAL UTTERANCES INFLUENCE AMERICAN L1 USERS OF ENGLISH AND KOREAN EFL PARTICIPANTS’ PERFORMANCE IN THE CONGRUENCY TASK?
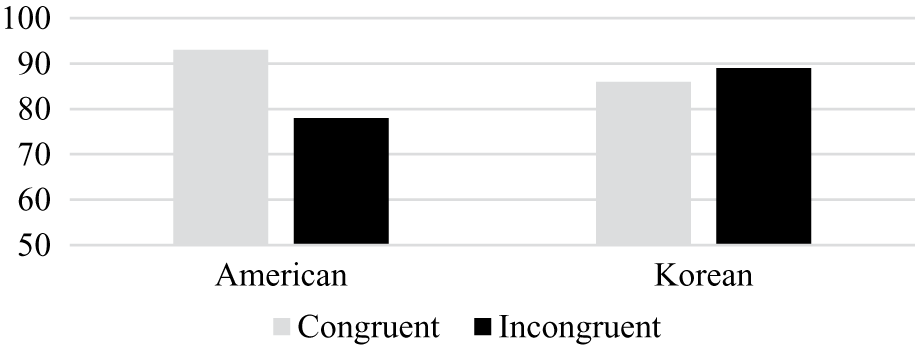
To investigate the influence of congruency on participants’ performance, the scores of the congruent and incongruent items were compared. For Korean participants, the Mann–Whitney U test revealed that the scores of the congruent utterances (M = 86; Mdn = 80) were not significantly higher than those of the incongruent utterances (M = 89; Mdn = 100): U = 4602, nc = ni = 49, p = 0.3. However, for American participants (see Figure 7), the scores of the congruent utterances (M = 93; Mdn = 100) were significantly higher than those of the incongruent utterances (M = 78; Mdn = 80):U = 602.5, nc = ni = 49, p < 0.001. These results indicate that the congruency factor did not significantly influence Korean students’ performance while the factor affected American students’ performance on the task.
The mean task percentage score of congruent versus incongruent items.

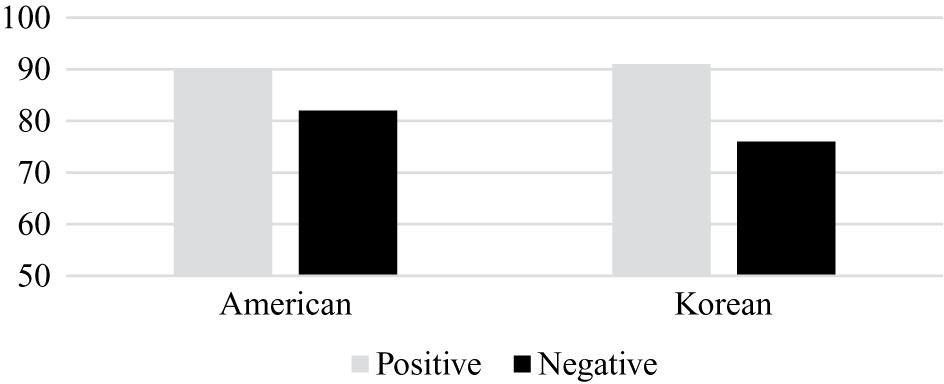
Concerning the influence of the valence factor, the Mann–Whitney U test revealed that for the Korean group (see Figure 8) the scores of the positive sentences (M = 91; Mdn = 100) were significantly higher those that of the negative sentences (M = 76; Mdn = 80): U = 5946, np = nn = 49, p = 0.01. A similar trend was found with the American group. The scores of the positive sentence items were significantly higher (M = 90; Mdn = 90) than those of the negative items (M = 82; Mdn = 85): U = 1573.5, np = nn = 49, p = 0.02. This suggests that both Korean and American participants experienced more difficulty recognizing the congruency when the sentences were semantically negative.
The mean percentage task score of positive versus negative items.

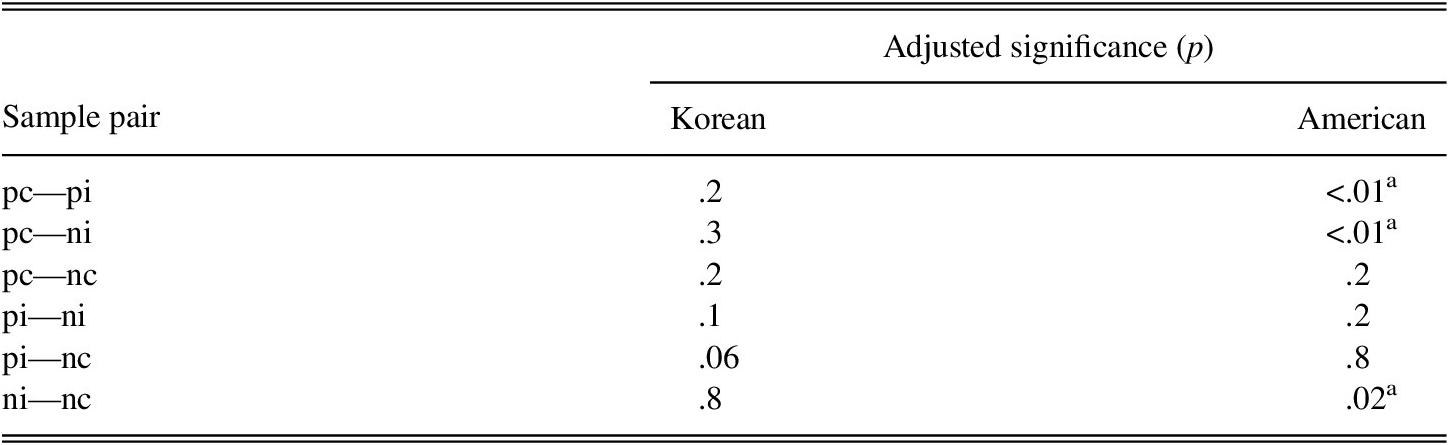
To further investigate the influence of the interaction between the congruency and valence factors on participants’ performance, the mean rank of the six pairs was compared for the Korean and American groups (see Table 9). A Kruskal–Wallis test showed that none of the six pairs had a significant difference between the mean ranks for the Korean group. However, comparisons between congruent and incongruent items within each valence category (pc—pi; nc—ni) as well as the positive congruent and negative incongruent pairs provide evidence of a statistically significant difference, which was adjusted using the Bonferroni correction for the American group.
Adjusted significance of the six pair comparisons

Note: p: positive; n: negative; c: congruent; i: incongruent; a: p < .05.
As for the comparison between Korean and American participants concerning the congruent utterance items, American participants achieved a significantly higher mean than Korean participants: U = 1999, nK = nA = 49, p = 0.03. However, the Korean group obtained significantly higher scores with the incongruent items: U = 3365, nK = nA = 49, p < 0.00. These results indicate that the American group performed better than the Korean group when the type of intonation corresponded with the type of semantic meaning whereas the incongruency did not interfere with Korean participants’ performance as much as it did for the American group.
Unlike the two categories of the congruent items, the scores of both positive (U = 4920, nK = nA = 49, p = 0.8) and negative sentences (U = 4967, nK = nA = 49, p = 0.9) were not significantly different between the Korean and American groups according to a Mann–Whitney U test.
RQ 3: HOW DO KOREAN EFL STUDENTS’ PERCEPTIONS OF ENGLISH EMOTIONAL UTTERANCES DIFFER FROM THOSE OF AMERICANS PARTICIPANTS WHEN THE UTTERANCES WERE MODULATED BY PITCH LEVELS?
The average response percentage of the American group for the Congruent/Authentic category was higher than that of Korean students (American: 90%; Korean: 79%). This result indicates that a larger ratio of American participants perceived the positive congruent utterances positively than did Korean students when emotional utterances were modulated by pitch. The American group also provided fewer incongruent descriptors than did Korean students. Only 1% of American participants perceived the positive sentences negatively whereas 10% of Korean students perceived the positive sentences negatively.
Concerning the negative congruent items, the response patterns were similar to those of the positive congruent sentences; most of the participants provided an adjective with a negative connotation. For instance, most of American participants answered that the negative congruent utterance, “she is lonely,” sounded “sad.” The American group had a higher percentage of the Congruent/Authentic responses, indicating a larger number of American participants (93%) perceived the intended meaning of the negative congruent utterances correctly than the Korean group (87%).
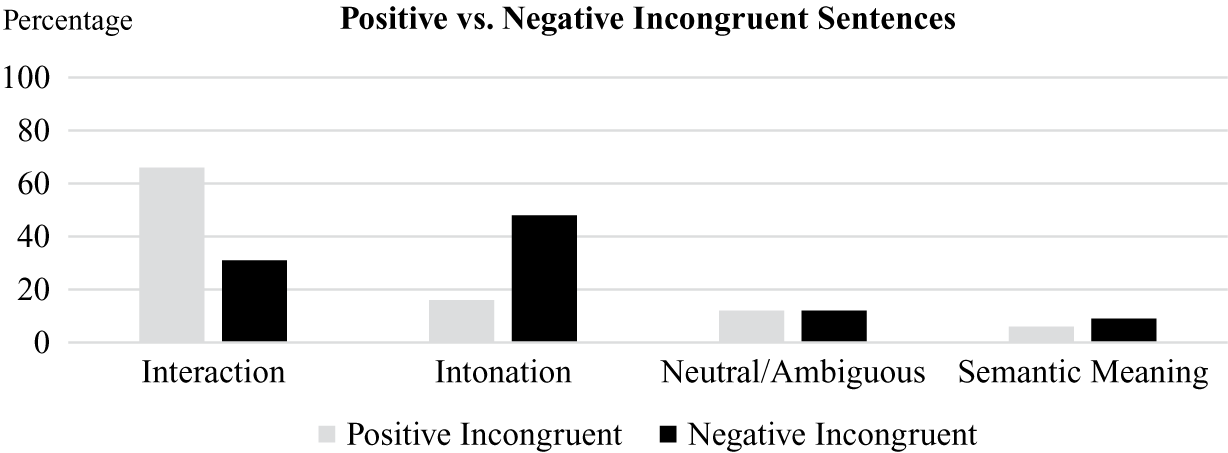
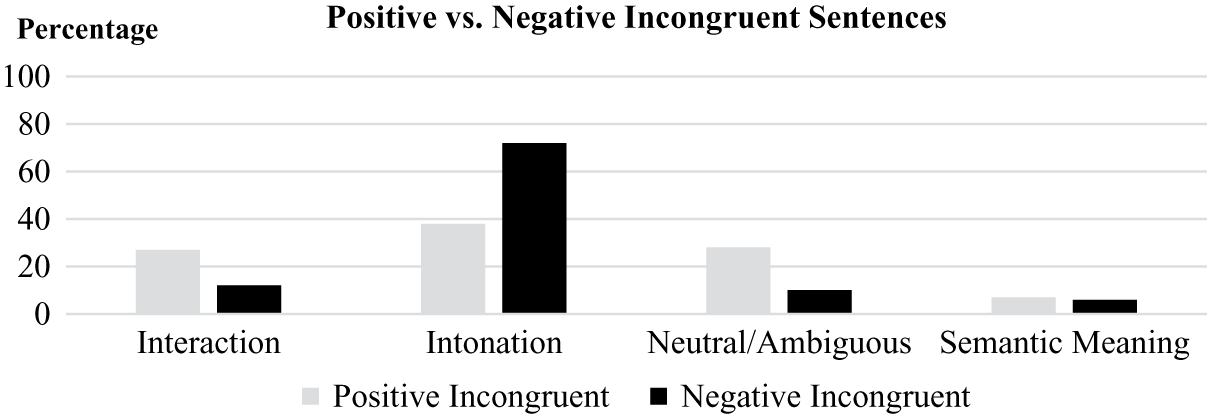
In terms of the positive incongruent utterances (e.g., “she’s happy” with a negative intonation), the largest percentage of the American participants (66%) provided an adjective relevant to the interaction between the intonation and semantic meaning. For example, the adjectives, “sarcastic,” “annoyed,” “jealous,” “insincere,” and “rude” were used to describe the utterance of “she’s brave” with a negative intonation. The Korean group, however, showed a relatively similar percentage across the four categories (Interaction: 27%; Intonation: 38%; Neutral/Ambiguous: 28%; Semantic meaning: 7%). The largest percentage of Korean participants (38%) paid attention to the intonation aspect by describing the positive incongruent utterances as “depressing” or “sad.” However, in the negative incongruent items, the Intonation category received the highest response percentage from both of the American (48%) and Korean groups (38%). This result indicates that a larger number of the American and Korean participants paid only attention to the intonation of the negative incongruent sentences when processing the utterances.
Figure 9 compares American participants’ responses to the positive and negative incongruent utterances. The Interaction category received the largest percentage for the positive incongruent sentences whereas the Intonation category obtained the largest percentage for the negative incongruent sentences. This might be due to the fact that speaking a semantically negative sentence in a positive tone is a rare type of speech.
American: The average percentage of the response frequency between the positive and negative incongruent utterances.

For the Korean group, the Intonation category received a higher percentage for the negative incongruent sentences. The Korean group also had the largest percentage discrepancy in the Intonation category between the positive and negative incongruent sentences (see Figure 10). This result suggests that the Korean group also had more difficulty in perceiving the interaction of the contradicting intonation and semantic meaning when the negative sentences were spoken in a positive tone.
Korean: The average percentage of the response frequency between the positive and negative incongruent sentences.

DISCUSSION
The findings showed that when the intonation valence was modulated by pitch, Korean participants were affected less than American participants by the incongruency between the semantic meaning and intonation type. Interestingly, these findings support psycholinguistic studies (e.g., Altarriba & Canary, Reference Altarriba and Canary2004; Degner et al., Reference Degner, Doycheva and Wentura2012) where the congruence effect was observed. Prime studies present pairs of words (primes and targets) and measure whether the presentation of the prime influences the processing time of the target words. According to those studies, L1 users’ processing times are delayed by the inconsistency of valence between primes and targets (e.g., positive prime “smile” and negative target “agony”). Although the present study did not adopt the prime paradigm measuring online processes, the actual performances of American L1 users and Korean L2 users of English participants confirmed the congruence effect. American participants obtained a lower mean score on the congruency task when there was an incongruency between the semantic meaning and type of intonation.
This phenomenon entails three important aspects for understanding Korean students’ pragmatic difficulties with perceiving English emotional intonation. First, these might be the result of not recognizing pitch levels as a prosodic cue carrying a valence element. Secondly, Korean participants might experience less emotionality when they listen to emotional utterances (Dewaele, Reference Dewaele2013). Lastly, Korean participants were less likely to simultaneously integrate the meaning and intonation of emotional utterances.
PITCH LEVELS AS A PROSODIC CUE CARRYING MEANING ELEMENTS
The Korean group’s performances on the perception tasks were less affected by the incongruency between semantic meaning and intonation type whereas the American group was significantly affected when the intonation type was modulated by pitch. It is highly likely that American students perceived pitch levels as prosodic cues either having or carrying meanings and thus their performance on the task was affected. The Korean students, however, were less likely to perceive pitch levels as prosodic cues as having a particular semantic value. Considering the fact that Korean students’ average congruency task score was almost identical to that of American students, a relatively high score, it cannot be argued that Korean students lacked the ability to simply “recognize” the different types of prosodic cues. Korean participants’ pragmatic difficulties result from an inability to perceive pitch as a prosodic cue carrying a semantic component rather than an inability to distinguish different intonation patterns, which might be due to the fact that they are unaccustomed to perceiving the intentional meaning through pitch variations of intonation.
THE DETACHMENT EFFECT ON SECOND LANGUAGE LEARNERS
Korean participants having similar scores on the congruent and incongruent conditions could be the result of the “detachment effect” in the L2 (Dewaele, Reference Dewaele2013; Marcos, Reference Marcos1976; Pavlenko, Reference Pavlenko2012). Although both groups rated the selected emotion words similarly when they read them, it is unclear whether the rating process represents what participants “think” or “feel” about the words. It is possible that Korean students experienced less interference with the emotionality of the selected emotion words when they processed the emotional utterances. To understand the relationship between Korean students being less affected by the incongruent conditions and their emotional detachment, the theoretical premise of the congruence effect (having scored less) in psycholinguistics needs to be explained.
The greater interference of the affective incongruence between the sentence meaning and the intonation type for American students found in this study concur with the results of psycholinguistic studies that investigated the congruence effect throughout different types of modes and levels. These psycholinguistic studies measure reaction times to congruent and incongruent stimuli throughout different tasks (e.g., Altarriba & Canary, Reference Altarriba and Canary2004; Degner et al., Reference Degner, Doycheva and Wentura2012; Hermans et al., Reference Hermans, Houwer and Eelen1994). Researchers doing priming studies interpret faster reaction times as an indication of faster and more automatic activation spreading in a network of mental representation (Meyer et al., Reference Meyer, Schvaneveldt, Ruddy, Rabbitt and Dornic1975). According to priming studies, the reaction time discrepancy between affective congruent and incongruent conditions signifies a “processing” difference. The affective priming studies that examined the congruence effect provided evidence that reaction times to L1 affective stimuli are generally faster than those to L2 affective stimuli, affirming that L2 verbal stimuli elicit a weaker emotionality especially for adult second language users who began their language learning after puberty (e.g., Ayçiçegi & Harris, Reference Ayçiçegi and Harris2004; Ayçiçegi-Dinn & Caldwell-Harris, Reference Ayçiçegi-Dinn and Caldwell-Harris2009). From a processing perspective, the reduced automatic affective process may explain the detachment effect. In other words, it is more challenging for LX users to “feel” the emotionality of emotion words rather than to semantically “understand” the meaning when using a LX. The present study aimed to investigate recognized and observable perceptual differences in using emotional intonation rather than “internal online processing,” which led to the selection of a different methodological approach than measuring reaction times. The results of this study, however, concur with findings in psycholinguistic studies.
The lower emotional resonance of the LX emotion words has also been linked to the way in which the LX was acquired as well as the current use of the LX (Dewaele, Reference Dewaele2013, Reference Dewaele2016). Learning a LX in a classroom environment means that emotion words and concepts are not as rich in multimodal connotations and associations as L1 words and concepts that were acquired naturalistically. The lack of emotional power of the LX means that multilinguals typically prefer their L1 to express their emotions in, which can perpetuate established language preferences. Of course, multilinguals who use a LX with a romantic partner tend to acquire more complete representations of LX emotion concepts after a couple of months, and this can include a better understanding of the meaning of intonation and prosody (Dewaele, Reference Dewaele2018a; Dewaele & Salomidou, Reference Dewaele and Salomidou2017). Initially, participants reported feeling “fake” in expressing their emotions and experienced difficulties in judging the emotionality of their partners’ words. One of the reasons for this was the time needed to align visual, vocal, and verbal channels.
THE INTERPLAY BETWEEN THE VERBAL AND VOCAL CHANNELS
The results of the adjective descriptor task showed that Korean participants were less attuned to the interplay between the semantic meaning and the intonation type. When listening to the positive word with negative intonation utterances, 66% of American participants provided an adjective describing the interaction such as “sarcastic” while only 27% of Korea participants paid attention to the interplay. Thirty-eight percent of Korean participants, however, described the utterances as “depressing” or “sad,” indicating that they took notice of the negative intonation type without integrating with the positive semantic meaning of the utterances. This shows that the difficulties that Korean students experienced in noticing the congruency was partly due to their insensitivity to the interplay between the semantic and prosodic elements while listening to emotional utterances.
The findings of this study have some pedagogical and practical implications. L2 learners need to be cognizant of the crucial role of pitch as a prosodic cue in English interactions. Recently there has been a greater interest in the pragmatic use of discourse intonation (e.g., Pickering, Reference Pickering2018). Notwithstanding, most English communication curricula only include conversation scripts that resemble everyday communications or instructions on how to use pitch variations in English to distinguish different types of sentences, such as declaratives or tag questions. They seldom teach students the intentional elements of using intonation. Effective English curriculum, thus, would teach the use of pitch levels so that learners can effectively communicate intentional and emotional elements. A curriculum that equips learners with communicative tools would include the use of prosodic cues with comprehensive linguistic information such as illocutionary effects, specific contents, use, meaning, and word order. In other words, such curriculum would use authentic content (cf. Mavrou & Dewaele, Reference Mavrou and Dewaele2020).
For English as a Second Language (ESL) learners, effective use of English emotional intonation may yield far-reaching effects. Ineffective communication of emotions and intentions may result in some unfortunate or even detrimental consequences in critical situations, such as during a counseling session, an emergency visit to the hospital (Altarriba & Santiago-Rivera, Reference Altarriba and Santiago-Rivera1994; Santiago-Rivera & Altarriba, Reference Santiago-Rivera and Altarriba2002), or court hearings. The research with empirical evidence for the different affective processes when ESL learners and L1 users use English can contribute to the understanding of linguistic injustice that ESL learners may experience. This would lead to the practice of fair language policies properly managing linguistic diversity without applying “the unilateral and L1 speakers” dominant perspective.
CONCLUSION
The present study reported the results of two English emotional intonation perception tasks, the congruency and the adjective description tasks, performed by American L1 and Korean L2 users of English. The findings of the congruency task suggest that American L1 speakers were more affected by the inconsistency between the semantic meaning and the valence type (positive vs. negative) of emotional intonation than were Korean L2 users of English. This was demonstrated by American speakers’ lower mean score in the incongruent task items than Korean participants. Korean students were also more affected by the negative semantic meaning than American participants. The results of the adjective task also support that Korean participants were less attuned to the interplay between the semantic meaning and the valence type of intonation when they were asked to describe the presented emotional utterances. Korean participants were likely to pay attention to one element, either the intonation type or the semantic meaning, rather than recognizing the interplay between the two linguistic properties.
The present study is limited in several ways. In the process of designing and conducting the tasks representative of the perception of emotional utterances, some factors, which weakened the validity of the tasks, were inevitably involved. First, the settings for the perception task could not be controlled. Although both classrooms had similar seating configurations when participating in the perception task, the test environments differed because the classroom sizes differed. Additionally, with the American participants, the first author visited two different sessions of the same class held in the same classroom. The perception task for the Korean group, however, was done in two different classrooms, and the size of one classroom was larger than the other. Thus, to minimize the influence of the differing task environments, an identical test setting is recommended for future research. In addition, the repetition of the same tasks could have impacted the performances of the participants. It is possible, due to “the training effect,” that participants paid more attention to the regulations of their intonation patterns when they repeated the perception task. This happened because the task used the simplistic declarative sentence; thus, future studies may consider using more naturalistic data to increase task validity.