


Introduction
Perchlorate (ClO4 −) was measured at the Mars Phoenix landing site using the Microscopy Electrochemistry and Conductivity Analyser Wet Chemistry Laboratory (WCL) (Hecht et al. Reference Hecht2009; Kounaves et al. Reference Kounaves2010) and its presence, based on oxygen release, was also confirmed by the Phoenix Thermal Evolved Gas Analyser (Hecht et al. Reference Hecht2009). Based on the initial detection of perchlorate, spectral analysis using the Phoenix Surface Stereo Imager indicated a possible heterogeneous distribution of hydrated-perchlorate at the Phoenix landing site (Cull et al. Reference Cull, Arvidson, Catalano, Ming, Morris, Mellon and Lemmon2010). Although in contrast, WCL data show a relatively uniform abundance in the samples analysed (Kounaves et al. Reference Kounaves2010; Toner et al. Reference Toner, Catling and Light2014). Following the detection of perchlorate at the Phoenix site, a reanalysis of the Viking Gas Chromatography/Mass Spectroscopy (GCMS) data indicated the presence of oxychlorine phase like perchlorate at both Viking landing sites (Navarro-González et al. Reference Navarro-González, Vargas, de la Rosa, Raga and McKay2010). Results from the Sample Analysis at Mars (SAM) instrument suite on board the Curiosity rover suggest the presence of oxychlorine phases, likely perchlorate and chlorate (ClO3 −), in Gale Crater (Glavin et al. Reference Glavin2013; Leshin et al. Reference Leshin2013; Archer et al. Reference Archer2014; Ming et al; Reference Ming2014; Freissinet et al. Reference Freissinet2015). Remotely sensed infrared (IR) spectra acquired by the Compact Reconnaissance Imaging Spectrometer for Mars (CRISM) are consistent with hydrated-chlorate or hydrated-perchlorate in recurring slope lineae (RSL) features on Mars (Ojha et al. Reference Ojha, Wilhelm, Murchie, McEwen, Wray, Hanley, Massé and Chojnacki2015). These hydrated features appear to only be present during the summer when the RSL are at their maximum spatial extent. Oxychlorine phase in this work refers to oxygen bearing Cl anions that fall into the series: hypochlorite (ClO−), chlorite (ClO2 −), chlorate (ClO3 −) and perchlorate (ClO4 −). Hypochlorite and chlorite are typically thought of as intermediate phases involved in chlorate and perchlorate formation (e.g. Catling et al. Reference Catling, Claire, Zahnle, Quinn, Clark, Hecht and Kounaves2010; Carrier & Kounaves, Reference Carrier and Kounaves2015) and may not accumulate in martian materials to the same level as perchlorate or chlorate. However, hypochlorite and chlorite in martian surface materials cannot be ruled out; therefore, oxychlorine will be the term used to account for all possible oxygen bearing Cl phases that may be present on Mars.
The occurrence of oxychlorine phases at widely spaced locations on Mars (Phoenix Landing site, Gale Crater and RSL features) suggests that oxychlorine phases may occur throughout the martian surface. The measurement of high chlorine (e.g. Clark et al. Reference Clark, Baird, Rose, Toulmin, Christian, Kelliher, Castro, Rowe, Keil and Huss1977; Rieder et al. Reference Rieder, Economou, Wanke, Turkevich, Crisp, Brückner, Dreibus and McSween1997; Rieder et al. Reference Rieder2004; Gellert et al. Reference Gellert2006; Keller et al. Reference Keller2006; Blake et al. Reference Blake2013; Gellert et al. Reference Gellert2013) (Table 1) and chloride (Osterloo et al. Reference Osterloo, Hamilton, Bandfield, Glotch, Baldridge, Christensen, Tornabene and Anderson2008) concentrations all over Mars by orbital and landed instrumentation suggests that oxychlorine could be a component of these other chlorine detections. This is supported by the fact that oxychlorine phases are a component of the total Cl detected at that Phoenix and Gale Crater landing sites. IR spectroscopy and X-ray diffraction (XRD) analysis of Mars surface materials are capable of detecting oxychlorine phases such as perchlorate and chlorate. These techniques may thus be useful for identifying oxychlorine phases in locations where chlorine or chloride has been detected. Furthermore, where oxychlorine and chlorine or chloride have been determined, such relationships may be useful in constraining oxychlorine concentrations where only total chlorine or chloride data are available.
Total chlorine, perchlorate (ClO4 −) and chloride (Cl−) detected on Mars as determined by surface and orbital instrumentation.
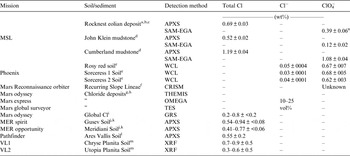
APXS, Alpha Particle X-ray Spectrometer; SAM-EGA, Sample Analysis at Mars Evolved Gas Analysis; WCL, Wet Chemistry Laboratory; XRF, X-ray Fluorescence; CRISM, Compact Reconnaissance Imaging Spectrometer for Mars; THEMIS, Thermal Emission Imaging System; OMEGA, Observatoire pour la Minéralogie, l'Eau, les Glaces et l'Activité; TES, Thermal Emission Spectrometer; GRS, Gamma Ray Spectrometer.
aLeshin et al. (Reference Leshin2013); bArcher et al. (Reference Archer2014); cBlake et al. (Reference Blake2013); dMing et al. (Reference Ming2014); eFang et al. (Reference Fang, Oberlin, Ding and Kounaves2015); fOjha et al. (Reference Ojha, Wilhelm, Murchie, McEwen, Wray, Hanley, Massé and Chojnacki2015); gOsterloo et al. (Reference Osterloo, Hamilton, Bandfield, Glotch, Baldridge, Christensen, Tornabene and Anderson2008); hJensen & Glotch (Reference Jensen and Glotch2011). iKeller et al. (Reference Keller2006); jMorris et al. (Reference Morris2006); kYen et al. (Reference Yen2006); lBrückner et al. (Reference Brückner, Dreibus, Rieder and Wänke2003); mClark et al. (Reference Clark, Baird, Weldon, Tsusaki, Schnable and Candelaria1982).
n Perchlorate concentration determined from evolved SAM–EGA O2 results assuming that all oxygen is derived from perchlorate.
The goal of this review is to evaluate analytical techniques employed to detect and measure oxychlorine phases on Mars. The specific objectives of this review are to: (1) Discuss oxychlorine detection techniques employed on landed and orbital missions and their limitations; (2) Evaluate oxychlorine versus total Cl determinations from the Phoenix and Mars science laboratory (MSL) missions and how this relationship could be used to constrain oxychlorine levels at other sites (e.g. Viking, Mars Pathfinder, Mars Exploration Rovers, Mars Odyssey Gamma Ray Spectrometer (GRS)); and (3) Briefly discuss alternative analytical technology for detecting oxychlorine phases on future missions to Mars.
Phoenix Lander WCL
The WCL onboard the Phoenix Lander conducted the first analysis of soluble ionic species in the martian soil and resulted in the first direct detection of perchlorate on the martian surface. A detailed description of the Phoenix-WCL has been previously published (Kounaves et al. Reference Kounaves2009) and is only briefly reviewed here. The WCL was consisted of an upper ‘actuator’ and a lower ‘beaker’ assembly. The actuator consisted of a titanium container that held 25 ml of deionized water plus ~10−5 M concentrations of selected ionic species for initial sensor calibrations; a drawer for accepting 1 cm3 of soil through a screened funnel; a stirrer; and a reagent dispenser. The lower ‘beaker’ contained an array of sensors for determination of selected soluble ions, pH, and also solution properties such as electrical conductivity and redox potential (E h ).
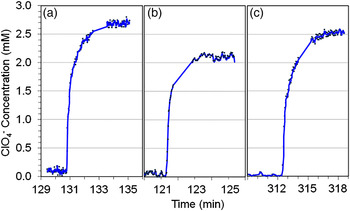
Soil samples were successfully added and analysed in three of the four WCL cells, one from the surface on sol 30 (Rosy Red) and two from the top of the ice table ~5 cm in depth on sols 41 and 107 (Sorceress-1 and Sorceress-2). All three samples were found to contain ionic species similar to those generally measured on Earth, including mM levels in solution of Mg2+, Ca2+, Cl−, Na+, K+ and SO4 =, and a pH of ~7.7 (Kounaves et al. Reference Kounaves2010). One ion-selective sensor in the WCL array, originally designated as a nitrate (NO3 −) sensor, responds to a large number of anionic species with selectivity that follows the Hofmeister series (ClO4 − > I− > SCN− > ClO3 − > CN− > Br− > BO3 3− > NO3 − > Cl−). The response of this sensor to ClO4 − is three orders-of-magnitude greater than any other species. For all three WCL samples, a ~200 mV sensor response was observed (Fig. 1). The magnitude of this response exceeded the signal response limit, based on the sample size, for the possible concentrations of any other anionic species, with the exception of ClO4 −. In other words, the sensitivity of the Hofmeister series electrode to anions other than perchlorate is insufficient to account for the magnitude of the sensor response. To definitively confirm the ClO4 − detection, laboratory analyses using flight-spare and/or identical sensors were used to eliminate all other possibilities. The concentration of ClO4 − in the Rosy Red, Sorceress-1 and Sorceress-2 soil samples have been reported ranging from 0.5 to 0.7 wt%; however recent reanalysis and refinements with decreased error (Fang et al. Reference Fang, Oberlin, Ding and Kounaves2015) give solution concentrations of of 2.7, 2.2 and 2.5 mM, equivalent to 0.67, 0.68 and 0.62 wt% ClO4 − in the soil, respectively (Table 1).
Concentration of ClO4 − in the WCL beaker solution after addition of ~1 cm3 of soil to 25 ml of water for (a) Rosy Red on Sol-30, (b) Sorceress-1 on Sol-41 and (c). Sorceress-2 on Sol-107 samples. Solution concentrations are equivalent to 0.67, 0.68 and 0.62 wt% ClO4 − in the soil, respectively. The wt% ClO4 − for the Sorceress-1 sample has been adjusted to reflect the delivery of only 0.75 cc soil.
In addition to measuring the concentration of the ClO4 − ion, the parent salt identity was determined by using the effect of the ClO4 − ion on the calcium (Ca2+) sensor. A series of laboratory analyses at various ratios of added Mg(ClO4)2 to Ca(ClO4)2 demonstrated that the response of the Ca2+ sensor would give the best fit to the WCL Mars data with a sample containing 60% Ca(ClO4)2 and 40% Mg(ClO4)2 (Kounaves et al. Reference Kounaves, Nikos, Chaniotakis, Chevrier, Carrier, Folds, Hansen, McElhoney, O'Neil and Weber2014a). The presence of Ca(ClO4)2 suggests that the soil at the Phoenix landing site has not been in contact with liquid water since formation. Subsequent dissolution of Ca(ClO4)2 in the presence of the soluble sulphates would have caused Ca2+ to precipitate as insoluble CaSO4 (Kounaves et al. Reference Kounaves, Carrier, O'Neil, Stroble and Claire2014b) and the ClO4 − to reprecipitate as NaClO4, KClO4 and/or MgClO4 (e.g. Marion et al. Reference Marion, Catling, Zahnle and Claire2010; Toner et al. Reference Toner, Catling and Light2014). However, spectral analysis (0.455–1 µm) of the Phoenix soils is consistent with the presence of subsurface hydrated Mg-perchlorate patches that were interpreted to have formed by translocating Mg-perchlorate brines from the surface by liquid water thin films at low temperature (e.g. 206–245 K) (Cull et al. Reference Cull, Arvidson, Catalano, Ming, Morris, Mellon and Lemmon2010). Mg-perchlorate deliquescent kinetics, although, may not be fast enough for the short periods of in which Mg-perchlorate brines are thermodynamically stable (Kounaves et al. Reference Kounaves, Carrier, O'Neil, Stroble and Claire2014b). Nevertheless, more work is required to understand the possibility of post-depositional perchlorate translocation from the surface to the subsurface.
Even though the concentration of perchlorate present made it impossible to detect any other oxychlorine species like chlorate directly in the martian soil samples (Kounaves et al. Reference Kounaves2010; Hanley et al. Reference Hanley, Chevrier, Berget and Adams2012), chlorate may be present in the Phoenix samples. Three recent discoveries, the presence of chlorate in the Mars meteorite EETA79001 (Kounaves et al. Reference Kounaves, Carrier, O'Neil, Stroble and Claire2014b), the acquisition of orbital IR (1–3.92 µm) spectra consistent with the presence of hydrated Mg-chlorate (Ojha et al. Reference Ojha, Wilhelm, Murchie, McEwen, Wray, Hanley, Massé and Chojnacki2015) and the formation of both ClO4 − and ClO3 − by UV on martian analogue Cl-bearing mineral surfaces (Carrier & Kounaves, Reference Carrier and Kounaves2015), strongly support this possibility. The detection of chlorate in EETA79001 actually occurred at a molar concentration 2.8 × higher than perchlorate (Kounaves et al. Reference Kounaves, Carrier, O'Neil, Stroble and Claire2014b). Furthermore, chlorates commonly occur with perchlorates in terrestrial deserts, which suggest that if oxychlorine formation processes on Earth and Mars are similar then chlorates may occur wherever there are perchlorates on Mars (Rao et al. Reference Rao, Hatzinger, Bohlke, Sturchio, Eckardt and Jackson2010).
Phoenix Scout Lander Thermal Evolved Gas Analyzer (TEGA)
The goal of the TEGA instrument was to search for organics and evaluate the volatile bearing mineralogy in surface sediments at the Phoenix Landing site. The TEGA instrument was composed of a scanning calorimeter coupled to a magnetic mass spectrometer (Hoffman et al. Reference Hoffman, Chaney and Hammack2008; Boynton et al. Reference Boynton2009). Soils or sediments were scooped and deposited (~50 mg) into one of eight TEGA ovens. Soils were then heated to 1000°C at a heating rate of 20°C min−1 in a 12 mbar N2 purge at 0.04 sccm flow rate (Boynton et al. Reference Boynton2009). Endothermic and/or exothermic transitions were detected by the scanning calorimeter and any volatile release or consumption was monitored simultaneously by the mass spectrometer. For example, evidence for the thermal decomposition of calcium bearing carbonate was detected by presence of an endothermic transition and corresponding CO2 detection (Boynton et al. Reference Boynton2009).
The detection of evolved O2 by TEGA that began at 325°C and peaked at 465°C (Hecht et al. Reference Hecht2009) (Fig. 2(a)) is consistent with the presence of perchlorate in the Phoenix Landing site soil. Other O2 sources are possible, but the detection of perchlorate by the WCL instrument indicates that perchlorate is the likely O2 source. Perchlorate dehydration typically precedes its thermal decomposition (e.g. Marvin & Woolaver, Reference Marvin and Woolaver1945; Markowitz, Reference Markowitz1963; Migdal-Mikuli & Hetmańczyk, Reference Migdal-Mikuli and Hetmańczyk2008; Cannon et al. Reference Cannon, Sutter, Ming, Boynton and Quinn2012).
(a) Evolved oxygen release versus temperature from the Phoenix Lander TEGA analysis of the Baby Bear (TEGA-BB) sample and the SAM–EGA of Gale Crater Rocknest (SAM-RN), John Klein (SAM-JK) and Cumberland (SAM-CB) samples. (b) Evolved HCl from the SAM–EGA of the SAM-RN, SAM-JK and SAM-CB materials. No Cl phases were detected by TEGA.

Following dehydration, Na-, K- and Ca-perchlorate thermal decomposition results in O2 evolution and chloride formation:
 $${{\rm M}^{{\rm z +}}} {{\rm (Cl}{{\rm O}_{\rm 4}}{\rm )}_{\rm z}}{\rm \bullet} n{{\rm H}_{\rm 2}}{\rm O}\grave {\rm a} {{\rm M}^{{\rm z +}}} {{\rm (Cl}{{\rm O}_{\rm 4}}{\rm )}_{\rm z}}{\rm +} n{{\rm H}_{\rm 2}}{\rm O}$$
 $${{\rm M}^{\rm z +}} {{\rm (}{\rm CI}{{\rm O}_4}{\rm )}_{\rm z}} \grave {\rm a} {\rm M}{{\rm CI}_{\rm z}} + {\rm z} \bullet {\rm 2}{{\rm O}_{\rm 2}}$$
Mg and Fe perchlorates dehydrate as above but instead form oxides and release Cl2 gas.
 $${\rm 2}{\rm M}{({\rm Cl}{{\rm O}_4})_2}{\rm \rightarrow} \,{\rm 2}{\rm MO}{\rm + 7}{{\rm O}_2}{\rm + 2}{{\rm Cl}_2}$$
Any residual water vapour remaining in the oven area can react with the Cl2 to from HCl
 $${\rm 2C}{{\rm l}_{\rm 2}}{\rm + 2}{{\rm H}_{\rm 2}}{\rm O}\,{\rm \rightarrow} \,{\rm 4HCl +} {{\rm O}_{\rm 2}}$$
Hydrated forms of perchlorate are thought to be stable under martian atmospheric conditions (e.g. Robertson & Bish, Reference Robertson and Bish2011) and evolved water detected by TEGA suggests that the perchlorate could have been hydrated, though adsorbed water and other hydrated minerals could have contributed to water detected by TEGA (Smith et al. Reference Smith2009).
Perchlorate thermal decomposition is characterized by an exothermic transition (e.g. Acheson & Jacobs, Reference Acheson and Jacobs1970), yet no exothermic transition was observed by TEGA. The Phoenix soil possesses oxidized Fe phases that likely consist of nanophase iron oxides (Seelos et al. Reference Seelos2008; Goetz et al. Reference Goetz2010) which may have interacted with perchlorate and minimize the detection of the exothermic transition. Laboratory thermal analysis of K-perchlorate mixtures with hematite (Fe2O3) demonstrated that as more hematite was added, the intensity of the perchlorate decomposition exotherm decreased (e.g. Lee & Hsu, Reference Lee and Hsu2001). This suggests that interactions with Fe-oxide phases in the Phoenix material may have suppressed the perchlorate decomposition exotherm.
No evolved Cl masses (e.g. m/z 35 Cl, m/z 36 HCl, m/z 70 Cl2) were detected by TEGA suggesting that either the perchlorate was Na, Ca or K-perchlorate or that Cl was removed from the gas stream by Ni-bearing components of the TEGA (Lauer et al. Reference Lauer, Ming, Sutter, Golden, Morris and Boynton2009). The Na-, K- and Ca-perchlorates mostly decompose to chloride phases with limited evolution of Cl (e.g. Marvin & Woolaver, Reference Marvin and Woolaver1945; Markowitz, Reference Markowitz1963) indicating that perhaps these perchlorates are responsible for the O2 release. However, laboratory analogue studies of the WCL ion selective electrode analyses were consistent with the presence of Mg-perchlorate and Ca-perchlorate (Kounaves et al. Reference Kounaves, Nikos, Chaniotakis, Chevrier, Carrier, Folds, Hansen, McElhoney, O'Neil and Weber2014a). This suggests that at least some HCl from Mg-perchlorate decomposition could have been detected. The possibility exists that the Ni composition of the TEGA ovens could have reacted with evolved Cl species to form NiCl2 and scrubbed the Cl from the gas stream and inhibit detection by the TEGA mass spectrometer (Lauer et al. Reference Lauer, Ming, Sutter, Golden, Morris and Boynton2009).
MSL-SAM instrument
Background
The main objectives of the SAM instrument were to search for evidence of organics and evaluate the volatile bearing mineralogy in the Gale Crater sediments (Mahaffy et al. Reference Mahaffy2012; Glavin et al. Reference Glavin2013; Leshin et al. Reference Leshin2013; Archer et al. Reference Archer2014; McAdam et al. Reference McAdam2014; Ming et al. Reference Ming2014; Freissinet et al. Reference Freissinet2015). The SAM instrument is composed of two ovens connected to a quadrupole mass spectrometer (QMS), gas chromatograph (GC) and tunable laser spectrometerTLS. Soil, sediment or drilled material is acquired and deposited into sample cups (~45–135 mg) that is then transferred to one of two ovens. The material in the cup is heated to ~860°C at 35°C min−1 in a 0.8 sccm He purge held at 25 mbar. Direct analysis of the volatiles released from the sample over the entire temperature range is achieved in an evolved gas analysis (EGA) mode where a fraction (~1 : 800 split) of the gas flow was analysed directly by electron impact ionization and QMS. A select temperature range of gas is sent to the GCMS for organic analysis (Glavin et al. Reference Glavin2013; Ming et al. Reference Ming2014; Freissinet et al. Reference Freissinet2015). The gas is concentrated on a hydrocarbon trap cooled to 5°C and subsequently desorbed by heating to ~300°C followed by GC separation (GC-5: MXT-CLP, Siltek-treated stainless steel metal-chlorinated pesticides column, 30 m length, 0.25 mm internal diameter and 0.25 µm film thickness) before detection by the thermal conductivity detector (TCD) and the QMS (GCMS mode). The detailed description of the SAM-EGA and GCMS modes and instrument parameters can be found elsewhere (Mahaffy et al. Reference Mahaffy2012; Glavin et al. Reference Glavin2013).
SAM-EGA results
The SAM-EGA has detected O2 and HCl releases in all samples reported to date suggesting the presence of perchlorate or chlorate in the Gale materials (Leshin et al. Reference Leshin2013; Glavin et al. Reference Glavin2013; Ming et al. Reference Ming2014) (Fig. 2(a) and (b)). The Rocknest (RN) eolian deposit and John Klein (JK) and Cumberland (CB) mudstones all evolved O2 and HCl during pyrolysis. However, laboratory analyses of pure perchlorate phases do not yield O2 and HCl at temperatures entirely consistent with the Gale detections (Glavin et al. Reference Glavin2013; Leshin et al. Reference Leshin2013; Ming et al. Reference Ming2014). Iron-bearing phases (e.g. hematite) when mixed with perchlorate or chlorate are known to lower perchlorate and chlorate decomposition temperatures (Rudloff & Freeman, Reference Rudloff and Freeman1970; Lee & Hsu, Reference Lee and Hsu2001). Iron-oxide phases detected by CheMin in the Gale sediments (Bish et al. Reference Bish2013; Blake et al. Reference Blake2013; Vaniman et al. Reference Vaniman2014) suggest that such phases could lower the O2 releases temperatures.
The amounts of O2 for RN, JK and CB translates to 0.1–1.1 wt% ClO4 or 0.1–1.2 wt% ClO3 (Archer et al. Reference Archer2014; Ming et al. Reference Ming2014) (Table 1). The amount of HCl evolved (0.006–0.04 wt%) is much less than what is calculated to be stochiometrically possible from O2 releases, for chlorate or perchlorate. This suggests the presence of perchlorate/chlorate phases that do not evolve HCl may be present. For example, pure magnesium and iron perchlorate evolve HCl upon thermal decomposition, whereas Ca, Na and K-perchlorate do not evolve HCl (Markowitz, Reference Markowitz1963). The presence of natural geologic materials, on the other hand, may promote complex reactions with the perchlorate/chlorate phases. Such complex reactions could alter the evolution of Cl and/or formation of chloride phases which may cause HCl release characteristics to differ from what is expected of pure perchlorate phases.
SAM–GCMS results
The SAM/GCMS along with SAM-EGA detected chlorinated hydrocarbons produced during pyrolysis of the Rocknest fines that suggests the presence of oxychlorine compounds in the deposit (Fig. 3). Similar results were obtained after analysis of the drilled samples at Yellowknife Bay (John Klein and Cumberland) and Pahrump Hills (Confidence Hills) and those results are described in detail by Ming et al. (Reference Ming2014) and Freissinet et al. (Reference Freissinet2015).
SAM gas chromatogram showing the intensities (in counts per second) of the major masses of the chloromethanes and a chloromethylpropene detected in the second Rocknest sample run compared with the empty cup blank (shaded peaks) as a function of retention time in seconds. Each peak was identified by matching the mass spectrum generated from Gaussian fits of the QMS m/z values to mass spectra available in the NIST library (e.g. shown in inset). Peak identifications: 1, chloromethane; 2, dichloromethane; 3, trichloromethane; and 4, 1- or 3-chloro2-methylpropene. Figure from Glavin et al. (Reference Glavin2013).

The source of the chlorinated hydrocarbons was attributed to a reaction between martian oxychlorine and terrestrial organic contamination. Several chlorinated hydrocarbons including chloromethane (CH3Cl), dichloromethane (CH2Cl2), trichloromethane (CHCl3), a chloromethylpropene (C4H7Cl) and chlorobenzene (C6H5Cl) were identified by GCMS above background levels with chloromethane abundances up to 2.3 nmol (~2.3 parts-per-million assuming 50 mg sample) after pyrolysis of the Rocknest samples, but were not detected in the empty cup blank run analysed prior to the analysis of the Rocknest fines (Fig 3). Several products of N-methyl-N-(tert-butyldimethylsilyl)-trifuoroacetamide (MTBSTFA), a chemical whose vapours were released from one of the derivatization cups inside SAM, were also identified in both the blank and Rocknest EGA and GCMS runs (Glavin et al. Reference Glavin2013). The evolution of the chloromethanes observed directly by EGA during pyrolysis was coincident with the increase in both O2 and HCl released from the Rocknest sample at temperatures above ~200°C and the decomposition of one of the hydrolysis products of MTBSTFA, 1,3-bis(1,1-dimethylethyl)-1,1,3,3-tetramethyldisiloxane. These correlations strongly suggest that the chlorinated hydrocarbons detected by SAM are the result of reactions between MTBSTFA products and O2 and Cl released from the decomposition of an oxychlorine species during pyrolysis.
Laboratory pyrolysis GCMS analyses of 1 wt% Ca- and Mg-perchlorate mixtures heated in the presence of μmol quantities of MTBSTFA consistently showed the same distribution of chloromethanes and chloromethylpropene that were detected by SAM–GCMS. Although Cl2 is predicted to form from the decomposition of Mg-perchlorate, Cl2 was not detected in the SAM–GCMS data. Any Cl2 that was released from perchlorates was likely converted to HCl during pyrolysis or on the hydrocarbon trap due to the much higher quantities of H2O released from the sample (e.g. reaction 4). The presence of oxychlorine species in Rocknest are thus indicated by the chlorinated hydrocarbons detected by SAM which are likely products of reactions between martian oxychlorine species and terrestrial organic carbon in SAM (e.g. MTBSTFA and associated products) and martian oxychlorine species in the samples (Glavin et al. Reference Glavin2013). Subsequent work, however, has identified martian organics including chlorobenzene and a C2, C3 and C4 dichloroalkane that could only be due to reactions between martian organics and oxychlorine in the Cumberland mudstone (Freissinet et al. Reference Freissinet2015).
The abundances of chloromethane and dichloromethane measured by the SAM/GCMS at Rocknest (up to ~2 ppm) were much higher than the trace amounts of these simple chlorinated hydrocarbons (0.04–40 ppb) detected by the Viking 1 and Viking 2 lander GCMS instruments (Biemann et al. Reference Biemann, Oro, Toulmin, Orgel, Nier, Anderson and Biller1976, Reference Biemann1977). The chloromethane and dichloromethane detected in the Viking near surface soil runs were originally thought by Biemann et al. (Reference Biemann1977) to be derived from terrestrial sources including cleaning solvents. However, similar to SAM, these chloromethanes were not identified in empty oven blank GCMS runs carried out by both Viking landers prior to the analysis of the soils. Although perchlorates were not identified at the Viking landing sites, the detection of perchlorate at the Phoenix (Hecht et al. Reference Hecht2009) Gale Crater landing sites (Glavin et al. Reference Glavin2013; Ming et al. Reference Ming2014) suggests that both Viking Lander GCMS instruments measured signatures of perchlorates or other oxychlorine compounds (Navarro-González et al. Reference Navarro-González, Vargas, de la Rosa, Raga and McKay2010) in the form of chloromethane and dichloromethane. This will be further discussed below. The much higher abundances of chloromethanes detected in the Rocknest soil by SAM compared with the abundances measured at the Viking sites is likely due to a significant terrestrial carbon background from MTBSTFA in SAM that was not present in the Viking GCMS instruments.
The possibility that phases other than oxychlorine phases may be responsible for the detected O2 are possible but unlikely. Nanomole levels of nitrogen-oxide (NO, m/z 30) were detected and were attributed to nitrate thermal decomposition at similar temperatures as the main O2 releases (Leshin et al. Reference Leshin2013; Ming et al. Reference Ming2014; Stern et al. Reference Stern2015). Nitrate thermal decomposition results in O2 evolution, but the nmole levels of nitrates would not be expected to contribute significantly to the μmole O2 detections. The detected high temperature (>500°C) SO2 releases are consistent with sulphate thermal decomposition (Ming et al. Reference Ming2014; McAdam et al. Reference McAdam2014) that can also evolve O2. However, sulphate thermal decomposition occurring above 500°C is not a likely candidate for the main O2 releases detected below 500°C. Hydrogen peroxide has been proposed to be a potential oxidant in the martian soil, but thermal decomposition of hydrogen peroxide occurs below 145°C and thus is not a candidate O2 source in the Gale Crater sediments (Zent & McKay, Reference Zent and McKay1994; Wu et al. Reference Wu, Chi, Huang, Lin, Peng and Shu2010). Superoxides are another proposed source of O2 but their instability in the presence of water (e.g. Yen et al. Reference Yen2006) suggests that any O2 related superoxides would have evolved with the main H2O releases that occur below 200°C. The SAM-EGA and GCMS detections of O2, HCl and a variety of chlorinated hydrocarbons produced during pyrolysis of the Rocknest scooped aeolian fines and in multiple drilled mudstone samples collected by Curiosity strongly argue for the presence of martian oxychlorine compounds such as perchlorates and/or chlorates.
Viking GCMS
The overall goal of the Viking GCMS analyses was to search for organics in the martian surface material. The detection of chlorinated hydrocarbons at the Viking Landing sites was thought to be derived solely from terrestrial contamination (Biemann et al. Reference Biemann, Oro, Toulmin, Orgel, Nier, Anderson and Biller1976, Reference Biemann1977). The detection of perchlorate at the Phoenix Landing site promoted a revaluation of the Viking GCMS analysis, which suggested chlorinated hydrocarbon Cl could be derived from martian oxychlorine (e.g. ≤0.1 wt% perchlorate) in the Viking regolith (Navarro-González et al. Reference Navarro-González, Vargas, de la Rosa, Raga and McKay2010). Two regolith samples at each of the Viking Landing sites, Chryse Planitia (VL-1) and Utopia Planitia (VL-2), were analysed using thermal volatilization coupled to GCMS. The first VL-1 sample was acquired on Sol 8 and was primarily comprised of fine-grained material collected from 4 to 6 cm below the surface. A single ~100 mg fraction of this sample was delivered to GCMS oven number 1 analysed on sols 17 and 23 (Biemann et al. Reference Biemann, Oro, Toulmin, Orgel, Nier, Anderson and Biller1976). The second VL-1 sample was collected on sol 31 and consisted of coarse surface material located ~3 m from the sol 8 sample collection site. A single ~100 mg fraction of this sample was delivered to VL-1 oven 2 and analysed and on sols 32, 37 and 43. The first VL-2 GCMS sample, a surface duracrust, was collected on sol 21 and a single ~100 mg fraction was analysed four times (sols 24, 26, 35 and 37) using VL-2 oven 2. The second VL-2 sample was acquired on sol 37 from under Badger Rock and a single ~100 mg fraction was analysed five times (sols 41, 43, 45, 47 and 61) using VL-2 oven 3 (Biemann et al. Reference Biemann1977) (Table 2).
Viking 1 and 2 GCMS results for methyl chloride (CH3Cl) (scan 27) and methylene chloride (CH2Cl2) (scan 89)

The Viking GCMS instruments and sample analysis protocols (Biemann et al. Reference Biemann1974; Rushneck et al. Reference Rushneck, Diaz, Howarth, Rampacek, Olson, Dencker, Smith, McDavid, Tomassian, Harris, Bulota, Biemann, LaFleur, Biller and Owen1978) differed substantially from both the Phoenix TEGA (Boynton et al. Reference Boynton2009) and MSL-SAM (Mahaffy et al. Reference Mahaffy2012) instruments, and consequently the results differed considerably. The TEGA and SAM instruments employed temperature ramps to perform sample thermal volatilization, in contrast, the Viking GCMS instruments, used temperature steps (50, 200, 350 and 500°C) with a 30 s hold time. Also the TEGA and SAM instruments utilized N2 and He carrier gases, respectively, in a flow-through thermal volatilization mode while the Viking GCMS sample thermal volatilization was performed in a sealed sample cell (i.e. no flow) with either a H2 or 13CO2 filled headspace. After the volatilization step, carrier gas (H2) was diverted through the sample cell to inject the sample gases into the Viking GC column. Two other significant differences between the TEGA and SAM instruments and the Viking GCMS, both of which were used to protect the Viking MS from high pressure, were the use of a heated Ag–Pd diffusion tube to reduce the H2 purge gas pressure prior to the MS entrance and the use of a pressure sensitive effluent divider which acted to split and divert fractions of the carrier gas away from the MS as needed. For example as shown in Table 1, 20 : 1 ratio indicates that 20 parts were vented and one part of the gas from the GC column was sent to the MS.
The use of H2 carrier gas in combination with the heated Ag–Pd diffusion tube prevented the detection of O2 (g) due to its reduction into H2O (g) prior to entry into the MS. This limitation, along with the lack of a direct EGA mode (i.e. direct MS injection), eliminates the ability to use O2 (g) release from the sample as a diagnostic for the presence of perchlorate or other oxychlorine species as was done with the TEGA (Boynton et al. Reference Boynton2009) and SAM data sets (Leshin et al. Reference Leshin2013; Glavin et al. Reference Glavin2013; Ming et al. Reference Ming2014). These factors leave the detection of trace amounts of chloromethane (CH3Cl) in the VL-1 subsurface sample and trace amounts of dichloromethane (CH2Cl2) in both VL-2 samples as the sole GCMS evidence for the presence of volatile chlorine species in the Viking samples.
At the time of the initial Viking GCMS analyses, the possibility that the detected CH3Cl and CH2Cl2 might be of martian origin was recognized, however, the detection was attributed potential instrument contamination (Biemann et al. Reference Biemann1979). After the discovery of perchlorate during the Phoenix mission, the suggestion was made that the Viking GCMS CH3Cl and CH2Cl2 detection was due to the presence of perchlorate and organics indigenous to the samples (Navarro-González et al. Reference Navarro-González, Vargas, de la Rosa, Raga and McKay2010); an interpretation that was subsequently debated in the literature (Biemann & Bada, Reference Biemann and Bada2011; Navarro-González & McKay, Reference Navarro-González and McKay2011).
Chloromethane was detected during VL-1 sample analyses and dichloromethane was detected during VL-2 analyses (Table 2). The VL-1 subsurface sample analysis detected 15 ppb of CH3Cl during the first sample heating (200°C) on sol 17. No CH3Cl was detected during the second sample heating (500°C) on sol 23, and no CH2Cl2 was detected in either run. The position of the effluent divider at different times during the sample runs may offer a possible explanation as to why for CH3Cl was only detected in the first VL-1 sample run. During the first run of the subsurface sample, the effluent divider was in a 3 : 1 split at scan number 27 (which corresponds to the elution time of CH3Cl). In contrast, the effluent divider was in a 20 : 1 split ratio, indicating less gas from the GC column was sent to the MS detector, during scan 89 (corresponding to the elution time of CH2Cl2), which may have precluded the detection of CH2Cl2. Likewise, in the analyses of the VL-1 surface sample the effluent divider was closed (carrier gas fully vented) during scan 27 and in a 20 : 1 split ratio during scan 89. These divider positions may have prevented the detection of low levels of CH3Cl and CH2Cl2, generated from VL-1 samples, except when effluent divider was in the lower 3 : 1 split (i.e. during the first run of the subsurface sample at scan 27). Although an in-cruise blank run using the VL-1 oven 1 was performed no CH4 or CH3Cl was detected in this run. Despite a 0 : 1 split ratio at scan 87, no CH2Cl2 (Table 2) or other hydrocarbons were detected in the VL-1 blank run except for trace amounts of Freon-E (Viking cleaning solvent) (Biemann et al. Reference Biemann, Oro, Toulmin, Orgel, Nier, Anderson and Biller1976, Reference Biemann1977), which is an unlikely precursor to CH3Cl.
Dichloromethane was detected in almost all VL-2 duracrust and Badger Rock sample runs; however, CH3Cl was not detected in any of the VL-2 runs. As was the case for the lack of CH2Cl2 detection in the VL-1 data, the lack of CH3Cl detection may possibly be explained by the position of effluent divider during the time of CH3Cl elution. At scan 89, which corresponds to the elution time of CH2Cl2 the effluent divider was in a 0 : 1 split ratio, that is all of the carrier gas was directed into the GC column for all runs except the fourth Badger rock run in which case the divider was in a 20 : 1 ratio position. While for most VL-2 runs the effluent divider was in a 400 : 1 split during scan 27, when CH3Cl would be expected to elute, thus making it difficult to detect CH3Cl.
The apparent incomplete decomposition of perchlorate as indicated by the repeated detection of CH2Cl2 from each of the two VL-2 samples suggests that the proposed concentrations of perchlorate inferred from the Viking GCMS results should be considered a minimum. Because each Viking sample was analysed multiple times, the total amount of CH2Cl2 detected from the VL-2 duracrust sample was 14–32 ppb and the total amount detected from the VL-2 Badger Rock sample was ~34–64 ppb. Furthermore, the detectable levels of CH2Cl2 detected in the final run for each VL-2 sample indicates that not all of the volatile chlorine was released (i.e. the CH2Cl2 did not go to zero). Likewise, the 15 ppb of CH3Cl detected in the VL-1 subsurface run should be considered a minimum because only two runs were performed. The partial decomposition of perchlorate is consistent with the SAM and TEGA results that show relatively slow perchlorate decomposition kinetics occurring over an extended heating period as indicated by O2 and Cl (measured as HCl) evolution over a wide temperature range from the Gale samples sample (Fig. 2).
The possibility that the organic sources of the chlorinated hydrocarbons detected with the Viking GCMS instrument were of martian origin has been questioned (Biemann & Bada, Reference Biemann and Bada2011; Navarro-González & McKay, Reference Navarro-González and McKay2011). The organic sources for the chlorinated hydrocarbons detected by SAM–GCMS have been attributed to terrestrial and martian sources (Glavin et al. Reference Glavin2013; Freissinet et al. Reference Freissinet2015). Chlorobenzene was not detected by the Viking-GCMS but was detected by SAM analyses. The SAM chlorobenzene detection was attributed to the reaction of martian perchlorate thermal decomposition products with both hydrocarbon contamination generated by Tenax sample preconcentrators in the GC system, and to indigenous martian organics (Glavin et al. Reference Glavin2013; Ming et al. Reference Ming2014; Freissinet et al. Reference Freissinet2015). Although benzene contamination may be a poor chlorobezene precursor (Freissinet et al. Reference Freissinet2015), the Viking data provides no evidence for the presence of indigenous aromatic organics that may serve as a chlorobenzene precursor (e.g. aromatic carboxylic acids). Additionally, dichloroalkanes were not detected in the Viking GCMS runs, however, they were detected in the SAM runs and, as was the case for the SAM chlorobezene detections, attributed to both terrestrial organic contaminates and indigenous martian organics (Freissinet et al. Reference Freissinet2015). Similarly, trichloromethane sourced from martian perchlorate-Cl reacting with terrestrial background hydrocarbons was detected by the SAM–GCMS but not detected by Viking-GCMS. Independent of the origin of the hydrocarbon component (contamination or indigenous to Mars) of the detected CH3Cl and CH2Cl2, the lack of the detection of chlorine in the Viking GCMS blank runs, as with the MSL-SAM data (Glavin et al. Reference Glavin2013) strongly suggests a martian origin for the chlorine that is consistent with presence of perchlorate and possibly other oxychlorine species.
Mars science laboratory Chemistry and Mineralogy (CheMin) instrument
The CheMin instrument on MSL performs XRD and X-ray fluorescence (XRF) on scooped soil and drilled rock samples (Blake et al. Reference Blake2012, Reference Blake2013; Bish et al. Reference Bish2013; Vaniman et al. Reference Vaniman2014). Samples are sieved to <150 µm before delivery into a disc-shaped sample cell 8 mm in diameter and 175 µm thick. CheMin uses a Co X-ray source and operates in transmission geometry. A collimated X-ray beam strikes the sample cell, while the sample is agitated by piezoelectric vibrations to achieve different orientations of the grains. Diffracted X-ray photons are detected by a cooled charge coupled device in a two-dimensional (2D) array. The 2D ring patterns are integrated circumferentially to obtain conventional 1D diffraction patterns. CheMin's angular range is ~5–50°2θ with 0.3°2θ full-width at half-maximum resolution at 25°2θ. These large instrumental peak widths (relative to laboratory X-ray diffractometers) limit the ability to accurately determine minor crystalline phases, so that the detection limit of CheMin is ~1–3 wt%. Abundances of crystalline phases and crystal structures of these phases are determined by the Rietveld refinement method (e.g. Young, Reference Young and Young1993), whereas abundances of amorphous, poorly crystalline, and phyllosilicate phases (i.e. poorly ordered phases) are determined by the FULLPAT full-pattern fitting method (Chipera & Bish, Reference Chipera and Bish2002).
SAM data suggest that the abundances of oxychlorine compounds in the Gale Crater sediments are near the detection limit of CheMin (Leshin et al. Reference Leshin2013; Ming et al. Reference Ming2014); however, Rietveld refinements of CheMin data from the Rocknest, John Klein and Cumberland samples have not unequivocally identified oxychlorine minerals (Bish et al. Reference Bish2013; Vaniman et al. Reference Vaniman2014). Akaganeite, β-Fe3+O(OH,Cl), has been detected in CheMin data of John Klein and Cumberland, but for this discussion, akaganeite will not be included as an oxychlorine phase.
Comparisons of laboratory EGA data to SAM data from Rocknest, John Klein, and Cumberland suggest that Ca, Mg and/or Fe perchlorates are possible oxychlorine compounds that contribute to the O2 and HCl signals (Leshin et al. Reference Leshin2013; Glavin et al. Reference Glavin2013; Ming et al. Reference Ming2014). Perchlorate minerals can have several hydration states, dependent on relative humidity (RH) and temperature conditions. A range of perchlorate hydration states for Mg-perchlorate, for example, were evaluated at temperatures and RH relevant to Mars and it was determined that Mg(ClO4)2•6H2O would be the most stable phase on the martian surface (Robertson & Bish, Reference Robertson and Bish2011). Hydrated Mg-perchlorate [Mg(ClO4)2•6H2O] and Ca-perchlorate [Ca(ClO4)2•4H2O] were included in Rietveld refinements of CheMin data of Rocknest (Bish et al. Reference Bish2013) and John Klein and Cumberland (Bish, personal communication); however, these phases refined to zero indicating that these hydrated perchlorates are not present.
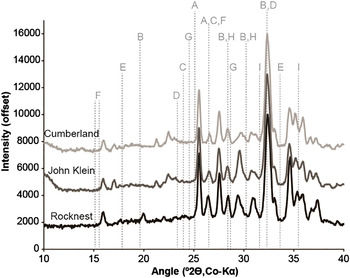
Visual comparisons of the XRD patterns of additional perchlorate and chlorate phases available in the International Centre of Diffraction Data (ICDD) library to the CheMin XRD patterns from Rocknest, John Klein, and Cumberland do not support the presence of crystalline perchlorate or chlorate minerals (Fig. 4). Considering the low abundance of oxychlorine phases in samples from Gale crater and the high background in CheMin data from a significant amorphous component, only the strongest XRD lines of oxychlorine minerals would be detectable in CheMin data. The strongest peaks of some oxychlorine minerals, including Fe(II)-perchlorate•6H2O, anhydrous Ca-chlorate, anhydrous Na-perchlorate, Na-perchlorate•H2O and anhydrous Na-chlorate overlap peaks of common basaltic igneous minerals, so that it would be difficult to detect them in many soils and sediments on Mars (Fig. 4). Strong peaks of other oxychlorine minerals occur at angles lower than common basaltic minerals, so that they could be more easily detected, including Fe(III)-perchlorate•9H2O, Ca-perchlorate•6H2O, Ca-chlorate•2H2O and Mg-chlorate•6H2O. Investigations of these regions of CheMin XRD patterns from Rocknest, John Klein and Cumberland show no evidence for these phases (Fig. 4).
Chemistry and Mineralogy (CheMin) instrument data for the Rocknest, John Klein and Cumberland samples (patterns are offset vertically for clarity, and data >40°2θ are excluded to focus on the region where oxychlorine minerals have reflections. Dashed vertical lines denote the positions of strong XRD peaks of Fe(II)-perchlorate•6H2O (A), Fe(III)-perchlorate•9H2O (B), Ca-perchlorate•6H2O (C), anhydrous Ca-chlorate (D), Ca-chlorate•2H2O (E), Mg-chlorate•6H2O (F), anhydrous Na-perchlorate (G), Na-perchlorate•1H2O (H) and anhydrous Na-chlorate (I). Note: Dashed lines are for indication purposes and do not imply relative intensities of peaks.
Although oxychlorine minerals may be at the detection limit of CheMin, the detection limit is dependent upon the crystallinity of the phase in question and the positions of the strongest XRD lines of that phase. If the oxychlorine phase is poorly crystalline, so that its XRD peaks are broad, then its detection limit with CheMin is much greater than 1–3 wt% (e.g. Bish et al. Reference Bish2013). The low ionic potential of perchlorate and chlorate ions in solution and the very low eutectic temperatures of both perchlorate and chlorate salts may help them precipitate from solution as amorphous phases in martian soils (Toner et al. Reference Toner, Catling and Light2014). If the oxychlorine phase in the Gale sediments is completely amorphous, then it would be undiscernible from other amorphous materials and would contribute to the amorphous hump (i.e. broad, convex-upward background) observed in all CheMin analyses to date (e.g. Rampe et al. Reference Rampe, Morris, Ruff, Horgan, Dehouck, Achilles, Ming, Bish and Chipera2014).
The possibility of a mixture of chlorate and perchlorate also presents a challenge to the CheMin detection of oxychlorine phases in the Gale sediments. The chlorate anion is the most stable intermediate species of the oxidation of chloride to perchlorate (e.g. Hanley et al. Reference Hanley, Chevrier, Berget and Adams2012), and concentrations of perchlorate and chlorate can be equivalent in desert soils on Earth (Rao et al. Reference Rao, Hatzinger, Bohlke, Sturchio, Eckardt and Jackson2010). The subdivision of the oxychlorine concentrations as detected by SAM into equal portions of perchlorate and chlorate would easily cause the individual perchlorate and chlorate abundances to fall below the detection limits of CheMin.
IR spectroscopy
Perchlorates and chlorates have diagnostic spectral features throughout the visible/near-IR (VNIR; ~0.35–2.5 μm) and mid-IR (~5–50 μm). The VNIR features of perchlorates have been characterized using reflectance spectroscopy techniques similar to those used by VNIR spectrometers on remote sensing platforms in orbit around Mars (Morris et al. Reference Morris, Golden, Ming, Graff, Arvidson, Wiseman, Lichtenberg and Cull2009; Cull et al. Reference Cull, Arvidson, Catalano, Ming, Morris, Mellon and Lemmon2010; Bishop et al. Reference Bishop, Quinn and Dyar2014; Hanley et al. Reference Hanley, Chevrier, Barrows, Swaffer and Altheide2015). Mid-IR studies of perchlorates and chlorates (Miller & Wilkins, Reference Miller and Wilkins1952; Pejov & Petruševski, Reference Pejov and Petruševski2002; Bishop et al. Reference Bishop, Quinn and Dyar2014; Hanley et al. Reference Hanley, Chevrier, Barrows, Swaffer and Altheide2015) have utilized reflectance and absorption spectroscopic techniques, which differ substantially from mid-IR emission spectroscopy technique employed at Mars. All of these studies demonstrate that oxychlorine salts have numerous diagnostic spectral features in the mid-IR. These studies show that the anion (ClO4 − or ClO3 −), cation (Na+, Mg2+, Ba2+, Ca2+, K+, etc.) and hydration state all cause systematic variations in the mid-IR spectral properties, making mid-IR spectroscopy a useful diagnostic tool for oxychlorine salts. However, the exact positions, shapes, and intensities of bands vary between measurement techniques (e.g. absorption, reflectance, emissivity). To directly compare laboratory spectra to remote sensing data sets, mid-IR emissivity measurements acquired under appropriate conditions are required. To date, such a database of chlorate and perchlorate salts is not available.
Previous studies have shown that the VNIR reflectance spectra of perchlorates are dominated by the modes of hydration of these samples, and that anhydrous perchlorates have no strong spectral features in the 0.35–2.5 µm spectral range (Morris et al. Reference Morris, Golden, Ming, Graff, Arvidson, Wiseman, Lichtenberg and Cull2009; Cull et al. Reference Cull, Arvidson, Catalano, Ming, Morris, Mellon and Lemmon2010; Bishop et al. Reference Bishop, Quinn and Dyar2014; Hanley et al. Reference Hanley, Chevrier, Barrows, Swaffer and Altheide2015; Ojha et al. Reference Ojha, Wilhelm, Murchie, McEwen, Wray, Hanley, Massé and Chojnacki2015). Bidirectional reflectance spectra of hydrated Na chlorate and perchlorate (Sigma Aldrich reagent grade) were collected to illustrate the characteristic spectral features of hydrated Na chlorate and Na perchlorate. Example spectra were acquired on an ASD FieldSpec3 Max spectrometer at Stony Brook University's Vibrational Spectroscopy Laboratory (VSL) (Fig. 5(a)). Spectra were acquired under ambient conditions with 30° and 0° incidence and emergence angles, respectively, and referenced to an isotropic white spectralon target. A total of 100 spectra of each sample were averaged to create final spectra.
(a) Reflectance and (b) thermal emissivity spectra of sodium chlorate and sodium perchlorate. Shaded region (507–825 cm−1) in (b). indicates region obscured by atmospheric CO2.
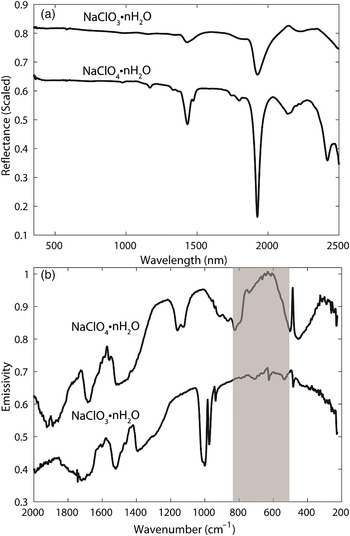
Hydrated Na perchlorate displays two strong bands at 1.43 and 1.93 μm, with additional weaker bands between 1.00 and 2.33 μm (Fig. 5(a)). Hydrated Na chlorate has a more complex spectrum, with major bands at 1.43 and 1.92 μm, with additional weaker bands at between 0.97 and 2.42 μm. The large number of bands may be due to several hydration states being present in the sample. Regardless, it is clear from these data and those of others (e.g. Morris et al. Reference Morris, Golden, Ming, Graff, Arvidson, Wiseman, Lichtenberg and Cull2009; Cull et al. Reference Cull, Arvidson, Catalano, Ming, Morris, Mellon and Lemmon2010; Bishop et al. Reference Bishop, Quinn and Dyar2014), that perchlorates are best identified in the VNIR wavelength region by the positions and shapes of their various H2O vibrational bands. The major perchlorate/chlorate hydration bands at ~1.4 and 1.9 µm are noted as overlapping with other H2O or OH bands from other hydrated phases including sulphates and phyllosilicates, which are also known to occur on Mars. Although the band shapes and exact positions may vary between oxychlorine species, the potential presence of other hydrated phases (e.g. sulphates, phyllosilicates) indicates that care must be taken when determining the presence or absence of oxychlorine from remotely sensed VNIR data.
Figure 5(b) shows mid-IR emissivity spectra of hydrated Na perchlorate and chlorate acquired on VSL's Nicolet 6700 FTIR spectrometer modified to collect emissivity spectra by removing the glowbar IR source and exposing the interferometer to a custom-built environmental chamber. Samples were heated to 80°C and spectra were collected in an environment with CO2 and H2O vapour removed. Spectra were referenced to a blackbody calibration target heated to 70° and 100°C and were calibrated using the methods of Ruff et al. (Reference Ruff, Christensen, Barbera and Anderson1997). A total of 256 spectra of each sample were averaged to create the final spectra.
The major features in the mid-IR emissivity data are due to ClO4 bending and stretching modes. The positions and shapes of the Na perchlorate spectrum are generally similar to those reported in the reflectance data by Bishop et al. (Reference Bishop, Quinn and Dyar2014). The hydrated Na chlorate spectrum has fewer strong features than perchlorate at long wavelengths (12.5–50 μm; 200–800 cm−1), but has a strong split ClO3 stretching mode at 1000 cm−1. The multiple strong spectral features of chlorates and perchlorates in the mid-IR make them good candidates to be identified in thermal emission remote sensing data sets if their concentrations are high enough anywhere on the martian surface (≳5–10 vol%).
IR evidence consistent with presence of hydrated perchlorate and/or chlorate has been detected in select locations on Mars by orbital and landed IR analyses. The Phoenix Lander's Surface Stereo multispectral visible/IR (0.45–1.00 µm) imager has detected an IR hydration feature consistent with the presence of hydrated perchlorates in discrete, concentrated patches at the Phoenix landing site (Cull et al. Reference Cull, Arvidson, Catalano, Ming, Morris, Mellon and Lemmon2010). The Mars Reconnaissance Orbiter's CRISM instrument has also detected hydration features in the VNIR range (6–18 m pixel−1 spatial resolution) consistent with the presence of hydrated perchlorate and chlorate at several locations associated with martian RSL features (Ojha et al. Reference Ojha, Wilhelm, Murchie, McEwen, Wray, Hanley, Massé and Chojnacki2015).
Anhydrous chloride salts have also been remotely detected from orbit using both mid-IR and VNIR instruments (Fig. 6). Chloride salt deposits were initially identified in mid-IR Thermal Emission Imaging System (THEMIS) multispectral images (~100 m pixel−1 spatial resolution) (Osterloo et al. Reference Osterloo, Hamilton, Bandfield, Glotch, Baldridge, Christensen, Tornabene and Anderson2008). These detections were subsequently supported by observations made at VNIR wavelengths with the CRISM instrument (Murchie et al. Reference Murchie2009; Wray et al. Reference Wray, Murchie, Squyres, Seelos and Tornabene2009; Glotch et al. Reference Glotch, Bandfield, Tornabene, Jensen and Seelos2010) and the Observatoire pour la Minéralogie, l'Eau, les Glaces et l'Activité (OMEGA) instrument (Ruesch et al. Reference Ruesch, Poulet, Vincendon, Bibring, Carter, Erkeling, Gondet, Hiesinger, Ody and Reiss2012). Anhydrous chloride salts have no features at either VNIR or mid-IR wavelengths. At VNIR wavelengths, CRISM and OMEGA ratio spectra of chloride salt-bearing surfaces are spectrally featureless, with a distinct red slope (Fig. 6). This spectral behaviour was confirmed in the laboratory, using physical mixtures of halite and flood basalt particulates (Jensen & Glotch, Reference Jensen and Glotch2011). At mid-IR wavelengths, chloride salts are spectrally featureless and have an emissivity less than unity. This leads to distinct blue spectral slopes observed in THEMIS and thermal emission spectrometer (TES) data (Osterloo et al. Reference Osterloo, Hamilton, Bandfield, Glotch, Baldridge, Christensen, Tornabene and Anderson2008, Reference Osterloo, Anderson, Hamilton and Hynek2010; Glotch et al. Reference Glotch, Bandfield, Tornabene, Jensen and Seelos2010) and laboratory emissivity spectra (Glotch et al. Reference Glotch, Bandfield, Wolff and Arnold2013, Reference Glotch, Bandfield, Wolff, Arnold and Che2016). Recently acquired mid-IR emissivity spectra of the Jensen & Glotch (Reference Jensen and Glotch2011) halite/basalt sample suite, in combination with a hybrid light scattering/Hapke radiative transfer model has constrained the salt abundance at Martian chloride deposits to ~10–25 vol%, with the remaining component being the regional silicate regolith (Glotch et al. Reference Glotch, Bandfield, Wolff and Arnold2013, Reference Glotch, Bandfield, Wolff, Arnold and Che2016).
Examples of THEMIS and CRISM data covering chloride-bearing deposits on Mars in Noachis Terra. Images are centered at 347.1E, −40.6N. (a) THEMIS decorrelation stretched image mosaic utilizing band 9, 6 and 4 as R, G and B. Chloride deposits appear bright green around the ejecta of the crater located in the center of the figure. The black (chloride) and white (background regolith) boxes show the locations for spectra displayed in Fig. 6(c) from THEMIS image I15341006. (b) The ISLOPE parameter from CRISM image FRT000109DF overlayed on the THEMIS mosaic. Bright blue areas (negative parameter values) are a good proxy for chloride deposits. The black (chloride) and white (background regolith) boxes show the locations for spectra displayed in Fig. 6(d). (c) THEMIS spectra acquired both on and off the chloride salt deposit. The chloride deposit exhibits shallower spectral contrast and a slight blue slope compared with the regional regolith. (d) CRISM ratio I/F spectrum of the chloride deposit, showing a generally featureless red slope. Features near 2000 nm are atmospheric artefacts. The chloride deposit and local regolith spectra used to make the ratio spectrum are also shown.

Despite the orbital IR detections of hydrated-perchlorate and hydrated-chlorate in select martian RSL features, chlorate or perchlorate have not been identified in the chloride bearing regions by IR remote sensing instruments orbiting Mars (Glotch et al. Reference Glotch, Bandfield, Tornabene, Jensen and Seelos2010; Osterloo et al. Reference Osterloo, Hamilton, Bandfield, Glotch, Baldridge, Christensen, Tornabene and Anderson2008, Reference Osterloo, Anderson, Hamilton and Hynek2010). This is in stark contrast to hyperarid deserts (e.g. Atacama Desert, Antarctic Dry Valleys), where halide salts and silicates are often mixed or layered with various other phases such as nitrates, perchlorate and chlorate phases (e.g. Sutter et al. Reference Sutter, Dalton, Ewing, Amundson and McKay2007; Rao et al. Reference Rao, Hatzinger, Bohlke, Sturchio, Eckardt and Jackson2010; Jackson et al. Reference Jackson2015). Furthermore, the detection of oxychlorine phases at the Phoenix and Gale Crater landing sites suggests that where Cl concentrations are high as in these martian chloride deposits, perchlorates/chlorates should be present, but have yet to be detected by orbital IR analyses. As will be discussed below, the oxychlorine/total Cl ratio has been shown to vary between and within landing sites. Thus it is likely that concentration of oxychlorine phases in these chloride bearing regions is below orbital IR detection limits.
Total Cl versus oxychlorine relationships
The detection of oxychlorine species at the Phoenix, Gale Crater, RSL features and arguably at the Viking landing sites suggests that oxychlorine formation on Mars is likely a global process. Chlorine analysis of sediments at the Phoenix and Gale Crater landing sites suggests that global martian Cl should contain an oxychlorine-Cl component that can range from 10 to 86 mol% of total measured Cl. The average soluble perchlorate and chloride concentration in the three sample solutions analysed by WCL at the Phoenix landing site was 2.5 ± 0.1 and 0.4 ± 0.2 mM, respectively (Fang et al. Reference Fang, Oberlin, Ding and Kounaves2015). The molar oxychlorine-Cl amount in the Phoenix soils could therefore be ~86% of the total chlorine in the sample. Gale Crater total Cl as determined by the Alpha Proton X-ray Spectrometer (APXS) and oxychlorine as determined by SAM-EGA indicate that the oxychlorine-Cl molar fraction is lower relative to the Phoenix landing site and varies from ~10 to 40% of total Cl (Archer et al. Reference Archer2015). This suggests that if the molar Cl in oxychlorine is only 10% of the total Cl in a 25 vol% chloride bearing region, then the oxychlorine phases could occur below the THEMIS detection limits (~5–10 vol %).
Oxychlorine and total Cl data from the Phoenix and Gale landing sites may be used to constrain oxychlorine levels at sites where only total Cl data is available. Total chlorine has been determined for a wide variety of locations from orbit by the GRS on the Mars Odyssey spacecraft (Keller et al. Reference Keller2006) as well as in situ by every landed mission to date (Table 1). Chlorine concentrations determined from orbit by the GRS were for a 440–540 km diameter footprint in the top meter that occurred roughly between 45°S and 45°N latitude (Boynton et al. Reference Boynton2002; Keller et al. Reference Keller2006). The Viking missions utilized XRF spectroscopy to examine scooped samples for total Cl (Clark et al. Reference Clark, Baird, Rose, Toulmin, Christian, Kelliher, Castro, Rowe, Keil and Huss1977). The Mars Pathfinder, Mars Exploration Rover and Mars Science Laboratory missions utilized APXS to determine in situ total chemistry including Cl of soil, sediment and rock (e.g. Rieder et al. Reference Rieder, Economou, Wanke, Turkevich, Crisp, Brückner, Dreibus and McSween1997; Brückner et al. Reference Brückner, Dreibus, Rieder and Wänke2003; Rieder et al. Reference Rieder2004; Clark et al. Reference Clark2005; Gellert et al. Reference Gellert2006; Morris et al. Reference Morris2006; Ming et al. Reference Ming2008; Blake et al. Reference Blake2013; Gellert et al. Reference Gellert2013; Arvidson et al. Reference Arvidson2014) (Table 1).
The fraction of oxychlorine relative to total chlorine can vary from site to site (10–95%) as is evident in the Phoenix and Gale data sets, which can make it difficult to ascertain what oxychlorine value to apply to a particular site with no oxychlorine measurements. However, knowledge of the type of material in which the oxychlorine was detected may provide constraints as to where a particular oxychlorine concentration can be applied elsewhere on Mars. The Rocknest eolian deposit in Gale Crater, for example, has eolian features (coarse-grained, indurated, bright dust-coated surface over darker finer sediment) and total chemistry similar to coarse-grained eolian deposits observed at both MER landing sites (Blake et al. Reference Blake2013). The similarity of eolain materials between the MER and Gale landing sites could be argued as the result of global process that also leads to similar oxychlorine concentrations at in all soil and windblown sediments. The Rocknest oxychlorine component consists of ~36% of total chlorine (Archer et al. Reference Archer2015), which suggests that a similar fraction of oxychlorine-Cl may be present in the coarse-grained eolian deposits at the MER landing sites.
Oxychlorine species are likely to be globally distributed but the amount of oxychlorine as a percentage of total chlorine will likely vary from location to location. However, if two spatially different sites have materials with similar geologic properties (e.g. geochemistry, mineralogy, particle size distribution), then the oxychlorine/total Cl ratio of one site could potentially be used to constrain the oxychlorine concentration at the other site that has a known total Cl concentration.
Measurement challenges and alternative oxychlorine analytical techniques
The characterization of oxychlorine in martian sediments can be challenging because of the of low (<1 wt%) oxychlorine concentrations, difficulty in identifying the oxychlorine species present, and ensuring evolved O2 as detected by EGA is attributed to oxychlorine. XRD and IR analysis detection limits for oxychlorine are >1 wt% and ~>5–10 vol%, respectively. EGA while useful in detecting low oxychlorine concentrations (e.g. 0.1 wt% Table 1) can encounter difficulty in identifying which oxychlorine phases is present (e.g. chlorate versus perchlorate). The temperature in which O2 is evolved can be used to identify which oxychlorine species is present; however, Fe phases in the sample can alter oxychlorine decomposition temperatures causing difficulties in identifying oxychlorine species. Furthermore, EGA of other gases, total chemistry (e.g. APXS), and/or XRD data may be required to rule out other non-oxychlorine sources of evolved O2. The WCL ion-selective sensor has provided the only direct detection of oxychlorine as perchlorate in the martian soil. However, chlorate and nitrate could also have been present in the soil but were not detected because all three anions are only detectable by that ion-selective sensor. The presence of perchlorate in this case, inhibited the detection of the chlorate and nitrate. Future analysis of Mars soils or sediments with ion-selective sensors could continue to encounter this problem especially if lower concentrations of nitrate, perchlorate, and chlorate are present. The ion-selective sensor, in this case, would not be able to determine the proportion of perchlorate, chlorate and nitrate present in the sample. A potential solution to this problem would be to use an array of ISEs comprised of individual sensors where each possess different selectivity to the various oxy ions. For example, using 3 × 3 ISEs with ionophores of different selectivity for each of ClO4 −, ClO3 − and NO3 − would then allow for use of a chemometric identification method of the individual responses and determination the respective concentrations.
The development of microfluidic devices also offers another suitable alternative for identifying and quantifying oxychlorine on future landed robotic missions to Mars. Several microchip based systems, which include isotachophoresis (ITP), ITP-capillary electrophoresis (ITP-CE), capillary electrophoresis (CE) and ion chromatography (IC) on a chip are being developed for terrestrial purposes (e.g. Evenhuis et al. Reference Evenhuis, Guijt, Macka and Haddad2004; Haddad et al. Reference Haddad, Nesterenko and Buchberger2008). The reader is referred to the relevant literature for more detailed account of research and development of anion solution analysis using microchip technology (e.g. Murrihy et al. Reference Murrihy2001; Evenhuis et al. Reference Evenhuis, Guijt, Macka and Haddad2004; Haddad et al. Reference Haddad, Nesterenko and Buchberger2008). Briefly, the main purpose in developing this ‘lab-on-a-chip’ technology for terrestrial needs is that less time, less sample and less reagents along with lower power requirements are required for analyses (Evenhuis et al. Reference Evenhuis, Guijt, Macka and Haddad2004). These attributes coupled with small instrument size are desirable for planetary instrumentation. The requirement of soil solution extracts for analysis can add a layer of complexity to overall instrument design that does not exist for IR, EGA and Chemin like XRD instruments. However, these microfluidic devices can detect much lower anion concentrations (~0.1 wt%) than IR and XRD techniques. Furthermore, microfluidic devices have the potential to more easily than EGA, to discriminate between chlorite (ClO2 −), chlorate, and perchlorate phases without interferences from each other and other solution constituents (Evenhuis et al. Reference Evenhuis, Guijt, Macka and Haddad2004).
Summary
Chlorine was first detected on the surface of Mars by the Viking Landers at concentrations only found in arid environments on Earth. The species of Cl has long thought to be in chloride form (e.g. Clark & Baird, Reference Clark and Baird1979). The Phoenix Lander's WCL analysis; however, yielded the surprising result that more than 86% of the soluble Cl consisted of perchlorate. The Phoenix Landers's TEGA instrument detected an evolved O2 release from the Phoenix soil which supported the WCL perchlorate detection. The MSL rover's SAM instrument has also detected the presence of evolved O2, HCl and chlorinated hydrocarbons consistent with the presence of perchlorate and/or chlorate salts. Further evaluation of the Viking GCMS data suggests that martian oxychlorine phases may have been detected in the Viking soils.
Perchlorate or chlorate salts have not been detected in Gale crater by CheMin. The lack of detection for oxychlorine phases could be attributed to several factors: (1) The oxychlorine phases could be poorly crystalline; (2) the oxychlorine abundance could be split between chlorate and perchlorate which drives the concentrations of these two species below the CheMin detection limits; and/or (3) the oxychlorine phases are at CheMin detection limits but are obscured by other basaltic phases present.
Orbital IR analysis has detected evidence consistent with the presence of hydrated perchlorate and chlorate in areas possessing RSL features. The co-occurrence of oxychlorine phases with Cl suggests that where ever Cl is detected the perchlorate or chlorate should be present. However, no evidence of perchlorate or chlorate has been observed especially in the anhydrous chloride enriched regions (up to 25 vol%) of Mars. Perhaps a physical/chemical mechanism may be operating that inhibits the formation or persistence of detectable oxychlorine in these chloride-rich regions.
Although the surface oxychlorine concentrations detected thus far by landed missions are below the orbital IR detection limits, a targeted search for oxychlorine phases in chloride rich regions may yield positive identification if abundances occur at the 5–10 vol% level. There are challenges in detecting oxychlorine phases by remote IR observations; however, oxychlorine/total Cl ratios obtained from the landed MSL and Phoenix missions has the potential to constrain oxychlorine levels at other locations where total Cl values have been or will be determined.
The development of microfluidic devices or ‘lab-on-a-chip’ technology may offer a suitable alternative for identifying and quantifying oxychlorine on future landed robotic missions to Mars. The small instrument size coupled with sensitivity to low anion concentrations, and the ability to identify individual oxychlorine species without interferences from other anions make microfluidic devices an attractive technology. Such instrumentation has the potential to make significant advancement in understanding the distribution and concentration of oxychlorine species and other soluble anions (e.g. nitrate, sulphate, phosphate, fluoride and chloride) on Mars.
Acknowledgements
We thank Deanne Rogers for processing the atmospherically corrected THEMIS scene used in this work (Fig. 6). This paper was written in response to the Perchlorate on Mars workshop (NASA Ames Research Center, Dec. 13–14, 2014). We thank the workshop organizers for bringing together leading perchlorate researchers to discuss this important topic that is relevant to Mars exploration. B.S., P.D.A, D.P.G., E.B.R. and D.W.M. gratefully acknowledge support from the Mars Science Laboratory mission. We are grateful to the anonymous reviewer who provided helpful comments that significantly improved this manuscript.



