The global population aged 60 years and older is rapidly expanding, projected to grow from 962 million in 2017 to 1·4 billion by 2030 and more than double by 2050, reaching 2·1 billion(1). In response, the WHO emphasizes maintaining functional capacity as a cornerstone of healthy ageing(1). Ageing is characterized by the accumulation of exogenous and endogenous stressors that activate inflammatory pathways, resulting in elevated levels of pro-inflammatory mediators such as IL-1β, IL-4, IL-6, TNF-alpha and C-reactive protein. This chronic, low-grade and ‘sterile’ inflammatory state contributes substantially to functional decline and age-related diseases(Reference Kennedy, Berger and Brunet2), including deterioration of the heart(Reference Ferrucci and Fabbri3), lungs(Reference Meiners, Eickelberg and Konigshoff4) and skeletal muscle(Reference Moiseeva, Cisneros and Sica5), as well as CVD(Reference Liberale, Badimon and Montecucco6).
Cardiorespiratory fitness (CRF), a comprehensive measure of cardiovascular, pulmonary and muscular function(7), is a strong independent predictor of CVD and all-cause mortality(Reference Wei, Kampert and Barlow8). As a reflection of overall health and functional capacity(Reference Kaminsky, Arena and Beckie9), CRF declines with age and is closely associated with future cardiovascular risk. Improving CRF through lifestyle interventions can enhance physiological functions and reduce risks of dyslipidemia, hyperglycaemia, CVD and mortality(Reference Sui, Sarzynski and Lee10–Reference Lee, Sui and Artero13).
Despite growing recognition of CRF’s importance, evidence on dietary strategies to optimize CRF in community-dwelling older adults is limited and inconsistent. While some studies report that adherence to healthy patterns such as the Mediterranean diet or the Alternative Healthy Eating Index(Reference Mi, Gajjar and Walker14) improves CRF, others find no benefit from the Dietary Approaches to Stop Hypertension diet or the Diet Quality Index-International(Reference Chan, Yau and Yu15). Low-grade inflammation has been consistently linked to reduced CRF(Reference Aronson, Sella and Sheikh-Ahmad16), suggesting that mitigating inflammation through dietary modifications could help preserve CRF and intrinsic capacity in ageing populations.
Diet strongly influences inflammation: higher intake of refined starches, sugars and saturated fats is associated with elevated pro-inflammatory cytokines(Reference Giugliano, Ceriello and Esposito17), whereas fruits, vegetables and polyunsaturated fatty acids, particularly alpha-linolenic acid, exert anti-inflammatory effects(Reference Giugliano, Ceriello and Esposito17,Reference Zhao, Etherton and Martin18) . Since foods and nutrients are consumed in combination, dietary pattern analyses offer a holistic approach to assess diet–health relationships. The Dietary Inflammatory Index (DII), a literature-based tool evaluating intake of 45 pro- and anti-inflammatory dietary components, estimates the inflammatory potential of the overall diet(Reference Shivappa, Steck and Hurley19). Higher DII scores indicate pro-inflammatory diets, whereas lower scores reflect anti-inflammatory patterns. Accumulating evidence shows that lower DII scores correlate with reduced inflammatory biomarkers (e.g., IL-6, TNF-alpha and C-reactive protein) and decreased risk of premature death(Reference Corley, Shivappa and Hebert20–Reference Hariharan, Odjidja and Scott23). However, studies examining the impact of anti-inflammatory diets on CRF remain scarce. One study among 270 healthy younger adults (18–45 years) in Tehran suggested that pro-inflammatory diets may be linked to lower CRF(Reference Payandeh, Shahinfar and Babaei24). Yet, as CRF is influenced by age, sex, physical activity and ethnicity, these findings may not translate to older adults.
Given the rising ageing population and the role of inflammation in both CRF and chronic disease, further research is warranted. We hypothesized that diets with greater anti-inflammatory potential would be associated with better CRF in older adults. To test this, we conducted a cross-sectional study examining the relationship between DII scores and CRF in Chinese community-dwelling older adults.
Methods
Study population
This study utilized data from the Guangzhou Nutrition and Health Study, an ongoing community-based prospective cohort(Reference Ling, Zhong and Zeng25). Between 2008 and 2010, 3169 participants aged 46–85 years were recruited, all residing in Guangzhou, South China, for at least five years at enrolment. Follow-up assessments have been conducted every 2–3 years. By May 2023, three follow-ups had been completed, and the fourth was ongoing. Baseline and follow-up assessments included structured questionnaires, blood pressure, anthropometric measurements and fasting blood collection.
During the third follow-up (2018–2020), 2525 participants were evaluated. CRF assessment, using a submaximal constant work rate protocol on an electromagnetically braked cycle ergometer, was introduced during the latter part of this follow-up and continued into the fourth. Of these participants, 1054 completed the CRF test and provided valid data. Dietary intake, physical activity and covariates were assessed at the third follow-up. CRF was based on the first available valid measurement at the third follow-up, or from the fourth follow-up if no valid CRF data were available at the third follow-up.
A total of 148 individuals were excluded for the following reasons: missing data on the FFQ (n 1); self-reported cancer (n 32); implausible energy intake (<500 or >3500 kcal/d for women, <800 or >4000 kcal/d for men; n 39); missing data on CHD (n 15), chronic respiratory disease (n 1) or other key covariates (e.g., family income, body fat percentage; n 60). The final analysis included 906 participants with complete dietary and CRF data. The study was registered at ClinicalTrials.gov (NCT03179657) and approved by the institutional ethics committee. Written informed consent was obtained from all participants.
Calculation of the Dietary Inflammatory Index
Dietary intake data were collected during the third follow-up using a validated seventy nine-item quantitative FFQ(Reference Zhang and Ho26). Energy and nutrient intakes were calculated based on the Chinese Food Composition Table (2009 Edition). DII scores were computed following established methodology(Reference Shivappa, Steck and Hurley19,Reference Ruiz-Canela, Bes-Rastrollo and Martinez-Gonzalez27) . Briefly, the DII was derived from a literature review (1950–2010) associating forty-five dietary components with inflammatory markers (IL-1β, IL-4, IL-6, IL-10, TNF-alpha and C-reactive protein). Each component was assigned an inflammatory effect score, which was multiplied by standardized intake values to generate an overall score, ranging from maximally anti-inflammatory to maximally pro-inflammatory.
In this study, thirty-two dietary parameters were available for DII calculation. These included pro-inflammatory components (energy, carbohydrate, protein, fat, cholesterol, saturated fat, vitamin B12 and iron) and anti-inflammatory components (fibre, monounsaturated fat, polyunsaturated fat, n-3 and n-6 fatty acids, niacin, vitamins A, B1, B2, B6, C, D and E, magnesium, zinc, selenium, folate, beta-carotene, flavan-3-ols, flavones, flavonols, anthocyanidins, isoflavones and flavanones).
Assessment of cardiorespiratory fitness
CRF was assessed via a submaximal steady-state cycling test on an electromagnetically braked ergometer (Cortex, Leipzig, Germany) with breath-by-breath gas analysis (MetaLyzer®3b, Cortex). A constant work rate protocol(7) was used to ensure safety, excluding participants who had used β-blockers within the preceding week. Individualized workloads were determined by age, body weight and habitual physical activity(Reference Ferguson28). After a 15-min seated rest for blood pressure and oxygen saturation assessment and a 3-min unloaded warm-up (0 W), participants cycled for 6 min (or until volitional fatigue) at the target workload, maintaining ≥60 rpm. Expired gases were collected continuously to derive peak oxygen uptake (VO2peak, L/min), and VO2max was estimated using the Åstrand–Ryhming Nomogram with age-correction factors(Reference Astrand and Ryhming29). Heart rate was continuously monitored (Polar H10, Kempele, Finland), and predicted maximal heart rate was calculated as 207 – 0·7 × age(Reference Ferguson28,Reference Gellish, Goslin and Olson30) . Relative intensity was expressed as %HRmax (actual/predicted)(Reference Garber, Blissmer and Deschenes31), with higher VO2max and lower %HRmax indicating better CRF(7).
Covariates
Sociodemographic, lifestyle and medical data, including physical activity, were collected via face-to-face interviews using a standardized questionnaire during the third follow-up. Household income was categorized as ≤2000, 2000–3000 or >3000 yuan/month/person. Physical activity (exercise, leisure, household, occupational and daily activities) was assessed with a nineteen-item questionnaire and expressed as metabolic equivalents (MET-h/d)(Reference Ainsworth, Haskell and Herrmann32). Multivitamin use was defined as taking ≥30 tablets in the past year. Smoking was defined as ≥1 cigarette/d for ≥6 months; alcohol use as ≥1 drinking occasion per week for ≥6 months.
Blood pressure was measured on the left arm (brachial artery) after 10 min of rest using a mercury sphygmomanometer. Two readings were averaged, with a third taken if discrepancies exceeded predefined thresholds. Hypertension was defined as: (1) physician-diagnosed; (2) use of antihypertensive medication; or (3) systolic blood pressure ≥140 mmHg or diastolic blood pressure ≥90 mmHg. Diabetes was defined as: (1) fasting glucose ≥7·0 mmol/L; (2) HbA1c ≥6·5 %; or (3) use of antidiabetic medication. Abnormal lipids were defined as total cholesterol >5·2 mmol/L or high-density lipoprotein cholesterol <1·0 mmol/L(Reference Li, Zhao and Zhao33,Reference Grundy, Stone and Bailey34) . Weight and height were measured with participants barefoot and in light clothing. Body fat percentage was assessed using dual-energy X-ray absorptiometry (Discovery W; Hologic Inc.) of whole-body scans.
Statistical analysis
Continuous variables were expressed as mean (standard deviation) for normally distributed data, or median (interquartile range) for non-normally distributed data. Categorical variables were summarized as frequencies and percentages. Baseline characteristics of men and women were compared using Student’s t-test for normally distributed continuous variables, the Mann–Whitney U test for skewed continuous variables and the χ2 test for categorical variables. Participants were stratified into sex-specific tertiles by DII score: T1 (anti-inflammatory), T2 and T3 (pro-inflammatory).
ANCOVA tested differences in CRF across DII tertiles, adjusting for confounders. Model 1 adjusted for age; Model 2 additionally adjusted for household income, body fat percentage, physical activity, smoking, alcohol use, multivitamin use, chronic respiratory disease, CHD, diabetes, hypertension, total cholesterol and high-density lipoprotein cholesterol. Adjusted means ± se were reported. Linear trends were tested by modelling median DII values as a continuous variable.
Multivariate logistic regression examined associations between DII tertiles and favourable CRF, with T3 (pro-inflammatory) as the reference. Favourable CRF was defined as the highest sex-specific quartile of VO2max(Reference Kim35) or %HRmax <85 %(Reference Garber, Blissmer and Deschenes31). OR and 95 % CI were calculated, adjusting for the same covariates as ANCOVA. Linear trends were tested as described above.
Subgroup analyses were performed by median values of physical activity, age, sex, body fat percentage, household income (≥3000 yuan/month/person) and by hypertension and diabetes status to assess variations in the associations between DII tertiles and CRF. Interactions between DII and these variables were evaluated using multiplicative terms in multivariable-adjusted models.
To evaluate the association between long-term changes in dietary inflammatory potential and CRF, we analysed 672 participants with dietary data at both the cohort baseline (2008–2010) and the third follow-up (2018–2020). Participants were categorised into sex-specific DII tertiles at both time points, forming nine dietary inflammatory patterns. Associations with favourable CRF were examined, using the high-high (persistently pro-inflammatory) group as reference.
Statistical analyses were conducted using SPSS version 25.0 (SPSS Inc.) and Stata version 17.0 (StataCorp, College Station, TX). All tests were two-sided, and a P-value < 0·05 was considered statistically significant.
Results
Participant characteristics
Among 906 participants (67·9 % women; mean age, 65·9 ± 5·4 years), men had lower DII scores, body fat percentage, total cholesterol, high-density lipoprotein cholesterol and LDL cholesterol, but were older and exhibited higher weight, BMI and prevalence of smoking, alcohol consumption, hypertension and diabetes. Men demonstrated higher VO2max yet lower %HRmax than women (both P < 0·05) (Table 1).
Baseline characteristics of the study participants (n 906)

Table 1. Long description
A table comparing baseline characteristics of study participants. The table has 18 rows and 7 columns. Column headers are Variables, All (n 906), Women (n 615), Men (n 291), and P-value. Row labels include Dietary Inflammatory Index scores, Age, Household income, Weight, BMI, Body fat percentage, Smoker, Alcohol drinker, Multivitamin use, Physical activity, Systolic blood pressure, Diastolic blood pressure, Hypertension, Type 2 diabetes, CHD, Chronic respiratory diseases, Total cholesterol, Triglycerides, HDL cholesterol, LDL cholesterol, VO2max, and %HRmax. Each row provides mean, standard deviation, or percentage values for each category. Notable trends include differences in Dietary Inflammatory Index scores, age, weight, BMI, body fat percentage, smoking, alcohol consumption, physical activity, blood pressure, hypertension, type 2 diabetes, cholesterol levels, and VO2max between men and women.
MET, metabolic equivalent of task; %HRmax, percentage of actual maximum heart rate relative to predicted maximum heart rate.
Data are presented as mean (standard deviation) for normally distributed variables, median (interquartile range) for skewed variables and n (%) for categorical variables. P-values were calculated using Student’s t-test, Mann–Whitney U test or χ2 test, as appropriate.
Dietary inflammatory potential and cardiorespiratory fitness
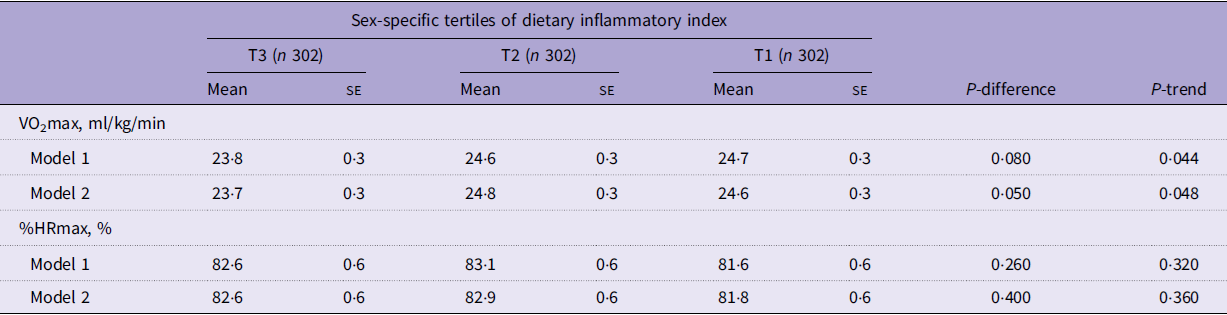
Participants adhering to more anti-inflammatory diets (lowest DII tertile) exhibited higher VO2max and lower %HRmax than those with pro-inflammatory diets (highest tertile) in fully adjusted analyses. VO2max demonstrated a significant linear trend across DII tertiles (P-trend = 0·048), whereas %HRmax did not (P-trend = 0·356) (Table 2).
Associations of dietary inflammatory index with cardiorespiratory fitness parameters (adjusted mean and standard error)

Table 2. Long description
A table comparing dietary inflammatory index with cardiorespiratory fitness parameters. The table has 6 rows and 10 columns. Column headers are: T3 (n 302), T2 (n 302), T1 (n 302), P-difference, and P-trend. Row labels are: VO2max, ml/kg/min Model 1, VO2max, ml/kg/min Model 2, %HRmax, % Model 1, and %HRmax, % Model 2. Row 1: VO2max, ml/kg/min Model 1: T3 Mean 23.8, SD 0.3; T2 Mean 24.6, SD 0.3; T1 Mean 24.7, SD 0.3; P-difference 0.080; P-trend 0.044. Row 2: VO2max, ml/kg/min Model 2: T3 Mean 23.7, SD 0.3; T2 Mean 24.8, SD 0.3; T1 Mean 24.6, SD 0.3; P-difference 0.050; P-trend 0.048. Row 3: %HRmax, % Model 1: T3 Mean 82.6, SD 0.6; T2 Mean 83.1, SD 0.6; T1 Mean 81.6, SD 0.6; P-difference 0.260; P-trend 0.320. Row 4: %HRmax, % Model 2: T3 Mean 82.6, SD 0.6; T2 Mean 82.9, SD 0.6; T1 Mean 81.8, SD 0.6; P-difference 0.400; P-trend 0.360.
T, tertile; %HRmax, percentage of actual maximum heart rate to predicted maximum heart rate; DII, Dietary Inflammatory Index; SE, standard error.
Sex-specific tertiles for DII score were defined as follows. For men: T1 (≤ −1·13), T2 (–1·12 to 0·77) and T3 (≥0·78). For women: T1 (≤−0·75), T2 (–0·74 to 1·45) and T3 (≥1·46).
Model 1: Adjusted for age.
Model 2: Model 1 further adjusted for household income, body fat percentage, physical activity, smoking status, alcohol consumption, multivitamin use, CHD, chronic respiratory diseases, hypertension, diabetes and serum levels of total cholesterol and high-density lipoprotein cholesterol.
P for trend was calculated by assigning medians to each DII tertile as a continuous variable in the models.
Dietary inflammatory potential and favourable cardiorespiratory fitness
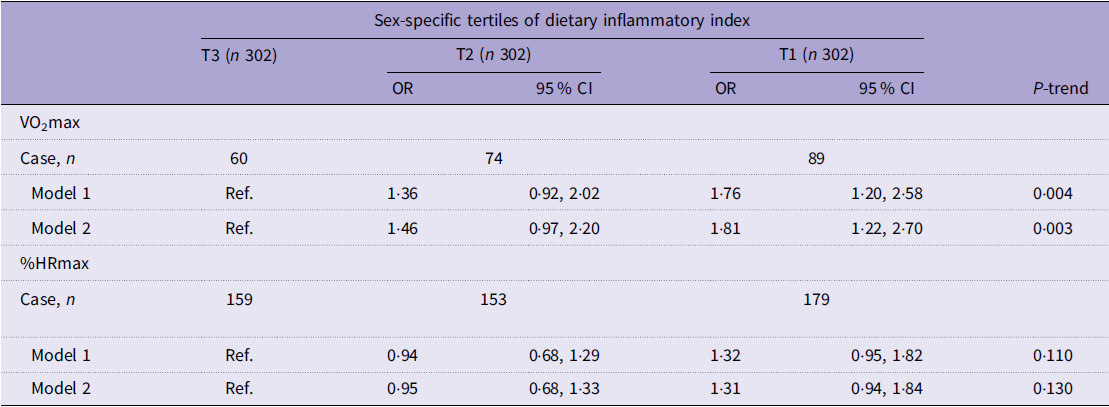
Compared with the highest DII tertile, participants in the lowest tertile had 81 % higher odds of high VO2max (OR 1·81; 95 % CI, 1·22–2·70; P-trend = 0·003). Although not statistically significant, they also showed a tendency toward %HRmax <85 % of predicted (OR 1·31; 95 % CI, 0·94–1·84), suggesting improved exercise tolerance (Table 3).
Associations of dietary inflammatory index with favourable cardiorespiratory fitness (OR and 95 % CI)

Table 3. Long description
A table with four rows and three columns comparing sex-specific tertiles of dietary inflammatory index with VO2max and %HRmax. The columns are labeled T3 (n 302), T2 (n 302), and T1 (n 302), with median and IQR values for each tertile. The rows are labeled VO2max and %HRmax, with sub-rows for Case, n, Model 1, and Model 2. For VO2max, the median values for T3, T2, and T1 are 1.36, 1.76, and Ref. respectively, with corresponding IQR values. For %HRmax, the median values for T3, T2, and T1 are 0.94, 1.32, and Ref. respectively, with corresponding IQR values. The table includes P-trend values for each metric.
T, tertile; Ref, reference; %HRmax, percentage of actual maximum heart rate relative to predicted maximum heart rate.
Favourable cardiorespiratory fitness was defined as the highest quartile of sex-specific VO2max or %HRmax being less than 85 % of predicted heart rate.
Model 1: Adjusted for age.
Model 2: Model 1 further adjusted for household income, body fat percentage, physical activity, smoking status, alcohol consumption, multivitamin use, CHD, chronic respiratory diseases, hypertension, diabetes and serum levels of total cholesterol and high-density lipoprotein cholesterol.
P for trend was calculated by assigning medians to each Dietary Inflammatory Index tertile as a continuous variable in the model.
Stratified analyses
A borderline significant interaction emerged between DII and physical activity on CRF (P-interaction = 0·049) (Figure 1). Among participants with higher physical activity (>30·18 MET-h/d), adherence to an anti-inflammatory diet was associated with nearly threefold higher odds of high VO2max (adjusted OR 2·94; 95 % CI, 1·66–5·21). However, the wide CI in this subgroup analysis suggests this finding should be interpreted with caution. An association was not observed in those with lower activity levels. No other interactions were significant.
Stratified ORs and 95 % CIs for high VO2max according to tertiles of DII. Models were adjusted for age, household income, body fat percentage, physical activity, smoking status, alcohol consumption, multivitamin use, CHD, chronic respiratory diseases, hypertension, diabetes and serum levels of total cholesterol and high-density lipoprotein cholesterol. T, tertile; Ref, reference; DII, Dietary Inflammatory Index; MET, Metabolic Equivalent of Task; Y/M/P, Yuan/Month/Person.

Prior Dietary Inflammatory Index changes and subsequent cardiorespiratory fitness
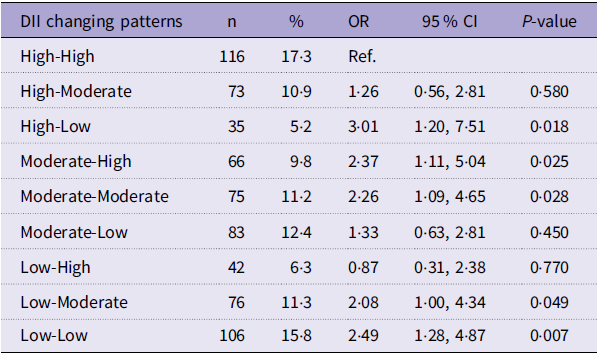
In 672 participants whose diets were assessed over a median of 9·5 years prior to fitness testing, those shifting from a pro- to an anti-inflammatory diet (high–low) were over three times more likely to exhibit favourable CRF compared with participants maintaining high DII scores (OR 3·01; 95 % CI, 1·20–7·51; P = 0·018). Conversely, transitioning from a low to high DII (low–high) showed no significant association with favourable CRF (OR 0·87; 95 % CI, 0·31–2·38), while persistently low DII (low–low) was associated with significantly elevated odds (OR 2·49; 95 % CI, 1·28–4·87; P = 0·007) (Table 4).
Associations of 9·5-year change in DII tertiles with favourable cardiorespiratory fitness (n 672)

Table 4. Long description
A table titled Associations of 9.5-year change in DII tertiles with favourable cardiorespiratory fitness. The table has 8 rows and 6 columns. The columns are labeled DII changing patterns, n, percent, OR, 95 percent CI, and P-value. The rows list different diet change patterns and their associated statistics. Row 1: High-High, 116, 17.3, Ref., Ref., Ref. Row 2: High-Moderate, 73, 10.9, 1.26, 0.56, 2.81, 0.580. Row 3: High-Low, 35, 5.2, 3.01, 1.20, 7.51, 0.018. Row 4: Moderate-High, 66, 9.8, 2.37, 1.11, 5.04, 0.025. Row 5: Moderate-Moderate, 75, 11.2, 2.26, 1.09, 4.65, 0.028. Row 6: Moderate-Low, 83, 12.4, 1.33, 0.63, 2.81, 0.450. Row 7: Low-High, 42, 6.3, 0.87, 0.31, 2.38, 0.770. Row 8: Low-Moderate, 76, 11.3, 2.08, 1.00, 4.34, 0.049. Row 9: Low-Low, 106, 15.8, 2.49, 1.28, 4.87, 0.007.
Ref, reference; DII, dietary inflammatory index.
Favourable cardiorespiratory fitness was defined as the highest quartile of sex-specific VO2max.
Models were adjusted for age, household income, body fat percentage, physical activity, smoking status, alcohol consumption, multivitamin use, CHD, chronic respiratory diseases, hypertension, diabetes and serum levels of total cholesterol and high-density lipoprotein cholesterol.
Discussion
This study demonstrates that adherence to a diet with higher anti-inflammatory potential is associated with more favourable CRF among community-dwelling older adults. The association was most evident in participants with higher physical activity levels. Both long-term adherence to an anti-inflammatory diet and a shift from a pro-inflammatory to an anti-inflammatory dietary pattern over time were linked to greater odds of favourable CRF assessed at a single subsequent time point compared with persistently pro-inflammatory diets, underscoring the potential link between prior dietary inflammatory potential and CRF.
In this cohort from southern China, mean VO2max values were 23·7 mL/kg/min for women and 25·7 mL/kg/min for men. These levels are slightly lower than median reference values for USA adults aged ≥65 years (24 and 27 mL/kg/min, respectively)(Reference Ferguson28), but exceed those reported for older adults in Hong Kong (19·2 and 21·8 mL/kg/min)(Reference Chan, Yau and Yu15) and the Chinese population aged 60–69 years (21·2 and 22·4 mL/kg/min)(Reference Wang, Li and Wang36). Differences across studies may reflect variations in lifestyle, diet, ethnicity and CRF testing protocols.
Our findings extend prior evidence linking diet quality to CRF. Studies in younger populations, including a Tehran cohort of 270 adults aged 18–45 years(Reference Payandeh, Shahinfar and Babaei24), have reported similar inverse associations between dietary inflammatory potential and CRF. Diets rich in fruits, vegetables, fish and whole grains – particularly Mediterranean-style diets – are consistently associated with better CRF(Reference Mi, Gajjar and Walker14,Reference Eslami, Zarei and Shidfar37,Reference Bibiloni, Julibert and Argelich38) , whereas diets high in refined grains, processed foods, red and processed meats and high-fat dairy products are linked to lower CRF(Reference Mi, Gajjar and Walker14,Reference Eslami, Zarei and Shidfar37) . Evidence among older adults remains limited. The Framingham Heart Study found that adherence to the Mediterranean diet and the Alternative Healthy Eating Index was positively associated with multiple CRF measures(Reference Mi, Gajjar and Walker14), while a Hong Kong study observed no significant associations between CRF and other healthy dietary indices, such as Dietary Approaches to Stop Hypertension or Diet Quality Index-International(Reference Chan, Yau and Yu15). In our study, the beneficial association of an anti-inflammatory diet with CRF appeared to be largely driven by greater intakes of protein, vegetables and fish (see Supplementary Table 3). In our study, although some dietary variables, such as protein, vegetables and fish, differed across VO2max tertiles, the absolute differences were relatively small. Thus, the observed association may be better interpreted as reflecting the overall dietary inflammatory potential captured by the DII, rather than the influence of individual food groups alone.
Low-grade inflammation is a key contributor to age-related declines in muscle mass, strength and cardiopulmonary function. In older adults, age-related chronic low-grade inflammation, or ‘inflammaging’, may impair CRF through several interconnected pathways, including promoting skeletal muscle protein breakdown, impeding myogenesis(Reference Costamagna, Costelli and Sampaolesi39), increasing oxidative stress, impairing mitochondrial function and contributing to endothelial dysfunction, all of which may reduce oxygen delivery and utilisation during exercise. Experimental studies demonstrate that IL-10–deficient mice, lacking a major anti-inflammatory cytokine, experience accelerated muscle loss, which can be attenuated by resveratrol-containing grape seed extract(Reference Wang, Yang and Liang40,Reference Chen, Ming and Chen41) . Epidemiological studies similarly link higher DII scores to reduced muscle mass and strength(Reference Wood, Shivappa and Berthon42), elevated systemic inflammation and impaired lung function in older adults(Reference Alessi, Trevisan and Citron43). These findings suggest that anti-inflammatory dietary patterns may be inversely associated with inflammatory processes that accompany CRF decline with ageing.
We also observed a borderline significant interaction between dietary inflammatory potential and physical activity. The inverse association between DII and CRF was evident only among individuals with higher physical activity, consistent with findings from the Coronary Artery Risk Development in Young Adults study(Reference Shikany, Jacobs and Lewis44), which found a stronger diet–CRF association in active adults. This finding may suggest that a less inflammatory diet is more strongly associated with CRF in the context of regular physical activity, possibly reflecting additive or synergistic benefits of diet and physical activity, whereas dietary inflammatory potential alone may have limited influence among less active individuals. However, because this interaction (P-interaction = 0·049) is statistically borderline and relies on subgroup analyses with wide CIs, it must be interpreted cautiously. While previous studies have suggested possible effect modification by sex(Reference Chan, Yau and Yu15) or age(Reference Mi, Gajjar and Walker14), no such interactions were detected in our analyses, although our study may have been underpowered to identify modest subgroup effects. Studies with larger sample sizes, covering broader age groups, and balanced representation of women and men are needed to clarify these relationships.
This study has several strengths. It is, to our knowledge, the first to examine dietary inflammatory potential in relation to CRF in a free-living older population. We used objective CRF assessments and a validated seventy nine-item quantitative FFQ to evaluate diet, and we adjusted for a wide range of potential confounders to strengthen the reliability of the observed associations. Moreover, 672 participants from the original cohort of 906 had repeated dietary data during follow-up, representing a relatively robust longitudinal dietary subsample.
Several limitations should also be considered. First, CRF testing was voluntary and implemented only in later follow-up waves of the study. Consequently, participants who underwent testing were younger and healthier than those who did not (Supplementary Table 1). This non-random selection introduces a healthy volunteer bias, which may affect the observed associations and substantially limits the generalisability of our findings to the broader, potentially more frail, older adult population. Second, CRF was estimated using a validated submaximal protocol rather than direct maximal testing. Although submaximal protocols, such as those using the Åstrand–Ryhming Nomogram, are recommended for older adults(7,Reference Ferguson28) , they introduce some estimation error compared with direct measurements. We minimized variability by controlling environmental, dietary and behavioural factors during testing, but residual error cannot be excluded. Third, sixty participants (6·6 %) were enrolled during the COVID-19 pandemic (2020), when restrictions may have influenced activity and fitness levels; however, excluding these participants did not materially affect results (Supplementary Table 2). Fourth, women comprised 71·5 % of the study sample. Although stratified analyses revealed no significant sex interactions (P-interaction = 0·873), this imbalance may limit generalisability. Finally, cross-sectional associations are vulnerable to reverse causation, as individuals with healthier diets may also be more physically active. To partially address this concern, we analysed long-term dietary inflammatory patterns based on prior DII changes over 9·5 years. While this approach helps establish a temporal sequence between prior diet and subsequent CRF, it is important to acknowledge that these prior diets were linked to CRF measured at a single subsequent time point. Without baseline CRF data, our analysis cannot determine changes in CRF over time and therefore does not establish true longitudinal effects on fitness trajectories. Prospective cohort studies with repeated CRF measurements and randomized trials are needed to establish causality.
Conclusions
In summary, a diet with lower inflammatory potential is associated with better CRF among relatively healthy older adults. Although this association appears stronger in physically active individuals, the borderline statistical interaction warrants cautious interpretation. Sustained adherence to anti-inflammatory dietary patterns is also linked to higher subsequent CRF. Future studies in diverse populations, using repeated dietary assessments and repeated CRF measurements, are needed to establish true longitudinal effects and underlying mechanisms.
Supplementary material
To view supplementary material for this article, please visit https://doi.org/10.1017/S0007114526108411
Data availability statement
The datasets used and/or analysed during the current study are available from the corresponding author on reasonable request.
Acknowledgements
The authors thank all the participants, staff and partner organisations involved in the study.
Author contributions
H-L. Z. and B-X. H. conceived and designed the study. Y-M. C. and H-L. Z. administered the project. Z-H. H., R-Z. H., S-Y. L., M-C. L., Z. L. and H-Q. C. assisted with data collection. B-X. H. and Z-H. H. performed statistical analysis, prepared figures and contributed to data interpretation and manuscript drafting. All authors read and approved the final manuscript.
Financial support
This work was supported by the National Natural Science Foundation of China (no. 82204021 and 82204020). The funding body had no role in the design, analysis or writing of this article.
Competing interests
The authors declare no conflicts of interest.