


Pobre não vota em pobre. (Poor people don't vote for poor people.)
—Brazilian saying
Politicians the world over are vastly better off than the citizens they represent. In both developing and advanced democracies, the available data suggest that elected officials are almost always wealthier, more educated, and more likely to come from white-collar jobs than the citizens who elect them (e.g., Best Reference Best2007; Best and Cotta Reference Best and Cotta2000; Matthews Reference Matthews, Loewenberg, Patterson and Jewell1985). In the United States, working-class citizensFootnote 1 —people employed in manual labor, service industry, clerical, or informal sector jobs—make up over half of the labor force, but the typical member of Congress spent less than 2 percent of his or her precongressional career in working-class jobs. Across Latin American democracies, workers make up between 60 and 90 percent of the general public, but legislators from those occupations make up just 5 to 25 percent of national legislatures (Carnes and Lupu Reference Carnes and Lupu2015). In Europe, blue-collar workers make up large proportions of the electorate but have rarely made up more than 10 percent of national legislatures (Best and Cotta Reference Best and Cotta2000).Footnote 2
Recently, political scientists have started paying renewed attention to these economic and social class gaps between politicians and citizens (partly in response to growing interest in the larger phenomenon of political inequality; e.g., Bartels Reference Bartels2008; Beramendi and Anderson Reference Beramendi and Anderson2008; Gilens Reference Gilens2012; Hacker and Pierson Reference Hacker and Pierson2011; Iversen and Soskice Reference Iversen and Soskice2015; McCarty, Poole and Rosenthal Reference McCarty, Poole and Rosenthal2006). One emerging body of research has found that government by the privileged has significant consequences: lawmakers from different classes tend to bring different perspectives to the political process. Just as the shortage of women or racial and ethnic minorities in office seems to affect policy outcomes on issues related to gender and race (e.g., Berkman and O'Connor Reference Berkman and O'Connor1993; Bratton and Ray Reference Bratton and Ray2002; Chattopadhyay and Duflo Reference Chattopadhyay and Duflo2004; Franck and Rainer Reference Franck and Rainer2012; Pande Reference Pande2003; Swers Reference Swers2002; Thomas Reference Thomas1991), the shortage of working-class politicians—who tend to be more leftist on economic issues in most countries—appears to bias policy on issues like wage supports, taxation, and social welfare towards the more conservative positions typically favored by affluent citizens. In the United States (Carnes Reference Carnes2012; Reference Carnes2013; Grose Reference Grose2013; Griffin and Anewalt-Remsburg Reference Griffin and Anewalt-Remsburg2013) and in other democracies (Carnes and Lupu Reference Carnes and Lupu2015), the economic gap between politicians and the people they represent appears to significantly tilt policy outcomes on issues of paramount significance.
Building on these findings, related research has begun to investigate the causes of government by the privileged. To date, however, only a handful of studies have explored this important topic, and most have focused on either the hypothesis that workers are less qualified—which has not found much empirical support—or on the idea that unions increase the numerical representation of particular occupational groups (e.g., Carnes Reference Carnes2013; Sojourner Reference Sojourner2013).
In this article, we test another potential explanation for the shortage of working-class people in political office: that voters dislike working-class candidates. This hypothesis squares with psychological research suggesting that middle-class people have subtle prorich biases (e.g., Horwitz and Dovidio forthcoming), and it is often invoked in both scholarly and popular discussions about the skewed makeup of democratic institutions. Political observers often argue that “the voters tend to elect wealthy politicos” because “the electorate seems to want a mix of personality and power, but only if they come with a pedigree and bank account to match” (Abdullah Reference Abdullah2012, 1), or that “[v]oters repeatedly reject insurrectionist candidates who parallel their own ordinariness, even candidates who vow to further the individual voter's interests, in favor of [more affluent] candidates” (Henry Reference Henry1995, 21). Why are politicians so much better off than the people they represent? One common idea is that voters simply dislike candidates from the working class.
To test this hypothesis, we conducted candidate choice experiments embedded in nationally representative surveys in Britain, the United States, and Argentina, three countries where working-class people make up a majority of the labor force but less than 5 percent of the national legislature (Carnes Reference Carnes2013; Carnes and Lupu Reference Carnes and Lupu2015; Cracknell and McGuinness Reference Cracknell and McGuinness2010; Office of National Statistics 2012). Using conjoint designs, we asked voters in these different contexts to choose between two hypothetical candidates, randomly varying several of the candidates’ personal characteristics, including whether they had worked in blue-collar or white-collar jobs.Footnote 3 This study represents the largest and most rigorous experimental analysis ever conducted on the role that voters play in the descriptive underrepresentation of the working class in the world's democracies.
Contrary to the idea that voters prefer affluent politicians, our candidate choice experiments found that voters across these three very different countries all viewed working-class candidates as equally qualified, more relatable, and just as likely to get their votes. Voters may not be to blame for the global phenomenon of government by the privileged. To the contrary, British, American, and Argentine voters seem perfectly willing to cast their ballots for working-class candidates.
VOTER BIASES AND WORKING-CLASS POLITICIANS
When it comes to holding political office, the numerical or descriptive representation (Pitkin Reference Pitkin1967) of any social group may be reduced by one of several factors. Some people from the group will not be qualified for office, either because they are not legally eligible or because they do not have the skills necessary for campaigning, governing, and performing the functions of political office. Of those who are qualified, most will choose not to seek public office, either because they lack political ambition, because they are not interested, or for some other reason. And, of those who seek office, many will lose. If a given social group is disproportionately screened out at any of these stages—if people from that group are less likely than others to be qualified, if those who are qualified are less likely to run, or if those who run are less likely to win—the group will be numerically underrepresented in public office relative to its numbers in the population as a whole.
In places where working-class citizens seldom hold political office, political observers often attribute the shortage of workers to the last stage, that is, to voters and elections. Voters prefer white-collar candidates, the argument goes, and qualified workers therefore either choose not to run for elected office as often as white-collar professionals, or qualified workers run and simply lose more often.
On its face, this line of reasoning has a certain intuitive appeal. For one, elections are sometimes responsible for keeping historically underrepresented groups out of office. Around the world, voters have often exhibited biases against female and racial or ethnic minority candidates that help to explain why so few women and minorities hold office (Aguilar, Cunow, Desposato, and Barone Reference Aguilar, Cunow, Desposato and Barone2015; Citrin, Green, and Sears Reference Citrin, Green and Sears1990; Darcy, Welch, and Clark Reference Darcy, Welch and Clark1994; Dolan Reference Dolan2004; Fisher et al. Reference Fisher, Heath, Sanders and Sobolewska2015; Fulton Reference Fulton2014; Horowitz Reference Horowitz1985; Morgan and Buice Reference Morgan and Buice2013; Norris and Lovenduski Reference Norris and Lovenduski1995; Paxton and Hughes Reference Paxton and Hughes2007; Philpot and Walton Reference Philpot and Walton2007; Sanbonmatsu Reference Sanbonmatsu2003; Schwindt-Bayer, Malecki, and Crisp Reference Schwindt-Bayer, Malecki and Crisp2010; Seltzer, Newman, and Leighton Reference Seltzer, Newman and Leighton1997; Welch and Studlar Reference Welch and Studlar1988).Footnote 4 These biases appear to be fading in some contexts (Aguilar, Cunow, and Desposato Reference Aguilar, Cunow and Desposato2015; Campbell and Cowley Reference Campbell and Cowley2014b; Inglehart and Norris Reference Inglehart and Norris2003; Lynch and Dolan Reference Lynch, Dolan, Thomas and Wilcox2014; McElroy and Marsh Reference McElory and Marsh2010; Norris, Vallance, and Lovenduski Reference Norris, Vallance and Lovenduski1992; Smith and Fox Reference Smith and Fox2001), but female and minority candidates have often faced discrimination in the past, and in many places they still do.
It is easy to imagine that voters might exhibit similar biases against candidates from the working class. Prejudice against the less fortunate is common (Baron, Abright, and Malloy Reference Baron, Albright and Malloy1995; Cozzarelli, Wilkinson, and Tagler Reference Cozzarelli, Wilkinson and Tagler2001; Fiske et al. Reference Fiske, Xu, Cuddy and Glick1999). And even voters who are not prejudiced per se might engage in a sort of “statistical discrimination”—that is, voters who are uncertain about a candidate's abilities or personal qualities might make guesses based on the candidate's economic or social class background (e.g., Darley and Gross Reference Darley and Gross1983; Phelps Reference Phelps1972). Indeed, political philosophers have often assumed that voters prefer to be represented by the well-to-do (see Ferejohn and Rosenbluth Reference Ferejohn, Rosenbluth, Shapiro, Stokes, Wood and Kirshner2009; Manin Reference Manin1997). In Federalist 35, Alexander Hamilton wrote that “Mechanics and manufacturers will always be inclined, with few exceptions, to give their votes to merchants in preference of persons of their own professions or trades. . . . They know that the merchant is their natural patron and friend; and they are aware that. . . their interests can be more effectually promoted by the merchants than by themselves” (Hamilton Reference Hamilton and Wills1982 [Reference Hamilton and Wills1788]: 166). If voters are prejudiced against the working class, or if they guess that working-class candidates are less qualified, or if they simply like affluent candidates better, voting and elections might indeed be responsible for the shortage of working-class people in political office.
Then again, there are also reasons to be skeptical that voters are to blame. For one, there are many other plausible explanations: voter biases are by no means necessary to explain the shortage of candidates from the working class. Workers might be less qualified. Those who are qualified might be less likely to run; they might have less political interest or ambition, less free time and slack income, and/or less encouragement from gatekeepers like political parties and interest groups. And these differences in qualifications or candidate entry might themselves be driven by larger structural phenomena like high campaign costs, the strength of labor unions, political party configurations, institutional rules, or the interest group landscape. Voters might help to explain why so few workers hold office, but they are not the only possible suspects: it is easy to imagine a host of factors that could be screening working-class people out of the candidate pipeline long before voters ever have a say.
There are also reasons to doubt that voters truly prefer more affluent candidates. Voters might assume that any candidate who stands for office has already been vetted by party leaders, funders, and other gatekeepers regardless of their class. And like the less fortunate, there are also prejudices and negative stereotypes about the privileged that might come into play during an election. The rich are often seen as out-of-touch, cold, and aloof (e.g., Fiske et al. Reference Fiske, Xu, Cuddy and Glick1999).
Much of what we know about elections, moreover, should give us some pause on this point. Voters tend to prefer politicians who they feel understand their problems and who share their views about public policy (e.g., Jacobson Reference Jacobson2012). If people feel a sense of shared identity with candidates from the same social class, or if they worry that candidates from other social classes do not understand their problems, share their concerns, or support their preferred policies, voters might not exhibit a blanket bias against working-class candidates. To the contrary, voters might be divided along ideological or social class lines—more conservative or affluent voters might tend to oppose working-class candidates, and more liberal or working-class voters might tend to support them.
For their part, candidates in many countries often behave as though they think economic or social class privilege is not an electoral slam dunk. Many work hard to downplay their advantages, sometimes going so far as to engage in what the historian Edward Pessen (Reference Pessen1984) refers to as “poor-mouthing”—deliberately exaggerating the economic adversities they have faced. There are good reasons to suspect that voter biases might be responsible for the worldwide shortage of politicians from the working class, but there are also good reasons to doubt that voters are really to blame.
As it stands, there is little direct evidence on this question. Only a handful of studies have ever examined how voters feel about working-class candidates. And to date, all of them have focused exclusively on the United States, which raises obvious questions about whether their findings generalize to other countries where workers are similarly underrepresented.
Moreover, the few previous studies on this topic have had important methodological limitations. Some have used observational data, which suffer from obvious selection bias problems. Carnes (Reference Carnes2013), for instance, finds that members of the U.S. Congress who spent more time in working-class jobs receive about as many votes as members who worked in white-collar professions. But it might be that members of Congress from the working class face biases at the polls but overcome them somehow: perhaps, for instance, only the very best working-class candidates run, which gives the appearance that working-class candidates do about as well as others. Other research has avoided this selection problem by asking voters to evaluate hypothetical candidates, which allows the researcher to randomize the candidate's class while holding other candidate attributes constant. To date, however, the candidate evaluation experiments that have included working-class candidates (e.g., Sadin Reference Sadin2011; Carnes and Sadin Reference Carnes and Sadin2015) have relied on experiments that ask respondents to evaluate just one hypothetical candidate, not experiments that ask respondents to choose between multiple candidates, the way voters do in real elections.Footnote 5 When they are not presented with other options, the voters in these studies seem comfortable with working-class candidates, but voters may behave differently when they have choices.
Voter biases could be responsible for the shortage of politicians from the working class, but scholars simply do not have much hard evidence on this point. To our knowledge, there have never been any studies on this topic outside of the United States, and even in the United States we know of no causally identified research on how working-class candidates perform in contested elections. If we want to know whether voter biases are responsible for the global descriptive underrepresentation of the working class, we need to start studying how voters around the world think about working-class candidates when they make choices on Election Day.
EVIDENCE FROM CANDIDATE CHOICE EXPERIMENTS
To that end, we fielded a series of candidate choice experiments embedded in nationally representative surveys in Britain, the United States, and Argentina. The British experiment was fielded in the May/June 2014 wave of the 2015 British Election Study, a large survey administered online by YouGov UK to a representative sample of over 30,000 British citizens. Our questions were administered to a random subset of 5,552 respondents. The United States experiment was fielded in May 2015 to a random subset of 1,000 U.S. respondents in the Cooperative Congressional Election Study, a 50,000-person national stratified sample survey administered by YouGov/Polimetrix. And the Argentina experiment was fielded to 1,149 respondents in June and July of 2015 in the first wave of the 2015 Argentine Panel Election Study, a face-to-face survey administered by MBC MORI.Footnote 6
Candidate choice experiments are useful because they avoid the pitfalls of examining observational data on elections, where a candidate's social class background might be correlated with many other factors that influence the results of the election. If we want to know whether voters are really biased against candidates from the working class, we need to be sure that those other factors are not confounding our analysis. Conjoint candidate choice experiments—in which researchers ask voters to choose between two hypothetical candidates, randomizing certain aspects of the candidates’ backgrounds or positions—give us one way to identify the causal effect of a candidate's class on how voters evaluate the candidate (Hainmueller et al. Reference Hainmueller, Hopkins and Yamamoto2014; Reference Hainmueller, Hangartner and Yamamoto2015).
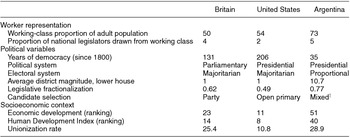
And Britain, the United States, and Argentina were ideal settings for carrying out these experiments. In all three countries—like in most democracies—working-class people are numerically underrepresented in political institutions by several orders of magnitude. As Table 1 shows, in the United States, working-class people make up over half of the labor force, but the average member of Congress spent less than 2 percent of his or her precongressional career in working-class jobs. In Britain, manual labor, service industry, and clerical occupations make up roughly half of the labor force as well, but just 4 percent of Members of Parliament are drawn from similar jobs. In Argentina, only 5 percent of national Deputies in 2000–2001 came from working-class backgrounds, compared to roughly 70 percent of the general public. In all three countries, some political or social process is leading workers to be drastically underrepresented in public office.
Class and Politics in Britain, the United States, and Argentina (c. 2014)

Sources: Carnes Reference Carnes2013; Carnes and Lupu Reference Carnes and Lupu2015; Cracknell and McGuinness Reference Cracknell and McGuinness2010; Database of Political Institutions; International Labour Organization; Office of National Statistics 2012; OECD; Polity IV; United Nations Development Programme.
Notes: Years of democracy is measured as the total number of years with a Polity score greater than 5. Some of the figures for Britain refer to the entire United Kingdom.
† Since 2009, Argentina has held mandatory primary elections. Primary candidates for executive offices appear individually, but legislative primaries are contested by competing lists drawn up by party officials.
More importantly, these three countries differ substantially in terms of socioeconomic and political factors that may condition how voters behave. As Table 1 illustrates, Argentina is a much newer democracy than Britain or the United States. The political systems of these countries run the gamut from presidential to parliamentary, majoritarian to proportional, and two-party to multiparty systems. Partly as a result of these systemic differences, these countries also use very different methods to select political candidates, which can in turn affect candidate entry and vote choice (e.g., Carey and Shugart Reference Carey and Shugart1995; Katz Reference Katz2001; Norris Reference Norris1997). While British candidates are selected almost exclusively by party leaders, political candidates in the United States typically have to win an open primary to run for office on a major party ticket, and Argentina employs a mixed system. The three countries also vary substantially in socioeconomic terms. Unionization rates are far higher in Britain and Argentina than in the United States, one likely reason that class is more politically salient in Britain and Argentina. Obviously, Argentina is also less developed in economic and human development terms. And workers are also a much larger proportion of the labor force in Argentina than in the other two countries.
Taken together, these three cases cover a wide range of the variation on these political and socioeconomic variables that might affect how voters respond to candidate’ class backgrounds. If we find similar results across these very different contexts, we can be fairly confident that those results are not just unique to one country, one region, or one set of political institutions (Slater and Ziblatt Reference Slater and Ziblatt2013). We can also be confident that it is not these contextual differences that are driving our results (Gerring Reference Gerring2007).
Cooperative election surveys were also conducted in 2014 and 2015 in all three of these countries, which made it possible for us to carry out reliable, context-appropriate studies of voters’ political attitudes. The United States, Britain, and Argentina were methodologically convenient places to conduct survey experiments, and collectively they were also a substantively ideal sample for exploring whether voter biases are behind the shortage of working-class politicians in the world's democracies.
In our candidate choice experiments, we presented survey respondents with short vignettes about two hypothetical candidates running for a local political office. Unbeknownst to the respondents, within each candidate's biography, we randomly varied four characteristics: the candidate's gender (male or female), occupation (working-class or white-collar), education level (secondary school or college in the United States and BritainFootnote 7 ; primary school or secondary school in Argentina), and party affiliation (Labour or Conservative in Britain; Democrat or Republican in the United States; Peronist (PJ) or Radical (UCR) in Argentina). In the United States version of the study, we also varied each candidate's race (white or black) and the office the two candidates were competing for (city council, state legislature, mayor, or governor). And in the Argentina version of the experiment, we varied the amount of prior political experience the candidate had (no experience or three years holding an appointed office). The complete text of the three experiments is provided in the Appendix.Footnote 8
In our conjoint experimental design, we randomly varied each of these attributes independently for each of the two candidates.Footnote 9 This allowed us to simultaneously measure (and compare) the independent effect of each characteristic (Hainmueller et al. Reference Hainmueller, Hopkins and Yamamoto2014). That is, by randomizing each candidate's occupational background and the candidate's gender, education, party, race (United States only), and experience (Argentina only), we can compare the effect of having a working-class job to the effect of being a woman, more educated, a Tory/Republican/Radical, a black candidate (United States only), and a novice politician (Argentina only). Moreover, by randomizing each attribute independently, we could ensure that our respondents were not conflating different attributes, e.g., that respondents hearing about a business owner were not inferring (or being told) that she was a Republican, too.
After showing respondents the two candidate vignettes, we then asked four questions: (1) which candidate the respondents would vote for, (2) which candidate they would expect to be more leftist, (3) which candidate they thought better understood the problems facing people like themselves, and (4) which candidate they thought was more qualified for political office.Footnote 10 Above all, we were most interested in knowing whether respondents were more likely to vote for a candidate who was randomly portrayed as coming from a working-class job or a white-collar job. Political observers routinely argue that working-class citizens seldom hold office because voters prefer more affluent candidates (and would-be candidates know it). Our subsequent questions also allowed us to measure the effect of class on three other important aspects of voters’ opinions: how they perceive a candidate's ideological orientation, whether voters think a candidate cares about their concerns, and whether they think a candidate is qualified to hold political office.Footnote 11
DO VOTERS DISLIKE WORKING-CLASS CANDIDATES?
Were citizens in Britain, the United States, and Argentina more likely to vote for white-collar candidates? And how exactly did they think white-collar and working-class candidates differ? To find out, we treated each hypothetical candidate in each experiment (that is, two candidates for every one survey respondent) as a unique case, following the recommendation of Hainmueller et al. (Reference Hainmueller, Hopkins and Yamamoto2014).Footnote 12 We then estimated ordinary least squares regression modelsFootnote 13 relating our outcome variables—for instance, whether a candidate got the respondent's vote—to indicators for whether the candidate was randomly assigned to be a worker, a woman, less educated, a Tory/Republican/Radical, black (in the United States), or an experienced politician (in Argentina). (Because each candidate was nested within a two-person election, we used standard errors clustered by election.)
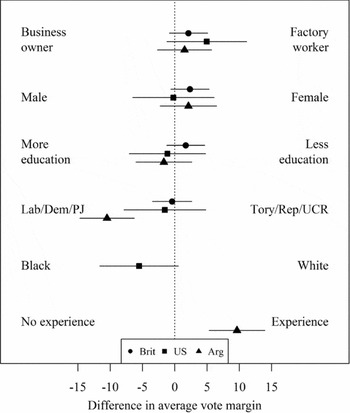
Figure 1 plots the difference in the probability that a typical citizen in Britain, the United States, and Argentina would vote for a candidate described as a business owner and a (on average otherwise identical) candidate described as a factory worker (the first set of dots). For comparison, the figure also plots the difference when the candidate was described as a woman versus a man, more versus less educated, a member of the Labour/Democratic/Peronist Party versus the Conservative/Republican/Radical Party, white versus black (in the United States), or a political novice versus an experienced politician (in Argentina). (Table A1 in the Online Appendix reports the complete results from the models these figures are based on.)Footnote 14
Candidate Characteristics and Voting in Britain, the United States, and Argentina

Many of the findings in Figure 1 were not surprising (and helped increase our confidence in our research design). Candidates described as having more experience were more likely to get votes. Argentine voters were unenthusiastic about the UCR; Peronist candidates tended to do better. Consistent with recent studies showing that gender and racial biases are declining or nonexistent in many modern elections (Aguilar, Cunow, and Desposato Reference Aguilar, Cunow and Desposato2015; Campbell and Cowley Reference Campbell and Cowley2014b; Lynch and Dolan Reference Lynch, Dolan, Thomas and Wilcox2014; McElroy and Marsh Reference McElory and Marsh2010), female candidates tended to do about as well as male candidates and (in the United States) black candidates performed (nonsignificantly) better than white candidates. Consistent with research finding few differences between candidates with more and less education (Campbell and Cowley Reference Campbell and Cowley2014b; Carnes and Lupu Reference Carnes and Lupu2016), candidates with more formal education fared about as well as those with less.
For our purposes, however, the most striking feature of Figure 1 was how unremarkable working-class candidates seemed. The average respondent in Britain and Argentina was essentially indifferent about candidates from the working class and candidates from white-collar jobs. The average U.S. respondent was actually slightly more likely to prefer the working-class candidates in our experiments over the white-collar ones (although the gap was just shy of conventional levels of statistical significance).Footnote 15 In sharp contrast to the idea that voters prefer affluent candidates, citizens in these three democracies did not seem to be even remotely biased against working-class candidates.
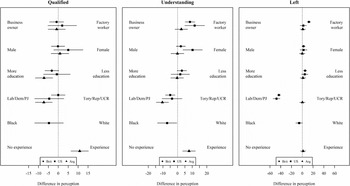
They clearly noticed candidates from the working class, however—and it affected how they perceived some things about them. The left panel in Figure 2 plots the probability that a survey respondent would rate a given candidate more qualified for office, again averaging across candidates who were described as business owners or factory workers, men or women, more or less educated, members of the two parties, white or black (in the United States), and experienced candidates or novices (in Argentina). The middle and right panels in Figure 2 likewise depict the probability that respondents would rate a given candidate more likely to understand the problems facing people like themselves and the probability that respondents expect a given candidate to be more left wing.
On these important measures of voters’ impressions, candidates from the working class did well. Voters in all three countries were almost exactly as likely to rate a business owner and a factory worker as qualified to hold office—the effect of the candidate's class was statistically insignificant and substantively miniscule. In Britain (where class consciousness is stronger), voters were significantly more likely to see working-class candidates as leftist. And in sharp contrast to the idea that voters prefer more affluent candidates, voters in the United States and Britain were significantly more likely to see a hypothetical candidate from the working class as someone who understood the problems facing people like themselves. On this last point, the effect of class in the United States and Britain was larger than the effect of gender, education, race, experience, or even political party. Far from being a liability or a mark of incompetence, being a candidate from the working class appears to have complex—and sometimes highly positive—effects on voters’ perceptions.
Other candidate characteristics also predicted sensible differences in Figure 2. Voters in Britain saw candidates with less formal education as slightly less qualified for office, slightly more likely to understand their problems, and slightly more leftist. In Britain and the United States, voters saw candidates from the more leftist political party as more likely to be left wing. Unsurprisingly, it was more difficult for Argentine voters to guess a candidate's ideology from her party affiliation (see Lupu Reference Lupu2014; Reference Lupu2016). And consistent with recent research that finds little voter discrimination against women, a candidate's gender did not have significant negative effects on any of the variables we examined in Figures 1 or 2; to the contrary, in the United States, female candidates were seen as more understanding.
Do Voters View Candidates Differently Based on their Backgrounds?

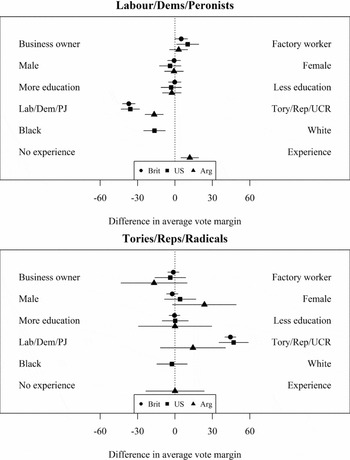
Of course, if voters see working-class candidates as more leftist (as British voters did), the effect on their ultimate vote choice will probably depend on whether the voters are themselves more leftist. In Figure 3 below, we replicated Figure 1—which examined differences in whether respondents said they would vote for each candidate—this time, splitting each country's respondents by their own stated party affiliations. That is, the top panel presents results among respondents who identified with the Labour Party in Britain, the Democratic Party in the United States, or the Peronist Party in Argentina; and the bottom panel presents results among respondents who identified with the Conservative Party, the Republican Party, or the Radical Party.Footnote 16
Candidate Characteristics and Voting, by Respondent Partisanship

Not surprisingly, when we limited our attention to respondents from just one political party,Footnote 17 they tended to enormously favor candidates from their own party over candidates from the other.Footnote 18 Strikingly, however, separating voters by party did little to change our finding that voters do not dislike candidates from the working class. Conservative voters in Britain, Republican voters in the United States, and Radical voters in Argentina were slightly less likely to say that they would vote for a candidate described as a factory worker, but the difference was never statistically significant (even in sizeable experimental samples of over 300 Republicans and 2,300 Tories). And left party respondents in the United States and Britain were significantly more likely to report that they would vote for a working-class candidate—Labour voters were five percentage points more likely, and Democrats in the United States were ten percentage points more likely to say that they would vote for a candidate who was randomly described as a factory worker. Far from being an electoral liability, in our survey experiment, working-class candidates seem to do fine with right party supporters and especially well with left party supporters.
To check that these findings were genuine, we also carried out several additional robustness tests. In Britain, we were able to subset respondents by their own occupations. White-collar respondents were about as likely to vote for working-class candidates; working-class respondents were somewhat more likely to vote for them (see Table A5 in the Online Appendix). In the United States, we randomized the level of the office the hypothetical candidates were running for. Whether the survey respondent was asked about a race for city council, mayor, state legislator, or governor, we never found a substantively large or statistically significant bias against working-class candidates (see Table A6 in the Online Appendix). In the U.S. experiment we also asked respondents not just which candidate they were most likely to vote for, but how likely they were to vote for them (extremely likely, very likely, somewhat likely, not too likely, or not likely at all). The effects of candidate attributes on these ordinal scales were very similar to our results with the dichotomous vote choice question (see Table A7 in the Online Appendix).
We also reran our main vote choice models with three additional modifications. First, we recoded our dependent variable so that respondents who said they were “not sure” which candidate they preferred took an intermediate value (0) between supporting a candidate (1) and opposing her (−1).Footnote 19 In a second analysis, we focused only on respondents who were presented with working-class candidates who were also less educated men (a common way that workers are depicted in the media; in the United States, we focused in particular on white men) and white-collar candidates who had more formal education (but who could be either male or female and, in the United States, either white or black). That is, we excluded atypical candidate profiles that might not conform to social class stereotypes—e.g., college-educated female factory workers—which might make the experiment seem artificial to some survey respondents. In a final robustness check, we limited our analysis to respondents who were given a choice between two candidates with different class backgrounds (that is, excluding cases in which both candidates were either business owners or factory workers). None of these changes altered our basic findings (see Table A8 in the Online Appendix). Even when we modified our analysis, voters seemed perfectly willing to support working-class political candidates.
Together, these findings also helped assure us that our main result—that voters are just as likely to cast their ballots for hypothetical working-class candidates—was not simply an artifact of respondents overlooking the information we provided about each candidate's social class or not paying attention to our vignettes more generally (e.g., Berinsky, Margolis, and Sances Reference Berinsky, Margolis and Sances2014). Respondents seemed to notice a candidate's class in many of our analyses: voters in the United States and Britain saw workers as more likely to understand their problems (Figure 2, center panel), voters in Britain saw working-class candidates as more leftist (Figure 2, right panel), Labour and Democratic voters in Britain and the United States were significantly more likely to vote for a working-class candidate (Figure 3, top panel), and working-class respondents in Britain were significantly more likely to say they would vote for working-class candidates (Table A5 in the Online Appendix). We did not have access to “screener” questions or other attention checks in our online surveys in Britain and the United States, but our experiments in those countries yielded the same general findings as our experiment in Argentina, which was conducted in a face-to-face survey (where attention is less of a problem). Voters seemed to be paying attention to our vignettes and seemed to notice candidates’ social classes. They simply did not seem to weigh class all that heavily when deciding how to vote.
Across all of the outcomes and subgroups we considered, working-class candidates simply seemed unremarkable—and sometimes seemed to do slightly better than white-collar candidates. In sharp contrast to the idea that voters dislike candidates from the working class, voters in Britain, the United States, and Argentina seemed perfectly willing to cast their ballots for them.
VOTERS AND THE DESCRIPTIVE UNDERREPRESENTATION OF THE WORKING CLASS
Political observers often argue that the shortage of working-class people in political institutions reflects the will of the voters. As one comment in response to an online article documenting class-based inequalities in office-holding in the United States scolded, “we have this little problem called free elections. . . . I just don't see any way you can do any ‘bias correction’ that doesn't violate the constitution [sic].”Footnote 20
That idea has wide reach and an understandable intuitive appeal. In political systems where voters are free to choose just about anyone to hold office, if the working class is numerically underrepresented in public office, is that not just an expression of what voters want?
Although the argument seems sensible on its face, a closer look at the evidence suggests that voters themselves may not be responsible for the shortage of workers. In the first-ever experimental study of whether voters choose candidates from the working class in competitive races—and the first study on this topic conducted outside of the United States—we find that voters in Britain, the United States, and Argentina viewed working-class candidates as equally qualified, more relatable, and just as likely to get their votes. Contrary to the idea that voters prefer affluent politicians, these findings suggest that the shortage of working-class people in political offices in these countries—and probably elsewhere—may not be an expression of the popular will after all. Across very different contexts—majoritarian and proportional electoral systems, places where unions are more or less widespread—our results are remarkably consistent. Something important is keeping workers out of office in these countries—they are numerically underrepresented by 45 to 65 percentage points in each country—but it does not appear to be voters.
Of course, our study used data from surveys in just three countries. And our experiments also compared just two occupations. We need more research to ensure that the patterns documented in this article are not limited to the specific countries and occupations we chose. And although asking voters about hypothetical candidates allowed us to control confounding factors, our results were still based on simulated choices, not real ones, and on reading vignettes, not exposure to the many messages, cues, and signals voters receive in actual campaigns. The case is far from closed on this question, and in future work we intend to study more countries—less industrialized contexts, less polarized party systems, and newer democracies—as well as a wider ranges of occupations (e.g., Campbell and Cowley Reference Campbell and Cowley2014a; Reference Campbell and Cowley2014b; Hainmueller et al. Reference Hainmueller, Hopkins and Yamamoto2014). We also intend to use more data, including experiments that more closely mimic real elections and observational data on how actual candidates perform.
Even so, this study has important implications for scholars interested in why there are so few working-class people in political office in democracies around the world. Any given social group will tend to be numerically underrepresented in public office if people from that group are less likely to be qualified, less likely to run, or less likely to win. The findings presented in this article suggest that winning may not be the determining factor for the working class.
This finding suggests that scholars interested in the shortage of working-class people in public office may benefit from shifting their attention to the earlier stages of the candidate entry process, as scholars of women's representation began doing over a decade ago (e.g., Crowder-Meyer Reference Crowder-Meyer2010; Lawless and Fox Reference Lawless and Fox2005; Reference Lawless and Fox2012; Niven Reference Niven1998; Pimlott Reference Pimlott2010; Sanbonmatsu Reference Sanbonmatsu2002; Reference Sanbonmatsu2006). Voter biases undoubtedly help to explain the shortage of some social groups in some times and places, but they have seldom been the whole story. Research on the shortage of women and other social groups in public office quickly moved its focus from voters to other potential explanations; research on the working class may do well to follow suit.
For instance, workers may not be less likely to win elections, but they might believe they are less likely to win—and therefore choose not to run. Pundits and reporters often argue that voters prefer affluent candidates. By doing so, they may be giving would-be candidates from the working class the faulty impression that they would not stand a chance, discouraging them from running in races they might actually win. This study's findings suggest that voters themselves are not keeping working-class citizens out of office, but elite perceptions of voters may be part of the explanation.
A host of other factors may matter, too: resources like time and money, attitudes like cynicism and efficacy, encouragement by political gatekeepers, institutional rules, organized interest groups, political parties, and so on. If we want to know why the world is run by politicians who are much more affluent than the people they represent, there are still many possible explanations we need to consider. But voter biases probably are not chief among them.
APPENDIX: EXPERIMENT WORDING
Great Britain vignettes
Suppose you were asked to choose between two candidates for a local political office.
[John / Jane] Simmons is a [business owner / factory worker] who has lived in your town for 20 years. [He / She] [graduated from university / completed secondary school] and is a member of the [Labour Party / Conservative Party]. Simmons was appointed to a position in the local government three years ago, and has been endorsed by several local political organizations and newspapers. [His / Her] campaign has focused on the problems facing local schools, in particular a shortage of qualified teachers.
[Nigel / Emma] Allen is a [business owner / factory worker] who grew up in your town. [He / She] [graduated from university / completed secondary school] and is a member of the [Labour Party / Conservative Party]. Allen has worked in local government for the last five years, and is widely respected in the community for [his / her] volunteer work for several prominent local charities. [His / Her] campaign has stressed the importance of improving local waste management services, like sewers and garbage pickup.
US vignettes
Suppose you were asked to choose between two candidates for [city council / mayor / state legislature / governor].
[John / Jane] Simmons is a [black / white] [business owner / factory worker] who has lived in your town for 20 years. [He / She] [graduated from college / started working after high school] and is a member of the [Democratic Party / Republican Party]. Simmons was appointed to a position in the local government three years ago, and has been endorsed by several local political organizations and newspapers. [His / Her] campaign has focused on the problems facing local schools, in particular a shortage of qualified teachers.
[Tom / Tammy] Allen is a [black / white] [business owner / factory worker] who grew up in your town. [He / She] [graduated from college / started working after high school] and is a member of the [Democratic Party / Republican Party]. Allen has worked in local government for the last five years, and is widely respected in the community for [his / her] volunteer work for several prominent local charities. [His / Her] campaign has stressed the importance of improving local infrastructure, like roads and highways.
Argentina vignettes
Imagine that you are voting in an election for mayor with two candidates.
[Juan / María] Alberti is a [business owner / factory worker] who has lived in your neighborhood for 20 years. [He / She] [finished high school / did not finish high school] and considers [himself / herself] a [Peronist / Radical]. Alberti [has no prior political experience / was appointed to a position in the municipality three years ago] and is close to local political organizations. [His / Her] campaign has focused on the problems facing schools in the neighborhood, particularly the shortage of teachers.
[José / Valeria] Jiménez is a [business owner / factory worker] who has lived in your neighborhood for 20 years. [He / She] [finished high school / did not finish high school] and considers [himself / herself] a [Peronist / Radical]. Jiménez [has not been involved in politics up until now / has been working in the municipality for five years] and is highly respected in the neighborhood for [his / her] volunteer work with several organizations. [His / her] campaign has focused on the importance of improving local sewers and garbage pickup.
SUPPLEMENTARY MATERIAL
To view supplementary material for this article, please visit https://doi.org/10.1017/S0003055416000551.




Comments
No Comments have been published for this article.