I. INTRODUCTION
Due to excellent properties such as good plasticity and good corrosion resistance, high electrical and thermal conductivity, copper is one of the most important materials in industry. However, the wide applications have been limited due to low hardness, low tensile, and poor wear resistance. It is well known that the addition of ceramic particles such as SiC, TiB2, TiC, and WC into the soft copper to form the copper-matrix composites can significantly improve both the mechanical properties and wear resistance.Reference Luo, Yang, Liu, Xu, Yuan and Huang1–Reference Deshpande and Lin4 However, these ceramic particles often suffer from heat damage due to the dissolution into the liquid metal during processing or tend to agglomerate due to poor wettability between copper matrix and reinforcements, resulting in the high property loss of ceramic particles and the cracking of composites.Reference Gu, Shen, Zhao, Xiao, Wu and Zhu5,Reference Pei, Ocelik and De Hosson6
To overcome these limits, the methods of in situ synthesis of copper-matrix composites can provide fine and uniformly distributed particles, which have been well developed.Reference Leong, Lu, Fuh and Wong7 Especially, the immiscible Cu–Fe alloys as high-strength and high-electrical-conductivity materials have many unique properties when the Fe-rich particles are in situ synthesized and uniformly distributed in the Cu-rich matrix. Thus, Cu–Fe alloys are promising candidates for extensive applications such as electrical sliding contacts, electronic packaging solder, and magnetic materials.Reference He, Zhao, Yang, Wang and Gao8–Reference Munitz, Bamberger, Wannaparhun and Abbaschian10 However, the scope of potential applications of Cu–Fe alloys prepared by the conventional solidification techniques has been limited due to serious constitutional segregation caused by the two liquid phases within the miscibility gap having different densities.Reference Ohnuma, Saegusa, Takaku, Wang and Liu11
Recently, due to many advantages such as microstructure refinement, extension of solid solution, and non-equilibrium phases, the rapid solidification techniques such as gas atomization, electron beam surface melting, and laser cladding have great potential to produce the Cu–Fe alloys with desired microstructure in which the fine Fe-rich particles are uniformly distributed in the Cu-rich matrix, which have received extensive attention.Reference Wang, Liu, Ohnuma, Kainuma and Ishida12–Reference Zeng, Xie and Wang14 Moreover, summing up the published results,Reference Munitz, Venkert, Landau, Kaufman and Abbaschian15,Reference Shi, Wang, Wheeler, Liu and Wang16 it was found that there are mainly four factors to influence the microstructure of immiscible alloys with a miscibility gap: chemical composition, cooling rate, undercooling, and fluid flow. Therefore, numerous investigations have been carried out to obtain the proper microstructure by controlling the solidification conditions of Cu–Fe alloys. Particular attention is paid on the thermodynamics calculation of phase diagram, the effect of undercooling or cooling rate on the microstructure characteristics, and solidification process during the liquid phase separation.Reference Munitz, Bamberger, Wannaparhun and Abbaschian10,Reference Liu17
In practice, the chemical composition as one of the most important factors also plays a significant role in adjusting the process of liquid phase separation and controlling the microstructure characteristics of immiscible alloys. For instance, Curiotto et al.Reference Curiotto, Battezzati, Johnson and Pryds18 studied the effect of Ni addition on the liquid phase separation in Cu–Co alloy, and found that the addition of Ni can efficiently avert the liquid remixing between the Cu-rich and Co-rich phases. The most significant microstructure is composed of many small Co-rich particles with Cu interlayer distributed in the Cu-rich matrix. Wang et al.Reference Wang, Liu, Ohnuma, Kainuma and Ishida12 studied the effect of chemical composition on the miscibility gap of Cu–Fe alloys via gas atomization and found that the core/shell microstructure consisting of an Fe-rich core and a Cu-rich shell can be obtained in Cu65Fe31.4Si3C0.6 alloy (wt.%), whereas the core/shell/corona microstructure composed of a Cu-rich core, an Fe-rich periphery, and a thin Cu-rich surface layer can be obtained in Cu45Fe51.4Si3C0.6 alloy. However, the mechanisms of solidification and microstructure evolution are still not completely clear and the relationships between chemical composition, microstructure, and properties have not been studied extensively. Therefore, it is very significant to investigate the influence of chemical composition on the microstructure and properties of Cu–Fe alloys to obtain the expected microstructure and properties by selecting the proper chemical composition.
As well known, the residual stress induced by high temperature gradient and different thermal expansion coefficients during laser cladding can lead to crack formation in the cladding layer.Reference Zhou and De Hosson19,Reference Kadolkar, Watkins, De Hosson, Kooi and Dahotre20 To overcome this disadvantage, laser induction hybrid rapid cladding (LIHRC) has been well developed in recent years because it can produce the crack-free Ni- and Fe-based WC coatings with high hardness and good wear resistance on steel when the efficiency of LIHRC is four times higher than that of individual laser cladding. In this study, the Cu–Fe-based coatings with different Al contents are prepared by LIHRC.Reference Zhou, Huang, Zeng and Hu21,Reference Zhou and Zeng22 The emphasis is to study the influence of Al addition on microstructure and properties of Cu–Fe-based coatings, and an attempt is made to establish the relationships between Al content, microstructure, and properties of Cu–Fe-based coatings. This kind of Cu–Fe-based coating as a protective material of copper alloy crystallizer may have a potential application in the metallurgical engineering industry.
II. EXPERIMENTAL PROCEDURES
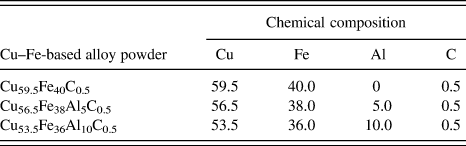
The copper alloy with a composition of Cu–9.0Al–2.0Mn (wt.%) was used as the substrate (SUB). Three kinds of copper alloy powders were used as cladding material in the size of 20–50 μm. To investigate the effect of Al addition on microstructure and properties of Cu–Fe-based coatings, the weight ratio of Cu to Fe in Cu–Fe-based powders was approximately set at 3:2 and the chemical composition was listed in Table I.
Chemical composition of Cu–Fe-based alloy powder (wt.%).

Cu–Fe-based coatings were produced by LIHRC with elliptical spot. The experimental apparatus used has been described in detail in our previous paper.Reference Zhou, Huang, Zeng and Hu21 The experiments of LIHRC were carried out using a HGL-JKR5080 5 kW continuous wave CO2 laser. The major and minor axis of laser beam was 7 mm and 5 mm, respectively. The major axis was parallel to the direction of laser scanning speed. The identical processing conditions were adopted during LIHRC to investigate the effect of Al content on microstructure and properties of Cu–Fe-based coatings. Moreover, to decrease the temperature gradient and eliminate the cracks of cladding layer, the preheated average temperature of SUB by LIHRC was kept constant and set at 1173 K by adjusting the power of induction heater. Thus, the laser scanning speed V s can be increased to 2500 mm/min when the laser powder was 5 kW and the powder feeding rate was 80–92 g/min to obtain the coatings with a thickness of about 1.0 mm. The angle between the powder nozzle and the SUB was set at 53°. The multitrack overlapping rate was 50% to obtain the large area coatings.
The microstructure was investigated by an environmental scanning electron microscope with an accelerating voltage of 20 kV. Energy dispersive x-ray spectrometer (EDS) analysis was performed to measure the average composition of coatings. X’Pert Pro x-ray diffraction (XRD) was used to analyze the phases in the coatings (target: Cu, 40 kV, 40 mA).
The corrosion characteristics of coatings and copper alloy SUB were evaluated by using polarization techniques (Tafel) with an electrochemistry station (CHI660C). Tafel experiments of coatings were performed in 3.5% NaCl solution with a conventional three-electrode cell. A saturated calomel as the reference electrode and a platinum wire as the counter-electrode were used in the tests. The surface area of the test specimens (as the working electrode) exposed to the electrolyte was 0.5 cm2. Polarization scanning was performed toward positive values at a scanning rate of 1.0 mV/s. The microhardness distributions of coatings were measured using a Vickers-1000 hardness tester (Hongkong, China) with a load of 1.96 N and a dwelling time of 30 s.
III. RESULTS
A. Microstructure characteristics of coatings
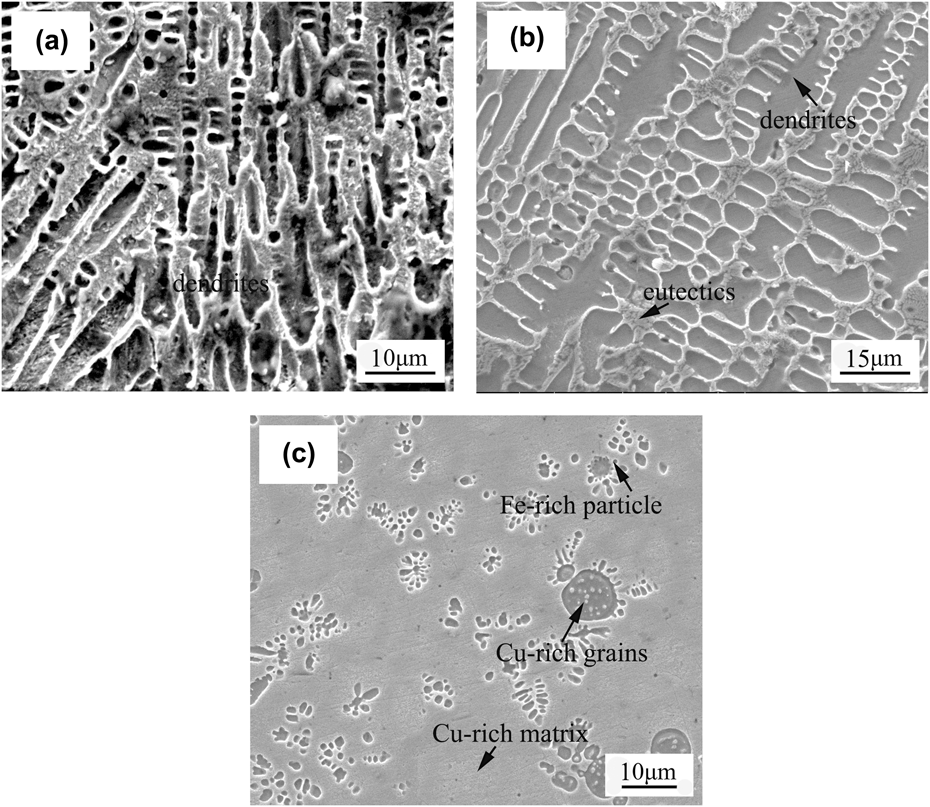
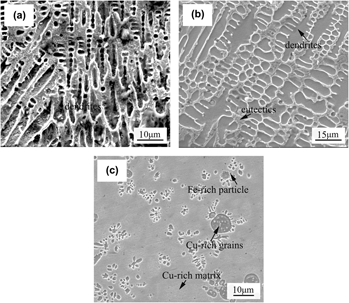
When Al is not added in Cu–Fe-based coating, the microstructure of Cu59.5Fe40C0.5 coating is shown in Fig. 1. It can be seen from Fig. 1(a) that the columnar dendrites are observed at the bottom of coating and the dendrite arm spacing is approximately 10 μm. EDS analysis reveals that the columnar dendrite contains 86.54 wt.% Fe and 13.58 wt.% Cu. As shown in Fig. 1(b), the coarse dendrites and eutectics are observed in the center of coating. The primary and secondary dendrite arm spacings are about 10 μm and 5 μm, respectively. The average composition of coarse dendrite is 82.76 wt.% Fe and 17.34 wt.% Cu, whereas the eutectic contains 65.48 wt.% Cu and 34.62 wt.% Fe. At the top of coating, many spherical particles are unevenly distributed in the matrix [Fig. 1(c)]. Most particles have an average diameter of about 3 μm, but only a few have a diameter of approximately 8 μm. EDS analysis indicates that the spherical particle contains 83.49 wt.% Fe and 16.61 wt.% Cu, whereas the matrix contains 87.38 wt.% Cu and 12.82 wt.% Fe, showing that the matrix is rich in Cu and contains a supersaturated Fe, and that the spherical particles are rich in Fe and contain a supersaturated Cu. Moreover, some submicron grains are precipitated inside the spherical Fe-rich particles. These fine grains can be the Cu-rich phases but their composition cannot be accurately determined by EDS analysis due to their small dimensions. MunitzReference Munitz13 also reported the similar microstructure characteristics in electron beam copper/stainless-steel welds.
Microstructure of Cu59.5Fe40C0.5 composite coating by LIHRC: (a) at the bottom of coating, (b) in the center of coating, and (c) at the top of coating.

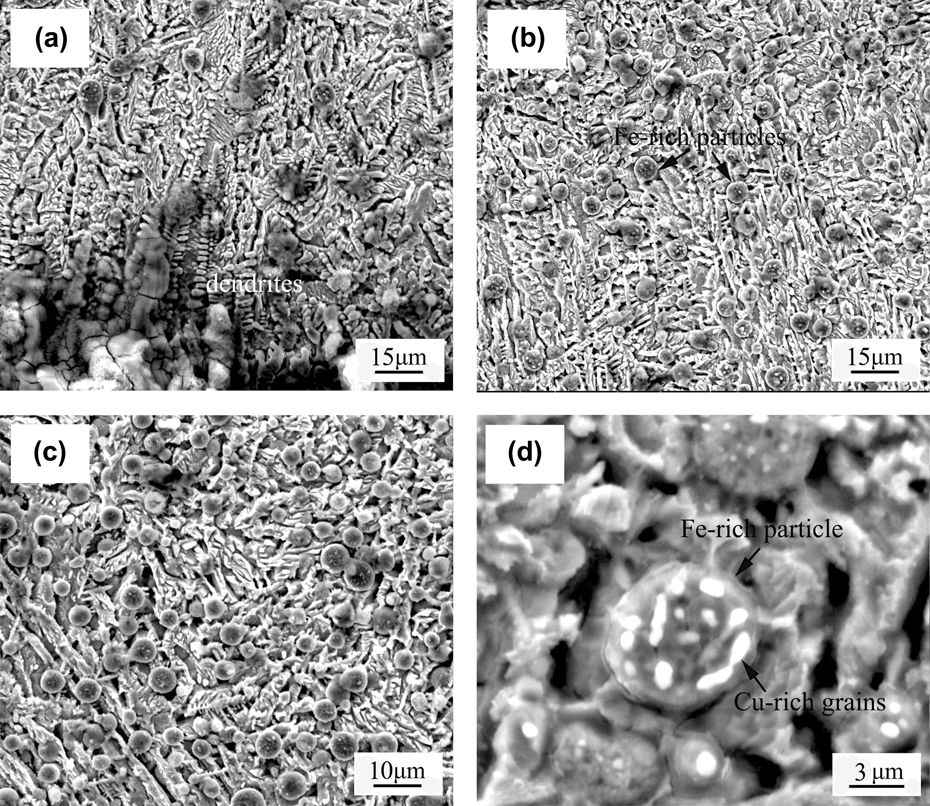
When Al content is 5 wt.%, the microstructure of Cu56.5Fe38Al5C0.5 coating is shown in Fig. 2. It can be seen from Fig. 2(a) that the dendrites are observed at the bottom of coating and the dendrite arm spacing is about 7 μm. EDS analysis demonstrates that the dendrite contains 79.24 wt.% Fe, 12.63 wt.% Cu, and 8.28 wt.% Al. In the center and at the top of coating, a large number of spherical particles with a diameter of about 5 μm are uniformly embedded in the matrix [Figs. 2(b) and 2(c)]. The spherical particle contains 80.45 wt.% Fe, 10.64 wt.% Cu, and 9.08 wt.% Al, whereas the matrix contains 75.34 wt.% Cu, 16.23 wt.% Fe, and 8.56 wt.% Al. It suggests that the spherical particles are rich in Fe and contain a supersaturated Cu, whereas the matrix is rich in Cu and contains a supersaturated Fe. Moreover, some fine Cu-rich grains are also precipitated inside the spherical Fe-rich particles, as shown in Fig. 2(d).
Microstructure of Cu56.5Fe38Al5C0.5 composite coating by LIHRC: (a) at the bottom of coating, (b) in the center of coating, (c) at the top of coating, and (d) magnified morphology of spherical Fe-rich particles.

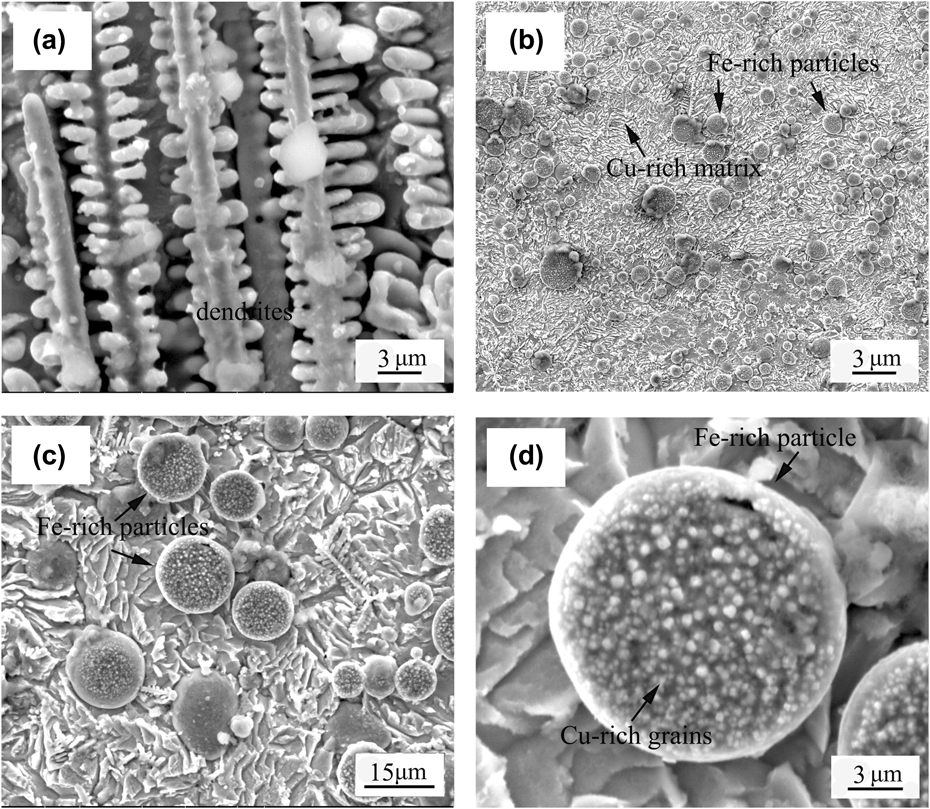
When Al content further increases to 10 wt.%, the microstructure of Cu53.5Fe36Al10C0.5 coating is shown in Fig. 3. The bottom of coating exhibits a fine dendritic microstructure [Fig. 3(a)]. The primary and secondary arm spacings are approximately 4 μm and 2 μm, respectively. EDS analysis indicates that the dendrite contains 72.23 wt.% Fe, 15.86 wt.% Cu, and 12.08 wt.% Al. In the center and at the top of coating, large amounts of spherical particles having a diameter of about 10 μm are dispersedly distributed in the matrix [Figs. 3(b) and 3(c)]. The spherical particle contains 74.37 wt.% Fe, 12.53 wt.% Cu, and 13.20 wt.% Al, whereas the matrix contains 64.25 wt.% Cu, 20.54 wt.% Fe, and 15.33 wt.% Al, showing that the spherical Fe-rich particles contain a supersaturated Cu and the Cu-rich matrix contain a supersaturated Fe. Furthermore, a large number of nanostructure grains that can be rich in Cu are also precipitated inside the Fe-rich spherical particles [Fig. 3(d)].
Microstructure of Cu53.5Fe36Al10C0.5 composite coating by LIHRC: (a) at the bottom of coating, (b) in the center and at the top of coating, (c) morphology of spherical Fe-rich particles, and (d) magnified morphology of spherical Fe-rich particle.

B. XRD analysis of coatings
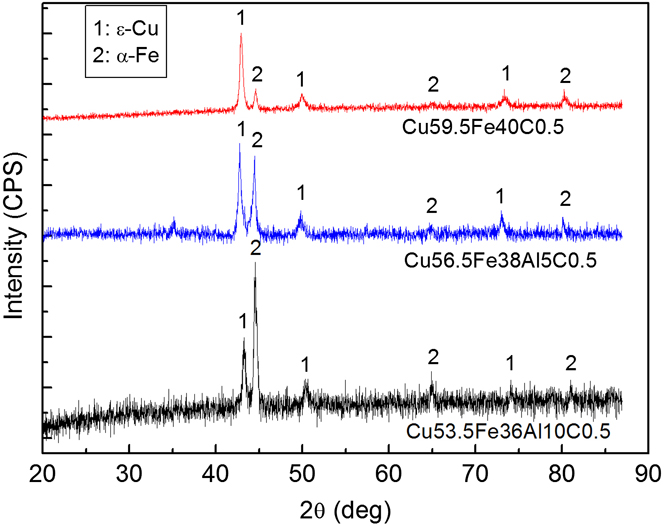
Figure 4 shows the results of XRD analysis of Cu–Fe-based coatings, which reveals the existence of α-Fe and ε-Cu phases. Both have a cubic crystal structure. It is noted that the intermetallic compounds such as Cu3Al and FeAl are not detected by x-ray diffractometer. In general, the strong diffraction peaks corresponding to ε-Cu are clearly detected and are moved somewhat toward left a small angle due to the solution of Al and Fe. Moreover, with the increase in Al content, the diffraction peak of ε-Cu is remarkably weakened and correspondingly, the diffraction peak of α-Fe with a relatively higher intensity is obtained.
X-ray diffraction results of Cu–Fe-based coatings containing different Al contents.

C. Corrosion properties of coatings
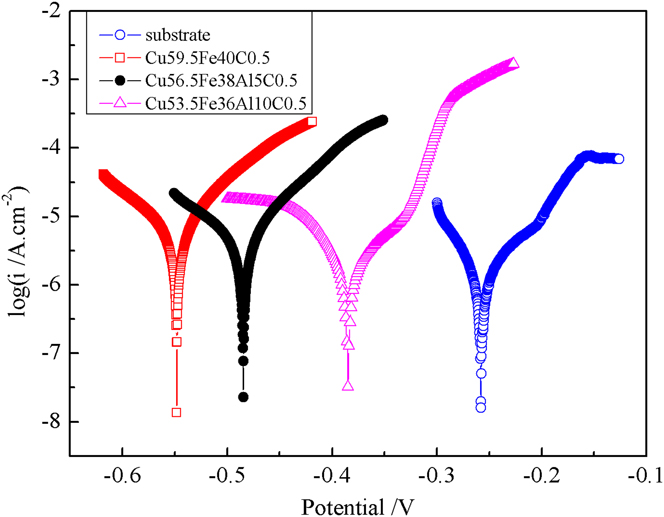
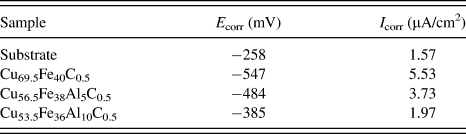
Figure 5 shows the polarization curves of Cu–Fe-based coatings and SUB in 3.5 wt.% NaCl solution at ambient temperature. The parameters of electrochemical corrosion properties such as corrosion potential (E corr) and corrosion current density (I corr) from Fig. 5 are listed in Table II. It can be seen that copper alloy SUB has a relatively higher E corr (−258 mV) and lower I corr (1.57 μA/cm2) than Cu–Fe-based coatings, showing that Cu–Fe-based coatings have a relatively lower electrochemical resistance compared to copper alloy SUB. However, with the increase in Al content, E corr gradually increases from −547 to −385 mV and I corr decreases from 5.53 to 1.97 μA/cm2, suggesting that the electrochemical resistance of Cu–Fe-based coatings strongly depend upon Al content. The results also demonstrate that Al addition in Cu–Fe-based coatings plays a positive role in improving the electrochemical resistance.
Potentiodynamic polarization curves of SUB and coatings in 3.5 wt.% NaCl solution.

Corrosion potential (E corr) and corrosion current density (I corr) of Cu–Fe-based coatings obtained from potentiodynamic curves in Fig. 5.

D. Microhardness characteristics of coatings
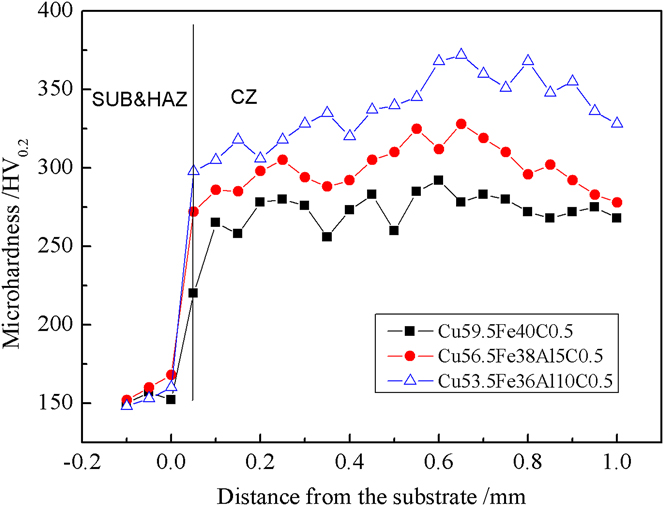
Figure 6 shows the microhardness distribution of different zones including cladding zone (CZ), heat-affected-zone (HAZ), and SUB. The results indicate that the addition of Al has an obvious effect on the microhardness of Cu–Fe-based coatings. With the increase in Al content, the average microhardness of CZ increases from 274 to 339 HV0.2. Especially, for Cu53.5Fe36Al10C0.5 coating, not only the average microhardness of HAZ is the highest (305 HV0.2), but also the microhardness of CZ can reach a maximum value of 372 HV0.2 which is approximately 2.4 times higher than that of copper alloy SUB (154 HV0.2).
Microhardness distribution of different zones including SUB, HAZ, and CZ in Cu–Fe-based coatings.

IV. DISCUSSION
According to the above results, the addition of Al has an important influence on the microstructure and properties of Cu–Fe-based coatings by LIHRC. With an increase in Al content, the size of Fe-rich particles generally increases but the dendrite arm spacing is further reduced, the number of Cu-rich grains precipitated inside the Fe-rich particles increases but the size reduces, and the electrochemical resistance and the microhardness of coatings are enhanced significantly.
Although the SUB is preheated by induction heater to decrease the temperature gradient between coating and SUB, LIHRC is still a rapid solidification process. For a simple qualitative analysis, the cooling rate, dT/dt (K/s), can be expressed as the product of solidification rate R (mm/s) and the temperature gradient G (K/mm). The previous results have indicated that R was on the order of the laser scanning speed.Reference Pei and De Hosson23 Thus, under the present experimental conditions, the calculated G is ∼1606 K/mm and the cooling rate is 6.7 × 10⁵ K/s (η = 2%, K = 180 W/m/K and T = 1550 K). Such high cooling rate significantly decreases the grain size. Moreover, according to the solidification speed distribution along the depth of the molten pool in a laser track described by Gilgien and Kurz,Reference Gilgien, Kurz, Mazunder, Conde, Vilar and Steen24 the characteristics of crystal growth depend on the constitutional undercooling ahead to the solidification interface, whose extent is related to the ratio of temperature gradient G to solidification rate R. With an increase in R and a decrease in G from the bottom to the top of molten pool, a constitutional undercooling is induced, which in turn results in the dendrites. Moreover, the increase in Al content can reduce the temperature of molten pool because the aluminum powder has much lower absorption rate of CO2 laser compared with Cu–Fe-based powder,Reference Hag and Hügel25 resulting in an increase in temperature gradient, cooling rate, and undercooling. Therefore, the aluminum addition can refine the dendritic microstructures in Cu–Fe-based coatings.
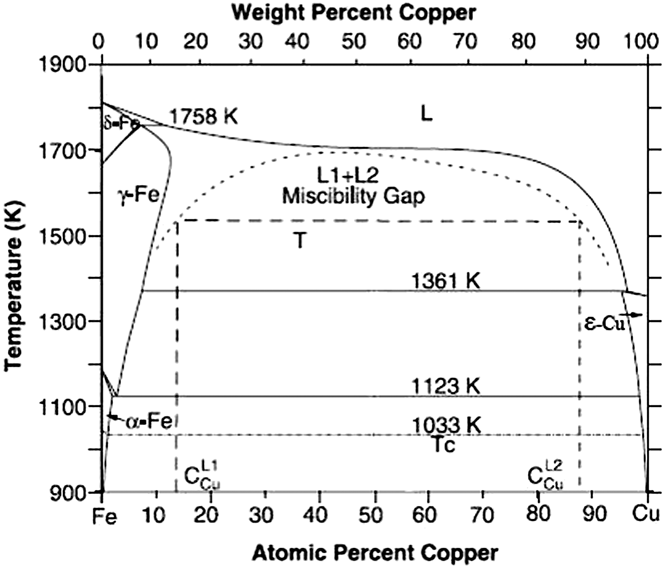
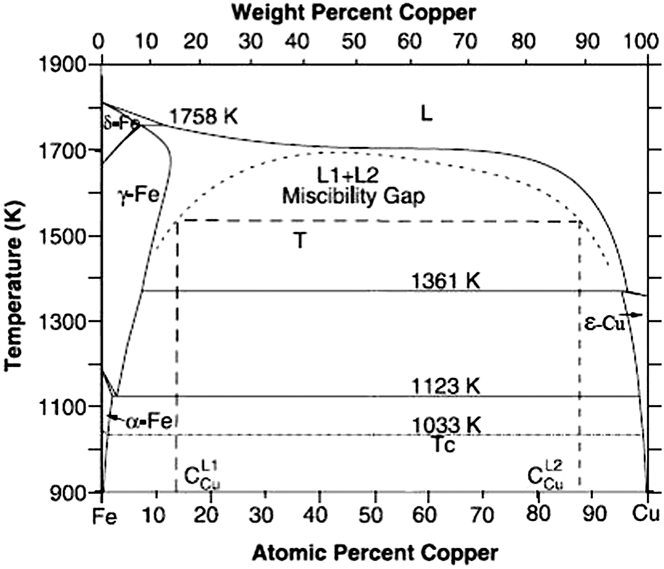
The high cooling rate can easily induce the dynamic undercooling.Reference Munitz, Venkert, Landau, Kaufman and Abbaschian15 The molten Cu–Fe alloy is readily undercooled into the immiscible gap, which in turn results in the liquid phase separation. According to the binary phase diagram of Cu–Fe alloy shown in Fig. 7,Reference Chen and Jin26 once the undercooling exceeds the liquid separation undercooling ΔT sep for entering the miscibility gap (i.e., ΔT sep = T m − T sep, T m is the melting point and T sep is a certain temperature below T m), the liquid phase separation occurs. Thus, Cu–Fe alloy liquid can be separated into two melts: one is Fe-rich melt (L1) and the other is Cu-rich melt (L2). Due to Cu–Fe alloy liquid containing more than 50 wt.% Cu, the Fe-rich melt as minor phase can shrink into droplets due to surface tension, whereas the Cu-rich melt as major phase transforms into the Cu-rich matrix liquid phase. These undercooled Fe-rich droplets move not only relative to the Cu-rich matrix liquid phase but also relative to each other owing to various forces such as gravity and convection. This process is mainly determined by Marangoni motion and Stokes motion. The velocity of Fe-rich droplet from Marangoni motion in a steady state is given in the followingReference Wang, Liu, Ohnuma, Kainuma and Ishida12:
 $${v_{\rm{m}}} = {{ - 2r} \over {3(3{{\rm{\mu }}_{\rm{d}}} + 2{{\rm{\mu }}_{\rm{m}}})}} \cdot {{\partial {\rm{\sigma }}} \over {\partial T}} \cdot G\quad ,$$
where r is the radius of Fe-rich droplet; μd and μm are the viscosities of Fe-rich droplet and Cu-rich matrix liquid phase, respectively;  ${{\partial {\rm{\sigma }}} \over {\partial T}}$ is the gradient of the interfacial energy between Fe-rich droplet and Cu-rich matrix liquid phase as a function of temperature; G is the temperature gradient.
Binary phase diagram of Cu–Fe system showing the existence of metastable miscibility gap above of 900 K.Reference Chen and Jin26
The velocity of Fe-rich droplet from Stokes motion can be estimated as followsReference Wang, Liu, Ohnuma, Kainuma and Ishida12:
 $${v_{\rm{s}}} = {{2g\Delta {\rm{\rho }}{r^2}} \over {3{{\rm{\mu }}_{\rm{m}}}}} \cdot {{{{\rm{\mu }}_{\rm{d}}} + {{\rm{\mu }}_{\rm{m}}}} \over {3{{\rm{\mu }}_{\rm{d}}} + 2{{\rm{\mu }}_{\rm{m}}}}}\quad ,$$
where g is the gravity coefficient and Δρ is the difference of density between Fe-rich droplet and Cu-rich matrix liquid phase.
According to Eqs. (1) and (2), the coefficient of competitive movement M defined as the ratio of v m to v s can be described as follows:
 $$M = {{{v_{\rm{m}}}} \over {{v_{\rm{s}}}}} = {{ - G} \over {g\Delta {\rm{\rho }}r}} \cdot {{\partial {\rm{\sigma }}} \over {\partial T}} \cdot {{{{\rm{\mu }}_{\rm{m}}}} \over {{{\rm{\mu }}_{\rm{m}}} + {{\rm{\mu }}_{\rm{d}}}}}\quad .$$
According to Eq. (3), if M is more than 1, the Fe-rich droplet mainly driven by Marangoni motion can migrate to the top of molten pool. On the contrary, if M is less than 1, the Fe-rich droplet mainly driven by Stokes motion can migrate to the bottom of molten pool. The following equation relates the viscosity of a metal to the temperatureReference Pei, Ocelik and De Hosson6,Reference Andrade27 :
 $${\rm{\eta }} = C\exp (E/RT)\quad ,$$
where C is a constant; R is the molar gas constant; E is the activation energy of the viscosity and can be described as followsReference Pei, Ocelik and De Hosson6:
 $$E = 0.431T_{\rm{m}}^{1.348}\quad .$$
Further, at the melting point T m, the viscosity of a liquid metal reads (in cP)Reference Andrade27:
 $${\eta _{\rm{m}}} = 5.7 \times {10^{ - 6}}{({A_{\rm{m}}}{T_{\rm{m}}})^{1/2}}/V_{\rm{m}}^{2/3}\quad ,$$
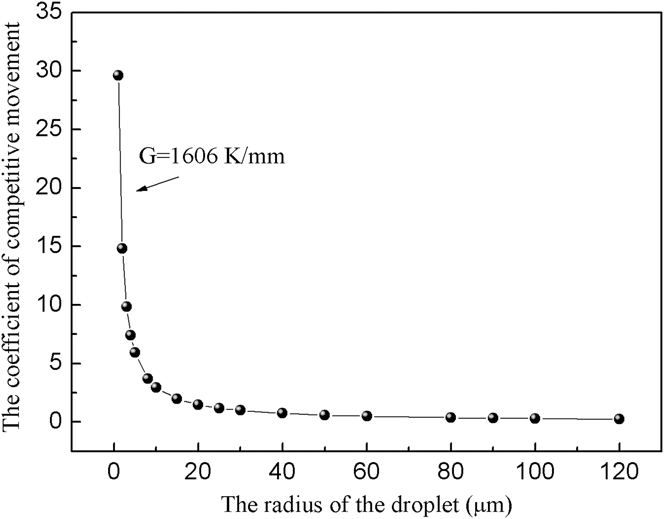
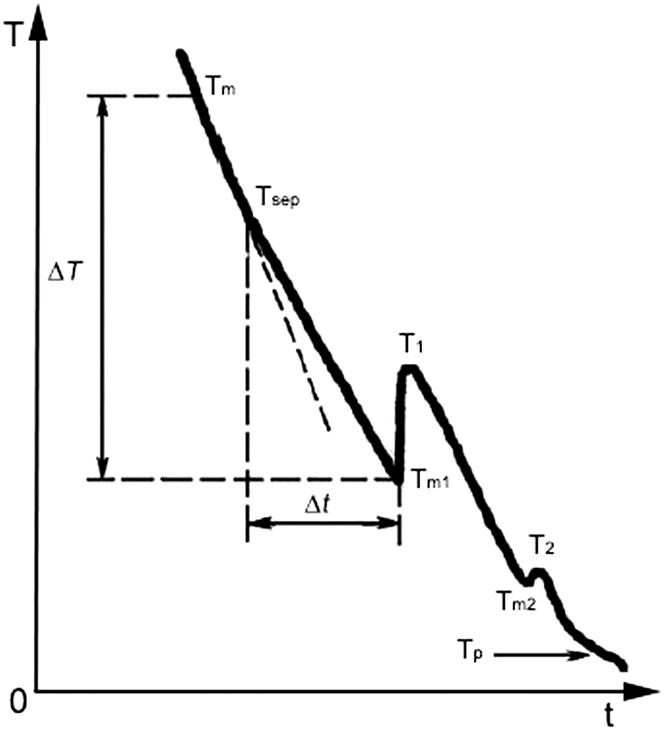
where A m is the atomic weight and V m is the atomic volume at T m. Combining Eqs. (4)–(6) provides a relationship between viscosity and temperature. Thus, the viscosity of Fe-rich droplet μd estimated (T = 1550 K) is 7.986 cP and the viscosity of Cu-rich matrix liquid phase μm estimated (T = 1550 K) is 3.25 cP. The relationship between the coefficient of competitive movement and the radius of Fe-rich droplet can be illustrated in Fig. 8 (g = 9.8 m/s2, Δρ = 0.8 g/cm2,  ${{\partial {\rm{\sigma }}} \over {\partial T}}$ = 0.5 × 10⁻³ J/m2, T = 1550 KReference Wang, Liu, Ohnuma, Kainuma and Ishida12). It can be seen that the coefficient of competitive movement decreases markedly with an increase in radius of Fe-rich droplet. When the coefficient of competitive movement is equal to 1, the radius of droplet is defined as the critical radius r 0 showing that the velocity of Fe-rich droplet driven by Marangoni motion is closely equal to that of Fe-rich droplet driven by Stokes motion. However, the spherical Fe-rich particles in Cu–Fe-based coatings by LIHRC have a diameter in the range of 2–10 μm, which is much less than the critical radius of Fe-rich droplet (about 29.6 μm). The gravity field plays a minor role in the velocity of the Fe-rich droplets. Therefore, the Fe-rich droplets that are mainly driven by Marangoni motion can move toward the top of molten pool. Meanwhile, these Fe-rich droplets can collide and coalesce with each other when they move toward the top of molten pool, as is called coagulation process. Moreover, according to the typical cooling curve of Cu–Fe alloy at the stage of liquid phase separation shown in Fig. 9,Reference Liu, Liu, Cheng, Yang, yang and Zhou28 the Fe-rich droplets and the Cu-rich matrix are still in a liquid state and can be further undercooled after liquid phase separation at T sep. Generally, the Fe-rich droplets L1 phase is expected to nucleate and solidify first due to relatively higher melting point. Therefore, when the temperature continuously decreases to the melting point of L1 (i.e., T m1), the temperature rise to T 1 due to the recalescence induced by the liberation of latent heat of crystallization from the solidification of L1 phase. After that, when the temperature further decreases to the melting point of L2 (i.e., T m2), the temperature also has a little rise to T 2 corresponding to the solidification of L2 phase. As mentioned above, the cooling rate and the undercooling increase due to Al addition. The liquid phase separation interval Δt defined as the time from T sep to T m1 also increases with increasing undercooling.Reference Liu, Liu, Cheng, Yang, yang and Zhou28 There is enough time for the Fe-rich droplets to collide and coalesce with each other before the solidification of Fe-rich droplets, showing that the addition of Al can accelerate the growth of Fe-rich droplets. Finally, the residue of the Cu-rich melt is solidified at the boundary finally to form the Cu-rich matrix. Thus, large amounts of Fe-rich particles are distributed dispersedly in the Cu-rich matrix and congregate in the center and at the top of coating [Figs. 1(c), 2(c), and c3(c)], which in turn results in the diffraction peak of α-Fe with a relatively higher intensity (Fig. 4). Additionally, when the Cu–Fe alloy liquid is cooled in the miscibility gap, the compositions of L1 and L2 melts attempt to follow the limits of the immiscibility boundaries if adequate time is allowed for the complete transfer of atoms between them.Reference Munitz, Bamberger, Wannaparhun and Abbaschian10 However, in the absence of such complete diffusion between L1 and L2 melts, the secondary phase separation of one liquid within the other can readily occur because further increase of high cooling rate can efficiently restrain such complete diffusion. Large amounts of nanostructure Cu-rich grains are precipitated inside the spherical Fe-rich particles. Thus, the size of Fe-rich particles as well as the number of Cu-rich grains precipitated inside the Fe-rich particles increases with an increase in Al content.
Relationship between the coefficient of competitive movement and the radius of the droplet.

Typical cooling curve of Cu–Fe alloy, where T m is the melting of Cu–Fe alloy, T m1 and T m2 are the melting points of Fe-rich and Cu-rich phase, respectively, T 1 and T 2 are the temperatures due to the generation of latent heat released by the solid nucleation of Fe-rich and Cu-rich phase, respectively, and T p is the peritectic reaction temperature.

Generally, lower I corr denotes the lower corrosion dynamic rate and positive E corr represents lower corrosion thermodynamic tendency. Compared with copper alloy SUB, the corrosion potential of Cu–Fe-based coatings shift toward the negative potential (Fig. 5). With an increase in Al content, the size of the Fe-rich particles increase, inside which the number of Cu-rich grains precipitated also increases but the size reduces. This leads to the favorable ratio consisting of large anode and small cathode.Reference Choi, Shin and Kim29 The Fe-rich particles as the anode will corrode very slowly, which in turn can efficiently protect the Cu-rich matrix and decrease the corrosion rate. Moreover, since aluminum oxides are more stable than iron oxides in neutral solutions, it can be assumed that the addition of Al can help to rapidly build up the aluminum oxide covered with Cu–Fe-based coatings. This is also confirmed by the polarization curves of Cu53.5Fe36Al10C0.5 coating due to the formation of weak passive film during the electrochemical corrosion, as shown in Fig. 5. Therefore, the electrochemical resistance of Cu–Fe-based coatings increases with increasing Al content.
The improvement in microhardness is explained by the following reasons. First, an increase in Al content can refine the microstructure due to higher cooling rate, which in turn results in the grain refinement strengthening. Second, compared to the negligible solid solubility of Cu in α-Fe phase and the limited solid solubility (4 wt.%) of Fe in ε-Cu in the equilibrium state, an enhanced solute trapping is obtained due to higher cooling rate when Al is added. Typically, the Fe-rich particles contain a supersaturated Cu and large amounts of Al, and the Cu-rich matrix contains a supersaturated Fe and high concentration of Al. Obviously, the increase in Al content efficiently provides an increase in solid-solution strengthening. Third, more fine Cu-rich grains are precipitated inside the Fe-rich particles with an increase in Al content, which in turn results in dispersion strengthening. Therefore, the microhardness of Cu–Fe-based coatings increases with an increase in Al content (Fig. 6).
V. CONCLUSIONS
(1) Three kinds of Cu–Fe-based coatings with different Al contents are produced by LIHRC on copper alloy SUB. The coatings are mainly composed of α-Fe and ε-Cu phases. With an increase in Al content, the size of Fe-rich particles generally increases but the dendrite arm spacing is further reduced, the number of Cu-rich grains precipitated inside the Fe-rich particles increases but the size reduces. Therefore, Al addition can be useful to improve the microstructure characteristics of Cu–Fe-based coatings during LIHRC.
(2) The increase of electrochemical resistance is attributed to large amounts of fine Cu-rich grains precipitated inside the Fe-rich particles, which results in large anode–small cathode effect when the amount of Al is increased. An increase in microhardness of Cu–Fe-based coatings is due to the combination of solid solution strengthening, dispersion strengthening, and fine grain strengthening. Obviously, Al addition plays a positive role in enhancing the properties of Cu–Fe-based coatings by LIHRC.
ACKNOWLEDGMENT
The support of this work by the Key Technology Projects of Jiangxi Province in China (Grant No. 20122BBE500031) is gratefully acknowledged.