Following calls to investigate mental illnesses at the symptom level rather than the disorder level, researchers in clinical psychology and psychiatry have been using multivariate statistical models, such as factor and network models, to better understand the between-person covariance structure between symptoms (Persons, Reference Persons1986; Fried and Nesse, Reference Fried and Nesse2015; Epskamp et al., Reference Epskamp, Kruis and Marsman2017a; Kotov et al., Reference Kotov, Krueger and Watson2018). Despite ongoing discussions on whether mental disorders are categorical or continuous in nature (Haslam et al., Reference Haslam, Holland and Kuppens2012; Borsboom et al., Reference Borsboom, Rhemtulla, Cramer, Van Der Maas, Scheffer and Dolan2016), they are in practice often studied as categories, where patients need to fulfill certain criteria to be included in clinical studies. Unlike many medical illnesses, however, no reliable biological markers that explain a substantial proportion of variance have been identified for the most common mental disorders. Therefore, the most common inclusion criterion for clinical research in psychology and psychiatry is that patients meet diagnostic criteria for a given disorder, as specified in the International Classification of Diseases (ICD-10; WHO, 2016) or the Diagnostic and Statistical Manual of Mental Disorders (DSM-5; American Psychiatric Association, 2013). As a result, researchers interested in investigating the covariance structure of symptoms in a clinical population usually select subjects based on the number of symptoms. This selection, however, is known to bias the covariance structure and is referred to as Berkson's bias in the literature (Berkson, Reference Berkson1946; Cole et al., Reference Cole, Platt, Schisterman, Chu, Westreich, Richardson and Poole2009): all statistical models estimated on such covariance matrices lead to biased results. Given the considerable prevalence of this practice, we consider this a substantial threat to the validity of covariance-based research in clinical sciences.
While Berkson's bias is widely acknowledged in the epidemiological literature (Berkson, Reference Berkson1946; Cole et al., Reference Cole, Platt, Schisterman, Chu, Westreich, Richardson and Poole2009; Westreich, Reference Westreich2012), the literature in psychology is limited to few papers that discuss this issue in relation to factor models (Meredith, Reference Meredith1964; Muthén, Reference Muthén1989; Nesselroade and Thompson, Reference Nesselroade and Thompson1995; Molenaar et al., Reference Molenaar, Dolan, Wicherts and van der Maas2010). For network analysis, Berkson's bias has only occasionally been mentioned (Epskamp and Fried, Reference Epskamp and Fried2018; Fritz et al., Reference Fritz, Fried, Goodyer and Wilkinson2018), and has never been thoroughly studied. This paper aims to address this gap in the literature by describing Berkson's bias in relation to a particularly popular type of multivariate network model: undirected network models from cross-sectional data for Gaussian and binary data (van Borkulo et al., Reference van Borkulo, Borsboom, Epskamp, Blanken, Boschloo, Schoevers and Waldorp2014; Epskamp and Fried, Reference Epskamp and Fried2018). First, we introduce the reader to Berkson's bias. Second, we present two simulation studies that assess how much of an impact a selection rule has on the performance of network estimations. To test this, we use summary statistics from the Sequenced Treatment Alternatives to Relieve Depression study (STAR*D; Fava et al., Reference Fava, Rush, Trivedi, Nierenberg, Thase, Sackeim, Quitkin, Wisniewski, Lavori, Rosenbaum and Kupfer2003; Rush et al., Reference Rush, Fava, Wisniewski, Lavori, Trivedi, Sackeim, Thase, Nierenberg, Quitkin, Kashner, Kupfer, Rosenbaum, Alpert, Stewart, McGrath, Biggs, Shores-Wilson, Lebowitz, Ritz and Niederehe2004). Third, we outline potential solutions to circumvent Berkson's bias and their pitfalls. Finally, we provide an R routine, berksonGenerator in the online Supplementary materials, which researchers can use to investigate the extent of Berkson's bias for their data as well as to perform simulation studies similar to the ones reported below.
Berkson's bias: conditioning on a collider
Throughout the paper, we will use the term Berkson's bias to refer to an estimation error due to selecting a subpopulation, but a variety of terms have been used to describe this bias: conditioning on a collider (Pearl, Reference Pearl2000), endogenous selection bias (Elwert and Winship, Reference Elwert and Winship2014), collider-stratification bias (Cole et al., Reference Cole, Platt, Schisterman, Chu, Westreich, Richardson and Poole2009) and collider bias (Westreich, Reference Westreich2012). As the different terms suggest, Berkson's bias arises when a selection rule is equivalent to conditioning on a collider. In a collider structure, two variables, A and B, both cause a third variable, C (A → C ← B). In other words, A and B have a common effect, C. Even if variables A and B are initially uncorrelated, conditioning on the common effect C makes A and B falsely dependent (Pearl, Reference Pearl2000; Koller and Friedman, Reference Koller and Friedman2009). Next, we will provide an example where two symptoms in a clinical sample are independent but become negatively correlated as a result of Berkson's bias.
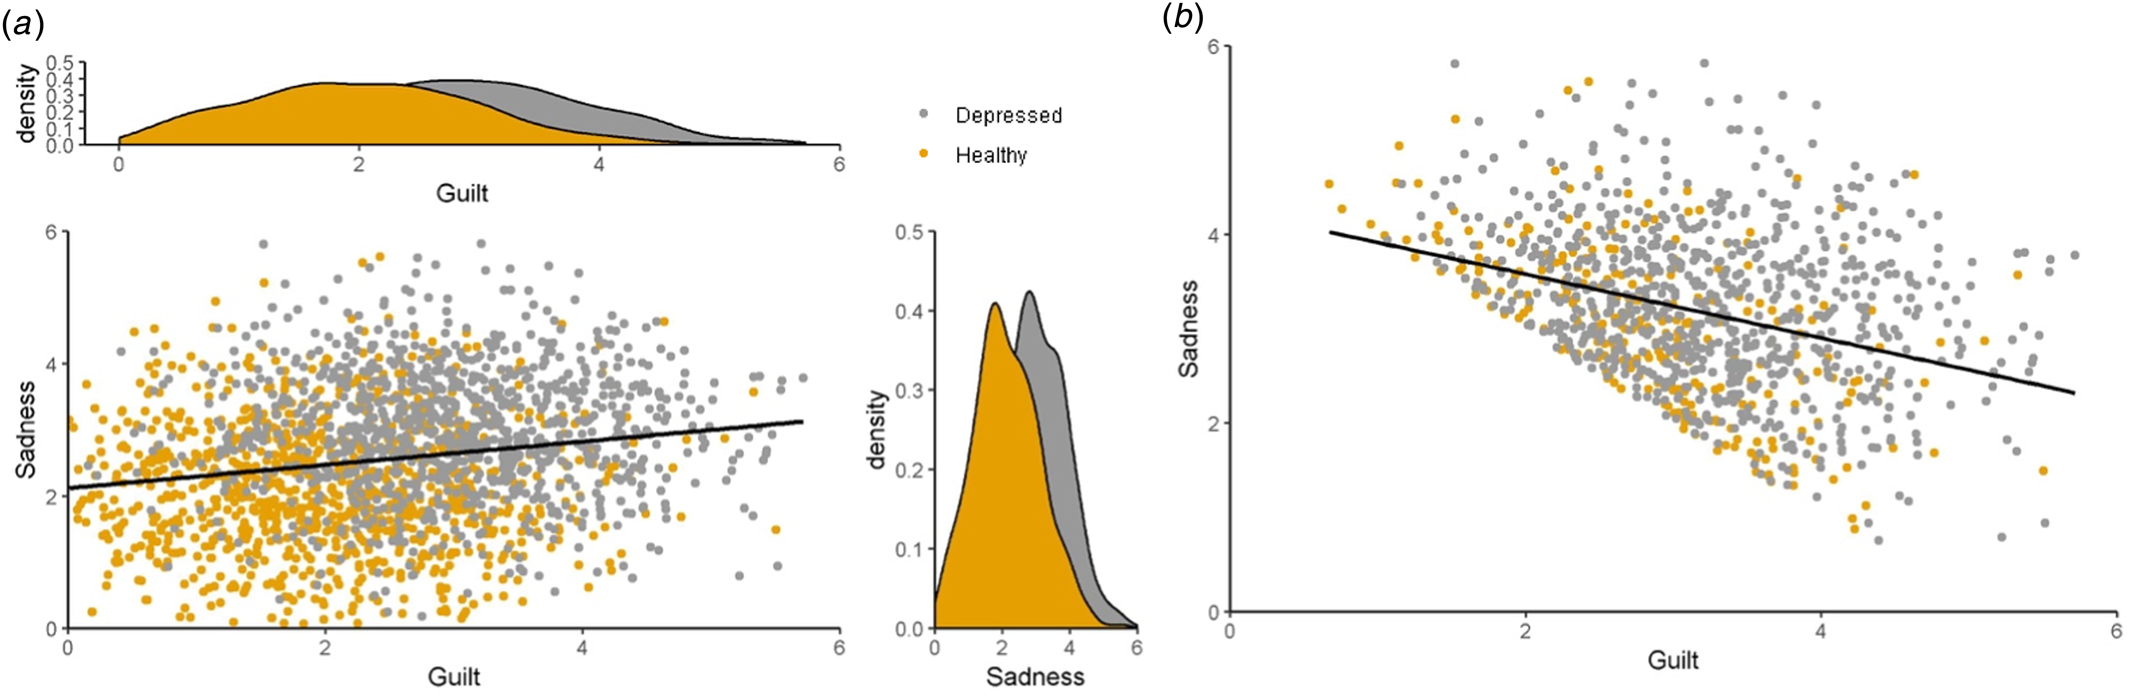
Suppose we want to investigate the relationship between the two depression symptoms: (A) sadness and (B) feelings of guilt. We measure the severity of the two symptoms in a sample of 2000 participants on a continuous seven-point scale ranging from 0 (‘Not at all’) to 6 (‘Extremely’) and add the scores to construct a symptom sum-score (‘depression severity’). Further, suppose the population consists of two equally large groups: a healthy group in which sadness and guilt are on average low, and a depressed group in which sadness and guilt are on average high (Fig. 1a). Within each of the two groups, there is no relationship between the two symptoms (r = 0). Nevertheless, across the entire population, a relationship emerges between the two symptoms (r = 0.2) if we do not control for group membership. Therefore, across the whole population, knowing that someone endorses sadness means the person is also more likely to show guilt. However, we are solely interested in the relationship between sadness and guilt in patients diagnosed with depression, and therefore select depressed participants based on, for example, a cut-off value of 5 in the sum-score of the two symptoms. Figure 1b illustrates that we would then observe a negative correlation of −0.35 in the selected group of participants. In other words, there is a discrepancy between the findings in the selected subpopulation (r = −0.35) and the actual relationship in the subpopulation (r = 0). Therefore, the selection of a subgroup with high sum-scores leads to a spurious negative correlation between sadness and guilt; a relationship that was not present before we knew – and conditioned on – the ‘depressed’ status of a person. Of note, to illustrate Berkson's bias continuous data were used, but the spurious negative correlation would also present if the data are ordinal, and therefore polychoric correlations are used.
The scatter plots illustrate the scores on sadness against guilt for the whole population (panel a; r = 0.2) and a selected subpopulation based on observed sum-scores above or equal to 5 (panel b; r = −0.35). Sadness and guilt are both measured on a continuous seven-point scale ranging from 0 (‘Not at all’) to 6 (‘Extremely’).

Simulation studies
In this section, we investigate the impact of Berkson's bias on two common network models used in clinical sciences: the Gaussian Graphical Model (GGM; Lauritzen, Reference Lauritzen1996; Epskamp et al., Reference Epskamp, Waldorp, Mõttus and Borsboom2018) and the Ising Model (Ising, Reference Ising1925; van Borkulo et al., Reference van Borkulo, Borsboom, Epskamp, Blanken, Boschloo, Schoevers and Waldorp2014; Marsman et al., Reference Marsman, Borsboom, Kruis, Epskamp, van Bork, Waldorp, Maas, Maris, Bork, Waldorp, Van Der Maas, Maris and Marsman2018). In these network models, variables are seen as nodes (circles) that are connected by edges (lines). These edges represent the partial correlation coefficients (i.e. the strength of the relationship between two variables after controlling for all other variables in the network); a missing edge represents a partial correlation of 0, a green edge a positive partial correlation, and a red edge a negative partial correlation. For tutorial papers on estimating these network models, we refer the reader to Epskamp et al. (Reference Epskamp, Rhemtulla and Borsboom2017b) and Epskamp and Fried (Reference Epskamp and Fried2018).
Methods
Study
Analyses in the current study were based on the Sequenced Treatment Alternatives to Relieve Depression (STAR*D; Fava et al., Reference Fava, Rush, Trivedi, Nierenberg, Thase, Sackeim, Quitkin, Wisniewski, Lavori, Rosenbaum and Kupfer2003; Rush et al., Reference Rush, Fava, Wisniewski, Lavori, Trivedi, Sackeim, Thase, Nierenberg, Quitkin, Kashner, Kupfer, Rosenbaum, Alpert, Stewart, McGrath, Biggs, Shores-Wilson, Lebowitz, Ritz and Niederehe2004)Footnote 1Footnote †. The STAR*D study is one of the largest and longest studies on the effectiveness of depression treatments with multiple treatment stages and features a representative depressed sample with many comorbidities. A detailed description of the sample and study design is available elsewhere (Rush et al., Reference Rush, Fava, Wisniewski, Lavori, Trivedi, Sackeim, Thase, Nierenberg, Quitkin, Kashner, Kupfer, Rosenbaum, Alpert, Stewart, McGrath, Biggs, Shores-Wilson, Lebowitz, Ritz and Niederehe2004). Since we analyzed the responses on the measurement scales after the first treatment phase, the sample contains the whole range of the depression continuum, from healthy to severely depressed. This makes this sample perfectly suited for our simulation study because it ensures a wide range of sum-scores to select data on.
Participants
Patients were recruited through both mental health and medical care practices. The age of the participants ranged from 18 to 75 years. From the 4041 participants who started the STAR*D study, the summary statistics of Fried et al. (Reference Fried, Epskamp, Nesse, Tuerlinckx and Borsboom2016) were based on a subset (n = 2807) from patients who completed the depression measurement scales at the end of the first phase of the study.
Measure
Hamilton Rating Scale for Depression (HRSD). The STAR*D used the clinician-rated 17-item HRSD at the beginning and end of the first treatment stage (Hamilton, Reference Hamilton1960; Rush et al., Reference Rush, Fava, Wisniewski, Lavori, Trivedi, Sackeim, Thase, Nierenberg, Quitkin, Kashner, Kupfer, Rosenbaum, Alpert, Stewart, McGrath, Biggs, Shores-Wilson, Lebowitz, Ritz and Niederehe2004). HRSD is one of the most commonly used depression measurement instruments (Santor et al., Reference Santor, Gregus and Welch2006). Items focus on the intensity of different aspects of depression, such as ‘loss of interest or loss of pleasure’. Each item was rated on a scale ranging from either 0–2 or 0–4. Reliability estimates of 0.46–0.97 have been reported for the HRSD, and external validity measures with other standard depression severity measures commonly range from 0.65 to 0.90 (Cusin et al., Reference Cusin, Yang, Yeung, Fava, Baer and Blais2009).
Many cut-off values have been used on the HRSD questionnaire to define different states of depression severity. In the current study, we used cut-off values where sum-scores from 0 till 7 are seen as healthy, 8–13 as mild, 14–18 as moderate, 19–27 as severe, and ⩾28 as very severe depression.
Statistical analysis
All analyses were conducted using the statistical software R (Team & R Development Core Team, 2016). We received a weighted adjacency matrix from Fried et al. (Reference Fried, Epskamp, Nesse, Tuerlinckx and Borsboom2016), which is from now on referred to as the true network. The weighted adjacency matrix encodes the network by containing all the partial correlations between nodes, wherein every node was an item from the HRSD.
Both simulation studies were based on the same procedure that contains three steps: (1) the true network was used to generate a new simulation dataset, (2) we estimated a network from a subset of the simulation data, based on a severity threshold (cut-off score) and sample size, (3) we compared how much the estimated network resembled the true network. This research design is suitable to assess the impact of Berkson's bias because all data were generated from the true network – which means that the network structure is completely identical across the two subpopulations (in our case, healthy and depressed). The differences in the estimated network and the true network can, therefore, solely be attributed to estimation error due to Berkson's bias.
We compared the generated networks with the true network on the correlation between estimated edge weights, sensitivity, and specificity. These measurements have been used in previous publications to assess the accuracy of estimated networks (van Borkulo et al., Reference van Borkulo, Borsboom, Epskamp, Blanken, Boschloo, Schoevers and Waldorp2014; Epskamp et al., Reference Epskamp, Rhemtulla and Borsboom2017b). Correlation measures the similarity between the estimated network and the true network by comparing the edge weights of the true model and the estimated edge weights. Sensitivity, or the true-positive rate, indicates the proportion of edges in the true network that was also estimated to have non-zero values in the generated network. Specificity, or the true-negative rate, refers to the proportion of missing edges in the true network that was also estimated to be missing in the generated network. Higher scores on all three metrics are associated with more resemblance to the true network and thus better performance of the network estimation (Epskamp and Fried, Reference Epskamp and Fried2018). In addition, we measured the relative amount of spurious negative edges and the density, to better explain patterns in previously described metrics. Spurious negative edges are estimated edges with a negative weight that do not feature a negative edge in the true network and are expected under Berkson's biasFootnote 2. To calculate a relative measure between 0 and 1, we divided the amount of spurious negative edges by the number of all possible edges. Density is the number of edges in the estimated network divided by the number of edges in the true network.
The estimated networks varied across (a) five different cut-off values, and (b) four different sample sizes. For all different cut-off conditions, we selected observations with a symptom sum-score that was equal or above the cut-off value. We added a cut-off score of 0 as a control condition, where the selection of observations is random. Furthermore, conditions also varied in sample size, since the sample size has a considerable impact on the accuracy of an estimated network (Epskamp et al., Reference Epskamp, Rhemtulla and Borsboom2017b). Sample size was varied between 500, 1000, 2500, 5000. For clarity, in a condition with a cut-off value of seven and a sample size of 1000, this means that 1000 observations with a sum-score above seven were selected. Whereas in control condition with zero cut-off, 1000 random observations were selected. We replicated every condition 100 times, leading to a total number of 2000 estimated networks per simulation study. No statistical tests were applied to the results of the simulation studies, as any difference in parameter estimates will be significant given large enough samples, which can be easily done in simulation work.
Simulation study 1: GGM
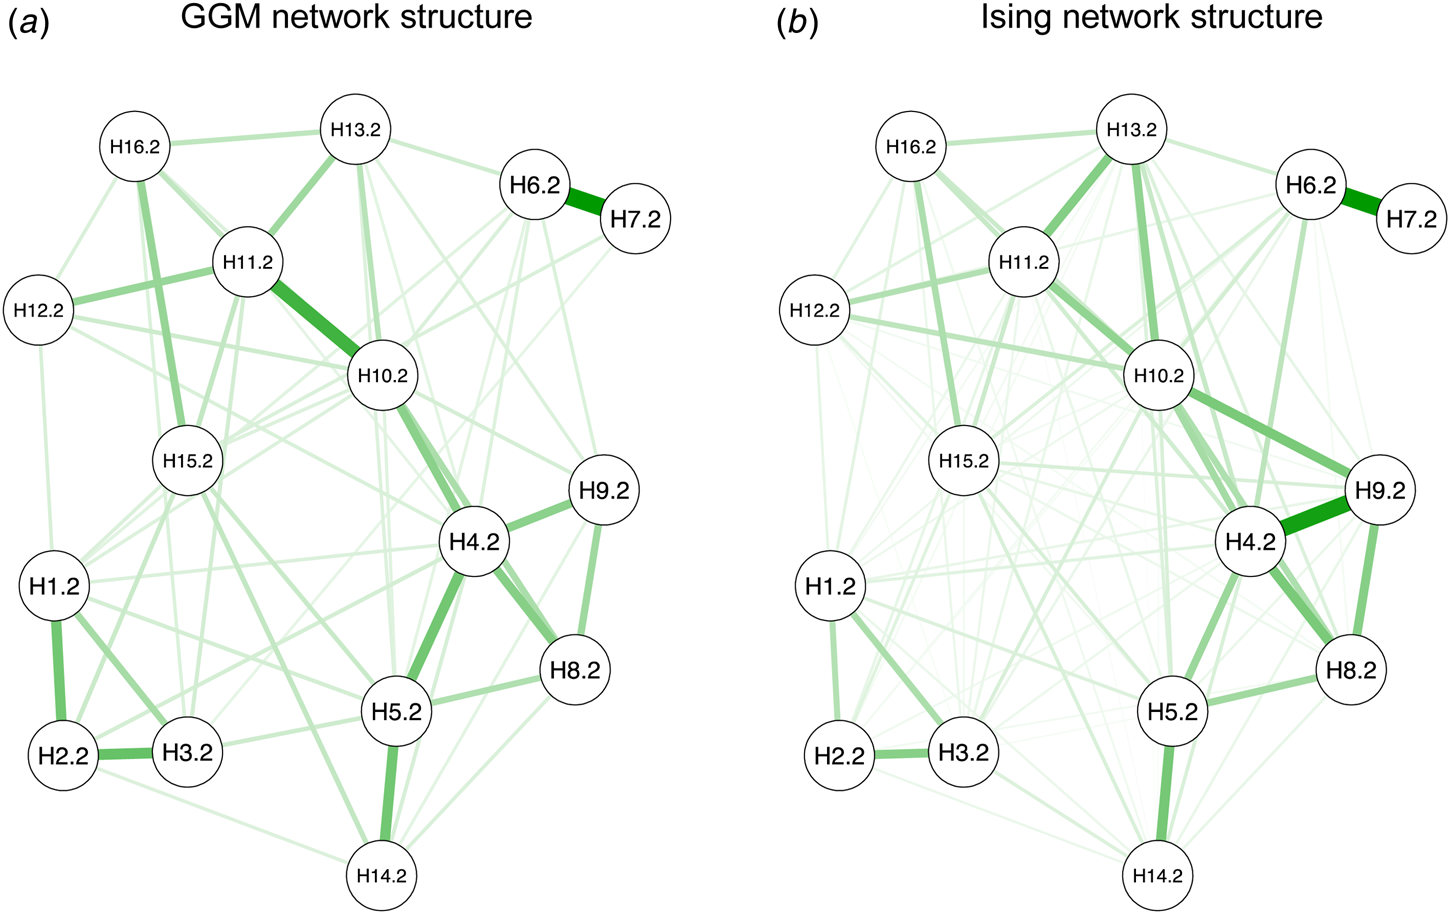
We received a weighted adjacency matrix (Fig. 2a) encoding a GGM from Fried et al. (Reference Fried, Epskamp, Nesse, Tuerlinckx and Borsboom2016)Footnote 3. These were originally obtained by applying the EBICglasso function from the qgraph package on the polychoric correlation matrix (γ = 0.5; Chen and Chen, Reference Chen and Chen2008), where every node was an item from the HRSD. We used the ggmGenerator function from the bootnet package to generate continuous data from the provided weighted adjacency matrix, and subsequently used the provided means and standard deviations to scale scores to the same scale as in the original data.
The plotted true network (a) from the HRSD measurement scale and (b) after the data from the HRSD measurement scale were dichotomized. The edge weights between any two nodes represent the partial correlations between them after controlling for all other nodes. The solid green lines represent positive associations between nodes and the dashed red lines negative associations. The stronger the association between nodes, the thicker and more saturated the edge is drawn in the network.

In every condition, we estimated a GGM network from a subset of the simulation data following the steps discussed by Epskamp and Fried (Reference Epskamp and Fried2018). These steps involve estimating Pearson correlations using the lavCor function from the R-package lavaan (Rosseel, Reference Rosseel2012), and then computing the network structure using the EBICglasso function from the R-package qgraph. This function uses the Least Absolute Shrinkage and Selection Operator (LASSO) regularization with Extended Bayesian Information Criterion (EBIC) model selection (γ = 0.5; Chen and Chen, Reference Chen and Chen2008). Such regularization techniques shrink small edge weights toward zero to control for spurious edges (Foygel and Drton, Reference Foygel and Drton2010). The hyperparameter γ controls the degree to which simpler models, i.e. models with fewer edges, are preferred; the higher the parameter, the simpler the models. It is typically set between 0 and 0.5 (Foygel and Drton, Reference Foygel and Drton2010). We selected participants based on cut-off scores varying between 0, 8, 14, 19, and 28.
Simulation study 2: Ising model
Study 2 is a repetition of study 1, with the only difference being that we used the Ising model instead of the GGM for data generation and network estimation. We received the weighted adjacency matrix (Fig. 2b) of the data provided by Fried et al. (Reference Fried, Epskamp, Nesse, Tuerlinckx and Borsboom2016), who computed the Ising model using the IsingFit function from the IsingFit package (γ = 0.5; Van Borkulo et al., Reference van Borkulo, Borsboom, Epskamp, Blanken, Boschloo, Schoevers and Waldorp2014) on the dichotomized data. As mentioned before, HRSD has items that are scored from 0 to 4 and from 0 to 2. For all items, responses higher than 0 were coded as 1; regardless of the number of answering options. The IsingSampler package was used to simulate a new dataset from this true network (Epskamp, Reference Epskamp2014). In every condition, we estimated a network from a subset of the simulation data with the IsingFit function (γ = 0.5) again. Due to the dichotomization of the HRSD data, there are no clinically established cut-off values in the literature to select observations on. Therefore, we selected participants so that the data contained roughly the same percentage of observations that were selected with the standard HRSD thresholding rule. Sum-scores from 0 till 4 were seen as no depression severity, 5 till 8 as mildly, 8 to 11 as moderate, 12 to 13 as severe, and a sum score above or equal to 14 as very severe.
Results
Results simulation study 1
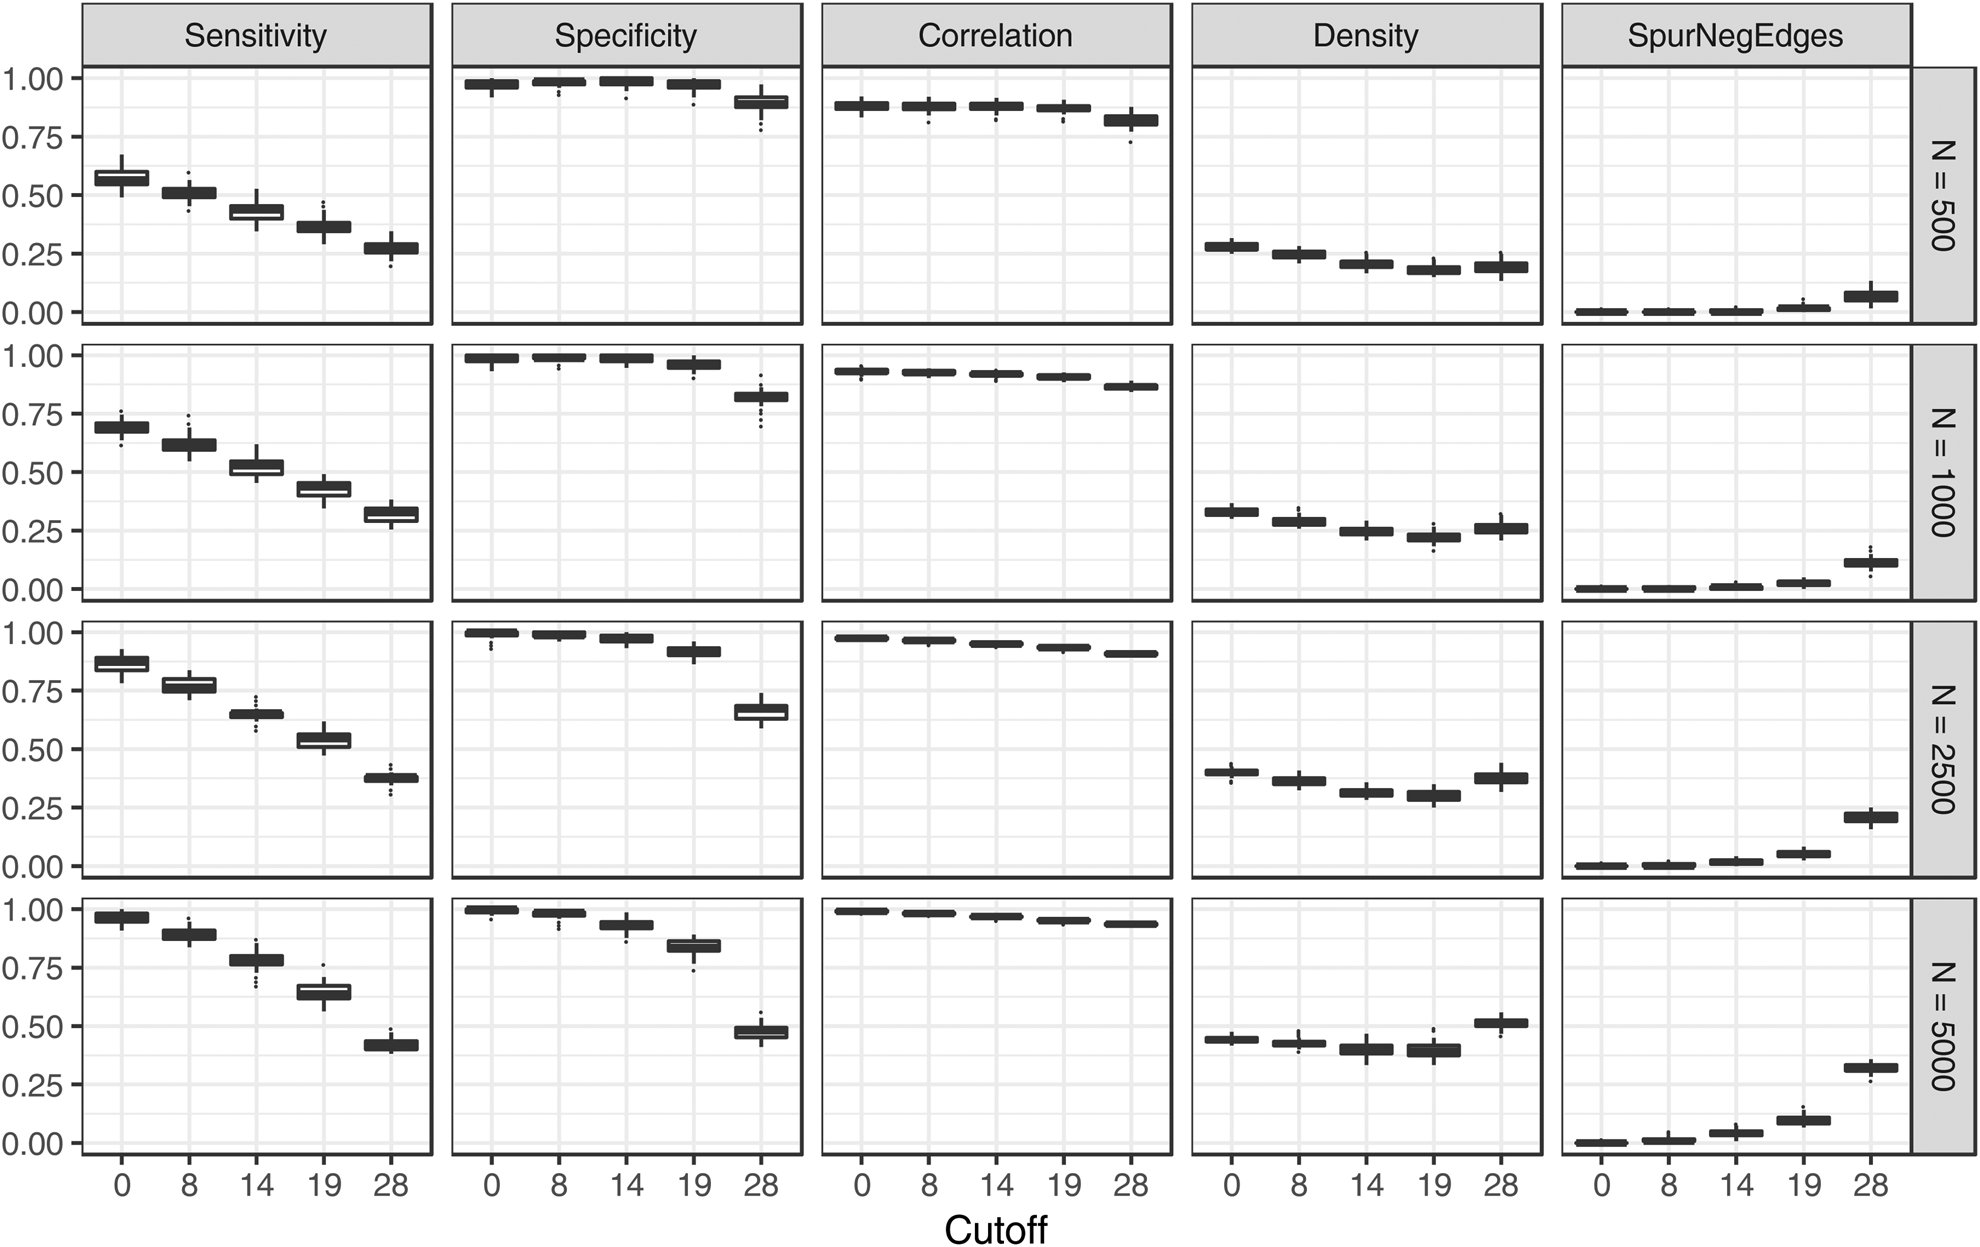
Figure 3 displays the results of all comparisons between the generated GGM networks and the true GGM network based on correlation, sensitivity, and specificity. The density and the relative amount of spurious negative edges are also displayed in this figure. Correlation, sensitivity, and specificity decrease, and the amount of spurious negative edges increases with more severe thresholding.
Simulation results for GGM estimations with different cut-off values and sample sizes. Every condition was simulated 100 times. The boxplots represent the distribution of those measures. The vertical panels indicate the different measures: correlation, sensitivity, specificity, density, and proportion of spurious negative edges. Horizontal panels indicate the different sample sizes used.

The density patterns have a light U-shape: First, the networks become less dense, but, at a certain point, the estimated networks increase in density. With low cut-off values, the estimated networks seem to be relatively dense with almost only positive edges (i.e. the density and sensitivity are high, while the amount of spurious negative edges is low). Then, with increasing cut-off values, positive edges get induced due to Berkson's bias and become almost zero (i.e. density and sensitivity lower, while spurious negative edges hardly change). However, if the cut-off selection becomes even more severe, some edges are pushed toward a negative sign (i.e. the density increases again due to the increase in spurious negative edges and the specificity decreases).
Of note, the decrease in correlation and sensitivity with cut-off value is less severe for higher sample sizes, even though there are, on average, more spurious negative edges with sample size. This makes sense since sample size increases the power to detect a true edge (Epskamp et al., Reference Epskamp, Rhemtulla and Borsboom2017b; Epskamp and Fried, Reference Epskamp and Fried2018). However, this magnified power also leads to picking up more false edges, resulting in more spurious negative edges with increasing sample size, which in turn lowers specificity. The decrease in specificity and increase in spurious negative edges implies that the false positives mainly consisted of falsely detected negative edges.
Results simulation study 2
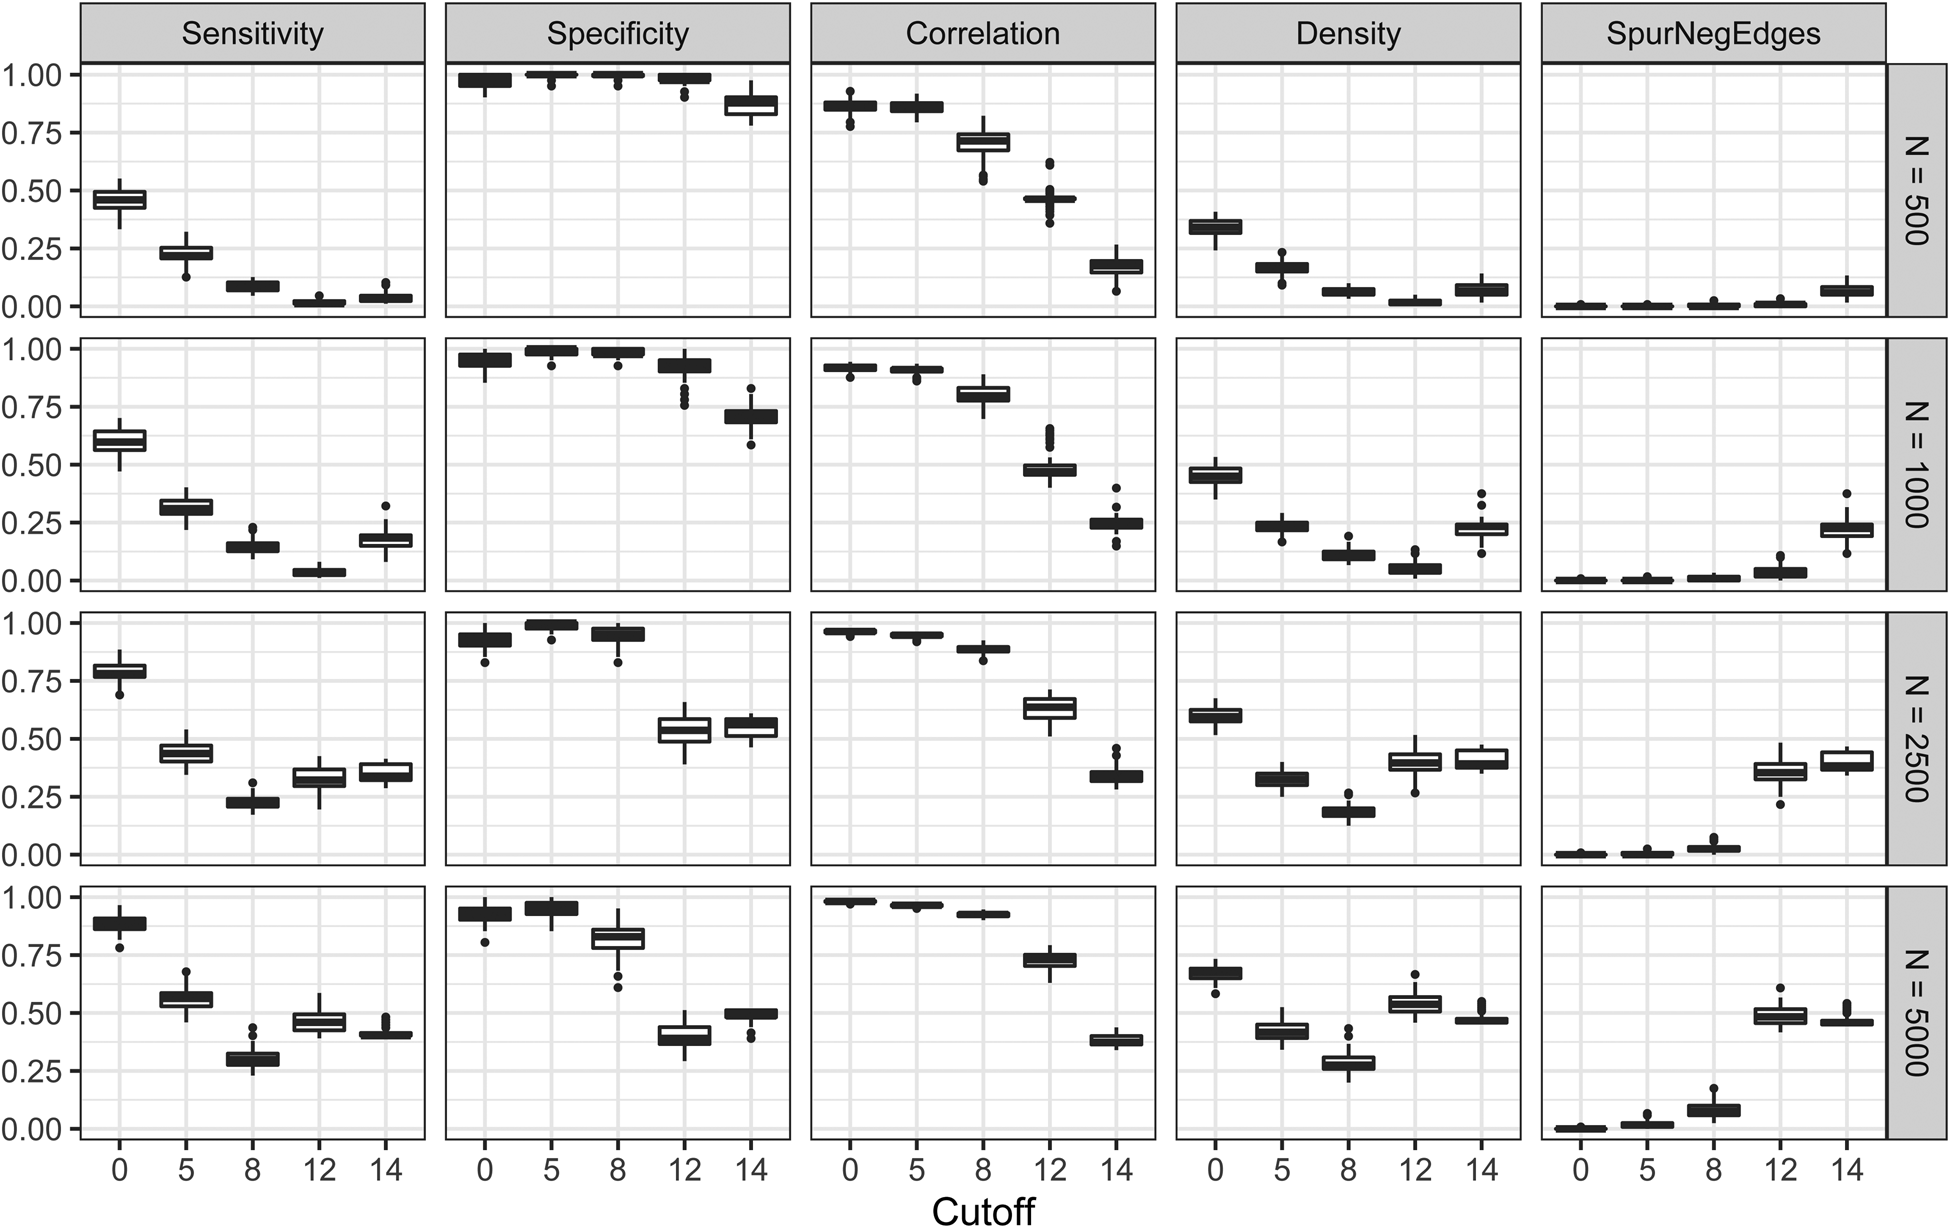
Figure 4 illustrates the comparison of the generated Ising networks with the true Ising network from Fig. 2b, based on correlation, specificity, sensitivity, and the relative amount of spurious negative edges. Furthermore, the density metric of the estimated networks is displayed. Figure 4 displays a similar pattern for the Ising models as for the GGMs: The higher the cut-off value, the lower the correlation (i.e. fewer resemblances to the true network) and the higher the amount of spurious negative edges. The sensitivity also decreases with the low sample size. In the N = 500 sample size condition sensitivity and density moved toward zero with cut-off value, since only empty networks were estimated due to the lack of power to detect edges. However, the sensitivity patterns in large samples show a U-shape.
Simulation results for the Ising model estimations with different cut-off values and sample sizes. See Fig. 3 caption for more details.

Of note, a comparison of Figs 3 and 4 indicates that, in general, correlation, sensitivity, and specificity are lower for Ising models than for GGMs. A possible explanation for these results is lower variance in sum-scores for the Ising model compared to the GGMs: the more limited the number of possible sum-scores to select observations on, the greater the influence of a selection rule.
Robustness
In the above two simulation studies, we focused on continuous and binary data. There is, however, a high prevalence of skewed ordinal data in clinical research. We refer the reader to the online Supplementary materials for a simulation study with skewed ordinal data for which we used polychoric instead of Pearson correlations. Results of this simulation on network estimation with ordinal data show roughly the same pattern as simulations with continuous and binary data. As expected, continuous and binary data showed that the control condition (0 cut-off) has the best recovery of the true network. What stands out when using ordinal data is the poor result of the recovery of the true network in the control condition without Berkson's bias, compared to selection with a low cut-off sum-score. Thus, instead of the constant downward trend with cut-off, as is seen in the previous two simulation studies, the correlation and specificity display lower values for the control condition than for some of the cut-off selection conditions. The most likely explanation for this finding is that although Berkson's bias is still present in the low cut-off conditions, the problem of the highly skewed data with many people reporting 0s is temporarily resolved by not selecting zero sum-scores, therefore making the data less skewed. Based on the performance of the ordinal simulation study alone, one might be tempted to say that a slight selection is a good thing. However, temporarily fixing one problem (skewed ordinal data) with another (Berkson's bias) is not a solution. While skewed ordinal data are a prominent problem in psychology, further work exceeding the simulation study in the online Supplementary materials is beyond the scope of the current paper.
Overcoming Berkson's bias
What possibilities are there to get around Berkson's bias? It may be tempting to select participants on an alternative instrument instead, such as an alternative questionnaire measuring the same symptoms, or to select participants on different but related symptoms than those used in the network. Appendix A shows that these strategies would not circumvent Berkson's bias in an additional simulation study. To establish guidelines for what kind of selection mechanism or statistical procedure is needed to investigate the correlational structure in the severe population, one first has to establish a theory on why the correlational structure is expected to differ in the severe population compared to the general populationFootnote 4. Two possible theories are discussed below.
Latent class/mixture hypothesis
The severe population forms a distinct separate class in which the correlational structure is fundamentally different from the healthy population. In this case, there are two possible methods for investigating relations among items in the severe population. First, mixture modeling can be used to investigate if the observed scores in the entire population come from a combination of several distributions. Mixture modeling assumes that multiple classes of participants (with different networks and severity levels) underlie the data, and methods aim to identify classes and a probability per person to be in each class that best explains the data. While, to our knowledge, mixture approaches to network models have not yet been investigated, multivariate Gaussian mixture models exist and should in principle also lead to partial correlation network for each class. There is no guarantee, however, that such mixture models will split the data into one healthy and one clinical population – the algorithm may very well detect two classes that are not separated roughly by theoretical sum-score cut-off criteria, such as two qualitatively different clinical classes.
A second method is selecting participants based on some independent criteria that is correlated with class membership but is not itself a function of the symptoms. Impairment or comorbidities, however, would not work, as these may still be a common effect of the symptoms aimed to be studied (e.g. comorbidity due to the network perspective; Cramer et al., Reference Cramer, Waldorp, van der Maas and Borsboom2010). An example that might work is to select participants based on genetic and environmental risk factors before the onset of depression. Such a selection procedure might not be optimal, as the sample would still include healthy participants from the general population, but the procedure would not induce Berkson's bias.
Moderation hypothesis
In contrast to healthy and clinical groups having different relations among symptoms, another possibility is that relations change depending on the severity of third variables (e.g. other symptoms, biological or genetic factors)Footnote 5. In the case of symptom networks, it could be that the link between symptoms A and B becomes stronger for higher levels of symptom C; we term this the moderation hypothesis. From the network perspective, the moderation hypothesis may be more desirable than the latent class hypothesis, as no latent mixture classes are necessary. Of note, such three-way interactions are often not assumed in multivariate research. For example, both structural equation modeling and network modeling typically assume data to be multivariate normal, and when multivariate normality holds, there can by definition only be pairwise (linear) relationships between the modeled variablesFootnote 6. Methods for handling higher-order interactions are currently being developed for both network models and latent variable models (Haslbeck et al., Reference Haslbeck, Borsboom and Waldorp2018).
Discussion
In this paper, we investigated the effect of Berkson's bias on the performance of network models and presented which potential methods can be used for handling Berkson's bias. Our results are that selecting a clinical population by symptom sum-scores negatively impacts the recovery performance of networks, which can largely be explained by an increase in spurious negative edges. These findings naturally pose a major concern for the interpretability of the network structures based on a selection rule defined by a function of the same variables that feature in the analysis, which are common in the clinical literature.
An important limitation of the present paper is that the conclusions are based on a simulation study of one dataset and are specific for the particular model setup and sample sizes used. Although we expect the effect to be present in many variations of network models, for future research it could be insightful to vary the network with respect to different numbers of nodes and density of the original network. We experienced what impact different data can have when we ran a simulation study with highly skewed ordinal data (see the online Supplementary materials). Due to the severe impact on performance when estimating psychopathology networks based on skewed ordinal data, proper handling of such data is a crucial topic of future research (Epskamp and Fried, Reference Epskamp and Fried2018). We hope that the berksonGenerator function that we provide in the online Supplementary materials will enable researchers to more easily perform such studies as well as to investigate the effect of a selection rule on the performance of the estimated network in their empirical data. Second, all simulation studies only investigated selection based on the sum-score, which is a simplification. Although some diagnoses strictly adhere to such a selection criterion, other diagnoses may be more complicated and require, for example, the presence of at least one of two core symptoms or the requirement that symptoms cause significant distress or impairment in important areas of functioning. While this is a theoretical caveat, clinical research is often based on rating scales, which (at least for depression) neither take core symptoms nor impairment into account when assigning a probable diagnosis for study inclusion. Finally, we only investigated the effect of Berkson's bias on studying between-subject effects and did not investigate popular within-subject network models based on time-series data (Bringmann et al., Reference Bringmann, Vissers, Wichers, Geschwind, Kuppens, Peeters, Borsboom and Tuerlinckx2013; Epskamp et al., Reference Epskamp, Waldorp, Mõttus and Borsboom2018). We expect that within-person dynamics (deviations from the mean) may be well retrieved in severe populations after selection on mean symptom levels above a certain criterion, but also that between-subject effects obtained from time-series data will then be similarly biased.
Our discussion on handling Berkson's bias highlighted that seeming solutions might not work in practice. Ideally, one would select participants on a classification that is independent of the variables included in the network model. We showed, however, that selecting participants based on an alternative measure of the same variables does not remove Berkson's bias due to overlap in content, nor does selecting participants on related variables remove Berkson's bias due to potential causal effects between the modeled variables and the variables used in the selection procedure. We discussed that any solution to Berkson's bias critically relies on the presumed reason as to why the correlational structure is expected to differ in the clinical population as compared to the general population, leading to potential solutions in mixture modeling or the inclusion of higher-order interactions. Such statistical methods, however, are still under development (Haslbeck et al., Reference Haslbeck, Borsboom and Waldorp2018).
Although from past research, it can be concluded that this bias applies to all models that rely on correlation, to the best of our knowledge, no previous research has focused explicitly on the impact of Berkson's bias on network models. This paper aims to direct attention to a significant methodological problem in the estimation of network models for clinical populations. This should not be understood as a criticism of investigating symptom covariance structures in clinical samples, or criticism of between-subject networks – both provide valuable avenues for future research. However, ignoring estimation errors due to Berkson's bias might lead to inferences not warranted given the data. We, therefore, want to encourage researchers to pay closer attention to this problem and hope to provide a step towards more accurate network models for clinical populations.
Supplementary material
The supplementary material for this article can be found at https://doi.org/10.1017/S0033291719003209
Appendix
A. Problems in selecting participants based on alternative measures
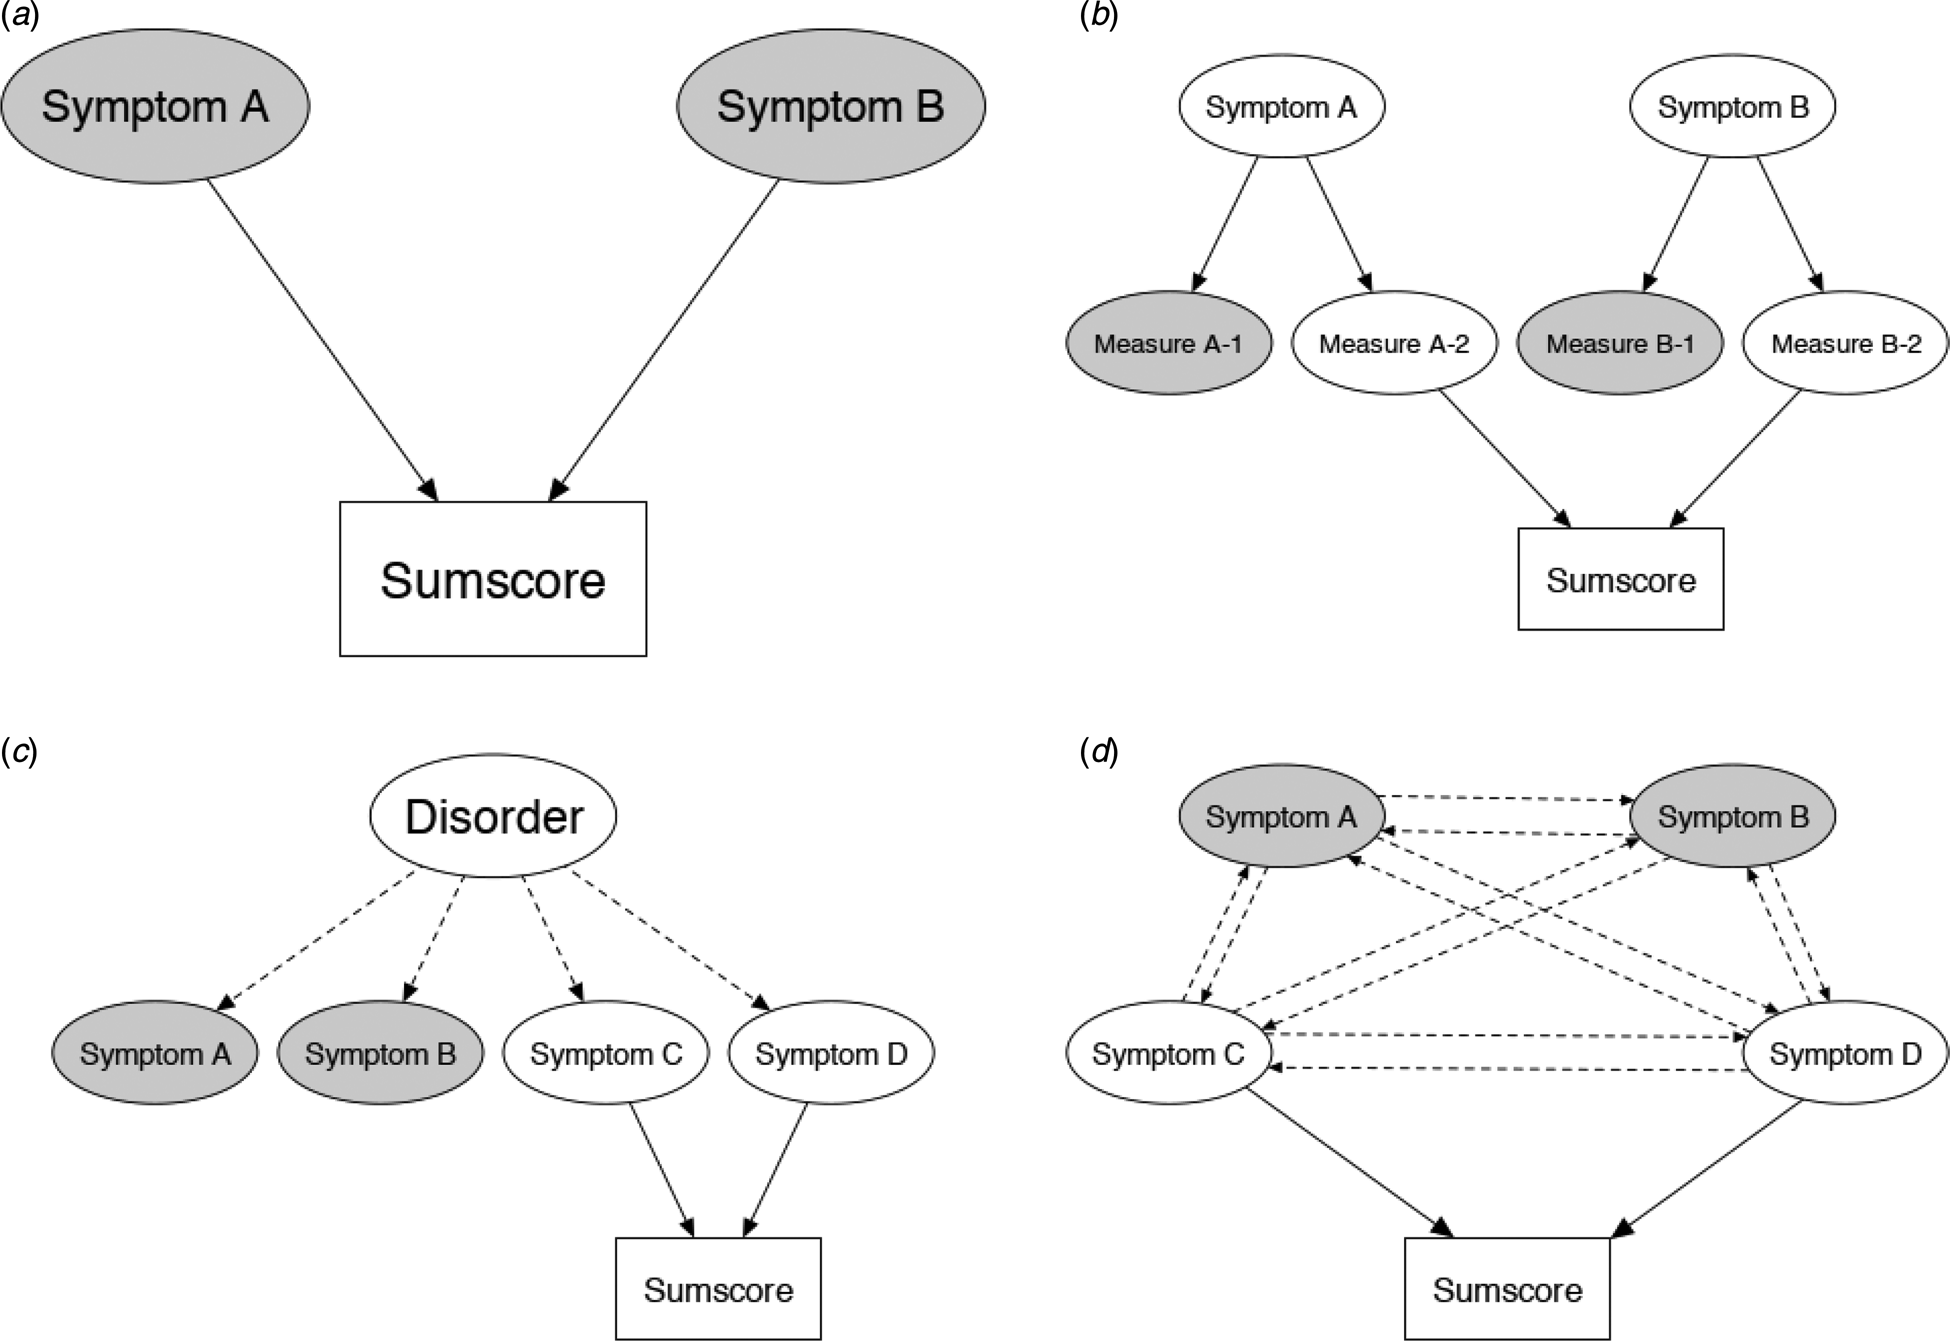
To investigate what strategies may be used to circumvent Berkson's bias, it is useful to make use of d-separation rules which could be applied to derive conditional independence relationships from causal path diagrams (Pearl, Reference Pearl2000). These rules dictate that two variables A and B are not conditionally independent after conditioning on another variable, C, if that variable is the middle node in a common effect structure (e.g. A -> C < - B) in one of the paths connecting A to B (disregarding the direction of effect). If two variables are independent, and if they become no longer independent after selection (conditioning on the variable), then they are biased. Panel a of Fig. 5 corresponds to the simplest causal structure that has already been discussed above. In this case, A and B (the gray nodes) are independent in the full population (there is no directed path from A to B or vice versa), but are no longer independent after conditioning on the sum-score; they are biased in the selected subpopulation.
Three strategies for conditioning on the sums-score to investigate the correlation between symptom A and B (gray nodes): conditioning on the sum-score of the symptoms themselves (a), conditioning on the sum-score of two alternative measures (b), and conditioning on the sum-score of other symptoms (c and d). Only in the case of situation (c), which assumes a latent variable model, is the correlation between symptom A and B not confounded by conditioning on the sum score.

One strategy to overcome Berkson's bias may be to use an alternative measurement of the symptoms with the goal to avoid obtaining spurious relations. Suppose we have two measurements of symptoms A and B (Fig. 5b), and we aim to establish a correlation between the symptoms using variables of the first measurement (A 1 and B 1), while selecting people based on a sum-score based on the second measurement (A 2 and B 2). Using d-separation rules, this sum-score would again be a middle node in the path connecting A to B of the first measurement; the symptoms A 1 and B 1 would erroneously be made dependent in the selected subpopulation even though the selection is based on the sum-score of an alternative measurement instrument. A second way to tackle the issue might be to use a different set of symptoms (C and D) to establish severity, as shown in Fig. 5c and d. While this would not bias the correlation between symptoms A and B from a latent variable perspective (panel c, the selection would not induce a correlation here), it could bias the correlation if real causal effects between symptoms exist (panel d, in some network configurations C and D would be common effects of A and B, leading to a bias). Such presumed causal relationships lie at the foundation of network psychometrics (Cramer et al., Reference Cramer, Waldorp, van der Maas and Borsboom2010; Borsboom, Reference Borsboom2017), and are therefore to be expected.
We should thus not expect conditioning on the sum-score of an alternative symptom-based questionnaire to take away Berkson's bias when investigating the correlational structure of symptoms. This is further evidenced by an additional simulation study reported in the Supplementary materials. We repeated the first simulation study, but instead of selecting participants on the sum-score of the HRSD, we selected participants based on the cut-off value of the Inventory of Depressive Symptoms, clinician-rated version (IDS-C) sum-score and estimated a network on the HRSD items. The results were comparable with simulation study 1: As the cut-off value on the IDS increased, the correlation, sensitivity, and specificity in networks estimated on HRSD symptoms all decreased, and the amount of spurious negative edges increased.