

Introduction
Compensatory gain is a biological phenomenon that describes the increased rate of body weight (BW) gain in animals when an adequate supply of dietary nutrients is restored following a period of dietary nutrient restriction (Skiba, Reference Skiba2005; Heyer and Lebret. Reference Heyer and Lebret2007). In pigs, the growth rate or the composition of gain may be manipulated via the type, timing, and duration of nutrient restriction at the growth period. Restricting protein or essential amino acids (AA) below the recommended levels for the pig can cause decreases in feed intake, BW gain, and feed efficiency (Castell et al., Reference Castell, Cliplef, Poste-Flynn and Butler1994; NRC, 2012).
Methionine (Met) is the second or third limiting essential AA in typical grain-based swine diets, and its deficiency can cause depression in BW gain and feed efficiency, especially in growing and finishing pigs (Chung et al., Reference Chung, Izquierdo, Hashimoto and Baker1989). Thus, commercial Met products, such as DL-Met, are commonly added to the conventional corn and soybean meal-based diets for pig production. However, data are scarce regarding if a re-alimentative feeding of the growing-finishing pigs previously exposed to a Met deficient diet can achieve compensatory gain. Therefore, three research objectives were proposed in this study. The first objective was to exam if a Met-deficient diet can lead to retarded growth in young growing pigs. The second objective was to see if using a nutrient-adequate diet after Met deficiency could yield compensatory gain in the growth retarded pigs. And the third objective was to compare the carcass characteristics between the once growth retarded pigs and the normal growth pigs.
Materials and methods
Animal trial and growth measurements
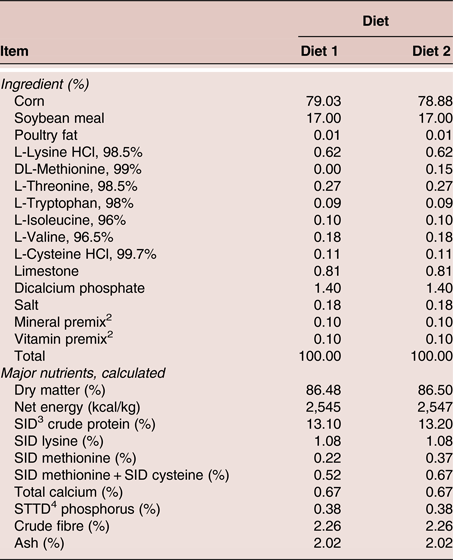
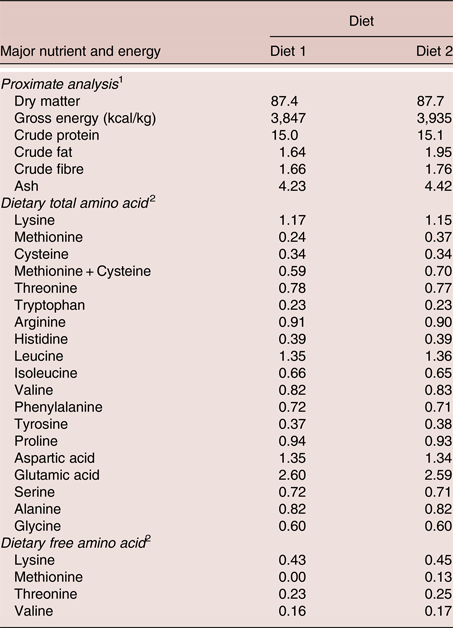
An animal feeding trial was conducted using 20 crossbred growing barrows (initial BW around 23 kg) purchased from a local commercial farm. The barrows were individually penned in an environmentally controlled swine barn at Mississippi State University Leveck Animal Research Center and allotted to one of two dietary treatments, according to a completely randomised experiment design (n = 10). A corn and soybean meal-based diet (Diet 1) was formulated to meet NRC (2012) recommended requirements for energy, crude protein, minerals, and vitamins. For all essential AA, except for Met, feed industry recommendations set by a software solution (AminoDat 5.0; Evonik Industries, Hanau-Wolfgand, Germany) were used. Diet 2 was made by supplementing crystalline DL-Met (Rhodimet, NP 99; Adisseo USA Inc., Alpharetta, GA, USA) to Diet 1 to meet pigs’ requirement for Met according to the AminoDat solution (Table 1). The calculated nutrient composition is also shown in Table 1, and the analysed major nutrient composition (as shown Table 2) was comparable to the calculated composition.
Composition of the experimental diets fed to the growing pigs (as-fed basis)1

1 L-Lysine HCl (containing 78.8% L-lysine) and L-threonine were purchased from Archer Daniels Midland Co. (Quincy, IL). L-Tryptophan and L-valine were donated from Ajinomoto Heartland, Inc. (Chicago, IL). L-Cysteine HCl (containing 76.9% L-cysteine) was purchased from Wuhan Grand Hoyo Co., Ltd. (Wuhan, Hubei, China).
2 Mineral premix (No. NB-8534) and vitamin premix (No. NB-6508A) were donated from Nutra Blend, LLC. (Neosho, MO). The calculated mineral and vitamin contents in both diets were (per kg of diet): Na, 1.0 g; Cl, 2.9 g; K, 5.6 g; Mg, 1.3 g; S, 1.4 g; Cu, 16.3 mg; Fe, 169.9 mg; I, 0.20 mg; Mn, 37.1 mg; Zn, 131.3 mg, Se, 0.28 mg; vitamin A, 4,401 IU; vitamin D3, 550 IU; vitamin E, 35.6 IU; vitamin K, 1.76 mg; vitamin B1, 2.34 mg; vitamin B2, 4.61 mg; niacin, 42.5 mg; vitamin B5, 16.3 mg; vitamin B6, 5.04 mg; biotin, 0.09 mg; folacin, 0.35 mg; vitamin B12, 15.4 µg, and choline, 1.35 mg.
3 SID = standardised ileal digestible.
4 STTD = standardised total tract digestible.
The analysed nutrient composition (%, or as indicated) of the two experimental diets fed to the growing pigs (as-fed basis)

1 Proximate and energy analyses were conducted at the Essig Animal Nutrition Laboratory, Mississippi State University (Starkville, MS).
2 Amino acid analyses were conducted at the analytical laboratories of Ajinomoto Heartland, Inc. (Chicago, IL, USA) and Evonik Nutrition & Care GmbH (Hanau-Wolfgang, Germany). The amino acid values presented are the mean values from the two laboratory analyses.
After a seven-day adaptation period in individual pens, pigs were allowed ad libitum access to the allocated experimental diets and fresh water throughout the trial. Pigs, feeders, and drinking systems were checked two to three times daily (06:00 to 22:00 h) to ensure feed and water availability, proper function of the facility and pig health status. Any feed refusals were collected and weighed for calculation of feed intake.
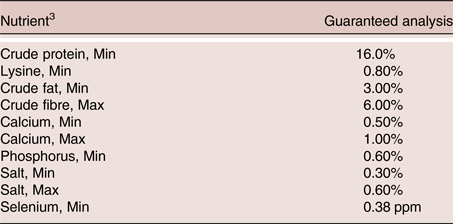
Body weights were measured immediately before, and at the end of, the 31-day dietary treatment period. Feed intake was measured, and the average daily gain (ADG), average daily feed intake (ADFI), and gain to feed (G:F) ratio were then calculated accordingly. After the 31-day treatment period, all pigs were fed a normal common commercial grower-finisher diet (Table 3) until market weight (around 120 to 130 kg), which lasted 55 or 62 days. The BW was measured every one or two weeks during the period after the Met restriction and the ADG were calculated accordingly. All experimental protocols used in this study were approved by the Mississippi State University Institutional Animal Care and Use Committee.
Composition of the commercial grower-finisher diet fed to the pigs during the nutrient re-alimentation period1, 2

1 The ingredients used in this diet: grain products, processed grain by-products, plant protein products, animal protein product, calcium carbonate, salt, vitamin a acetate, vitamin D3 supplement, vitamin E supplement, menadione sodium bisulphite complex (source of vitamin K), vitamin B12 supplement, calcium pantothenate, niacin supplement, riboflavin supplement, choline chloride, pyridoxine hydrochloride, thiamine mononitrate, biotin, folic acid, sodium bentonite, ferrous sulphate, zinc sulphate, manganese sulphate, copper sulphate, calcium iodate, and sodium selenite.
2 This diet was a complete ration for growing pigs, manufactured by Ware Milling, Inc. (Product code 2151; Houston, MS, USA). All the data reported in this table were directly obtained from the product commercial tag.
3 Min = minimal content; Max = maximal content.
Carcass measurements
Due to facility limitations, pigs were harvested on two different days (one week apart) at the Mississippi State University Meat Science and Muscle Biology Laboratory. Five heaviest pigs from each dietary treatment were grouped together as Block 1 and slaughtered at the laboratory on Day 55 after the normal feeding period. The five remaining pigs from each treatment group were grouped together as Block 2 and harvested on Day 62 after the normal feeding period.
At slaughter, pigs were stunned by electric shock, exsanguinated, and de-haired. The head and feet were removed, and the hot carcasses were eviscerated and split longitudinally into halves, which were weighed prior to storage below 4 °C. The dressing percentage was calculated by dividing the whole hot carcass weight by the live weight and multiplying by 100. Carcass characteristics were assessed according to the US pork industry standards (Berg, Reference Berg2000). The chilled carcass weight was determined after 24 h storage in the cooler. Carcass length was measured from the anterior edge of the first rib to the anterior edge of the aitch bone. The right half of each carcass was then separated into five primal cuts which were ham, Boston shoulder, picnic shoulder, loin, and belly (NAMP, 2007). The ham was separated from the carcass by a straight cut approximately perpendicular to a line parallel to the shank bones. The cut passed through a point which is between 3.8 and 8.8 cm from the anterior edge of the aitch bone. The shoulder, composed of Boston shoulder and picnic shoulder, was separated from the carcass side by a straight cut that was approximately perpendicular to the length of the side and posterior to the elbow. Boston shoulder and picnic shoulder were then separated by a straight cut, dorsal to the shoulder joint, at a right angle with the belly side. The belly was prepared by a straight cut that extended from a point that was ventral to the longissimus on the shoulder end to a point on the leg end ventral to the tenderloin. The loin was the top portion of the side remaining after removal of the ham, shoulder and belly.
The average back-fat thickness was evaluated by averaging three measurements at the first rib, the last rib, and the last lumbar vertebra. The back-fat thickness at the 10th rib was also measured. Each of the primal cuts was weighed separately, and the total lean cut weight was determined by adding together the weights of Boston shoulder, picnic shoulder, loin, and trimmed ham. The lean cut percentage was calculated by dividing the total lean cut weight by the chilled carcass weight and multiplying by 100 (Berg, Reference Berg2000).
The loin eye was scored for colour, firmness and marbling. It was subjectively evaluated using a five-point scale, ranking from 1 (pale, soft, and devoid of marbling) to 5 (dark, firm, and moderately abundant or greater marbling). The area of loin eye was measured using a plastic grid (Product Number AS 0235E, Extension and Outreach, Iowa State University, Ames, IA, USA), in which the grid was placed over a tracing of a loin eye. The dots on the grid that fell into the boundaries of loin eye tracing were counted, and then the dot numbers were converted to loin eye area (cm2).
Statistical analysis
Data was statistically analysed using SAS (version 9.4; SAS Institute Inc., Cary, NC, USA). The growth performance data were analysed using Student t-test for a completely randomised experiment design. The measurements of carcass characteristics were analysed using the GLM Procedure for a randomised complete block design with the Met level as the main effect and the slaughter date as the block. Significant difference was declared at P ≤ 0.10.
Results and discussion
Growth retardation model
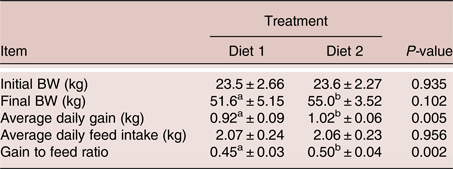
At the beginning of the 31-day feeding trial, the average BW was not different between the pigs fed Diet 1 and Diet 2, respectively (23.5 vs. 23.6 kg; P = 0.935; Table 4). At the end of the feeding trial, however, pigs fed Diet 1 had a lighter BW compared with those fed Diet 2 (51.6 vs. 55.0 kg; P = 0.102). The Diet 1 fed pigs had significantly lower ADG than that those fed Diet 2 (0.92 vs. 1.02 kg/d; P = 0.005). There was no difference in the ADFI between the pigs fed Diets 1 and 2 (2.07 vs. 2.06 kg/d; P = 0.956), hence the Diet 1 pigs had a lower G:F ratio compared with Diet 2 pigs (0.45 vs. 0.50; P = 0.002).
The growth performance of the pigs fed a methionine-deficient or a methionine-adequate diet for 31 days1

1 Diet 1 = a methionine-deficient diet; Diet 2 = a methionine-adequate diet. Each value is a mean ± standard deviation (n = 10).
a,b Means within a row that have different superscripts differ (P ≤ 0.10).
The crude protein or AA effect on animal performance has been previously studied, and similar results were obtained concerning lysine and methionine. Castell et al. (Reference Castell, Cliplef, Poste-Flynn and Butler1994) fed diets with varying levels of soybean meal to growing-finishing pigs and found that as dietary crude protein was decreased, feed intake remained unchanged, but growth rate was slowed, and the G:F ratio was decreased. Friesen et al. (Reference Friesen, Nelssen, Unruh, Goodband and Tokach1994) fed two different levels of lysine and recorded increased ADG in the pigs fed the high level of lysine. Kamalakar et al. (Reference Kamalakar, Chiba, Divakala, Rodning, Welles, Bergen, Kerth, Kuhlers and Nadarajah2009) manipulated dietary lysine levels during the growing phase and observed that a decrease in dietary lysine level caused a decrease in pig ADG. In addition, De la Llata et al. (Reference De la Llata, Dritz, Tokach, Goodband and Nelssen2002) replaced soybean meal with synthetic lysine and found that greater than 0.15% substitution in the diet caused poorer ADG, ADFI, and G:F ratio in pigs due to deficiencies of other AA. Yesmin et al. (Reference Yesmin, Uddin, Chacrabati and Al-Mamun2013) fed four different levels of Met to rabbits and observed that higher Met levels improved nutrient digestibility, decreased feed conversion ratio, and improved performance. Li et al. (Reference Li, Zhang, Chen, Ying, Su, Zhang and Wang2017) noted an improved expression of myogenic genes and a greater loin muscle area in Met supplemented, low birth weight piglets.
The difference in ADG between the two treatment groups of pigs in this study can be attributed to the lack of Met in Diet 1, which caused a lower efficiency of AA utilisation or body protein synthesis. Besides functioning as a building block for protein biosynthesis, Met is commonly known as the start codon in mRNA translation. If an animal receives an inadequate amount of Met via the diet, mRNA translation decreases and protein synthesis is inhibited. The lower ADG in Diet 1 pigs led to a lower final BW when compared with Diet 2 pigs. This was not due to any other nutritional aspect since all other dietary needs were met in the ration, and Diet 1 pigs consumed just as much as Diet 2 pigs according to the measured ADFI (Table 4). A similar ADFI was expected because the net energy content (considered to be the major factor affecting feed intake) was the same between the two diets (2,545 vs. 2,547 kcal/kg; Table 1). The lower final BW of Diet 1 pigs coupled with an equivalent ADFI caused them to exhibit a diminished G:F ratio. So, at the end of the 31-day feeding period, the pigs fed Diet 1 were elected to serve as a growth retardation model and used for the following nutrient re-alimentation study.
Compensatory gain
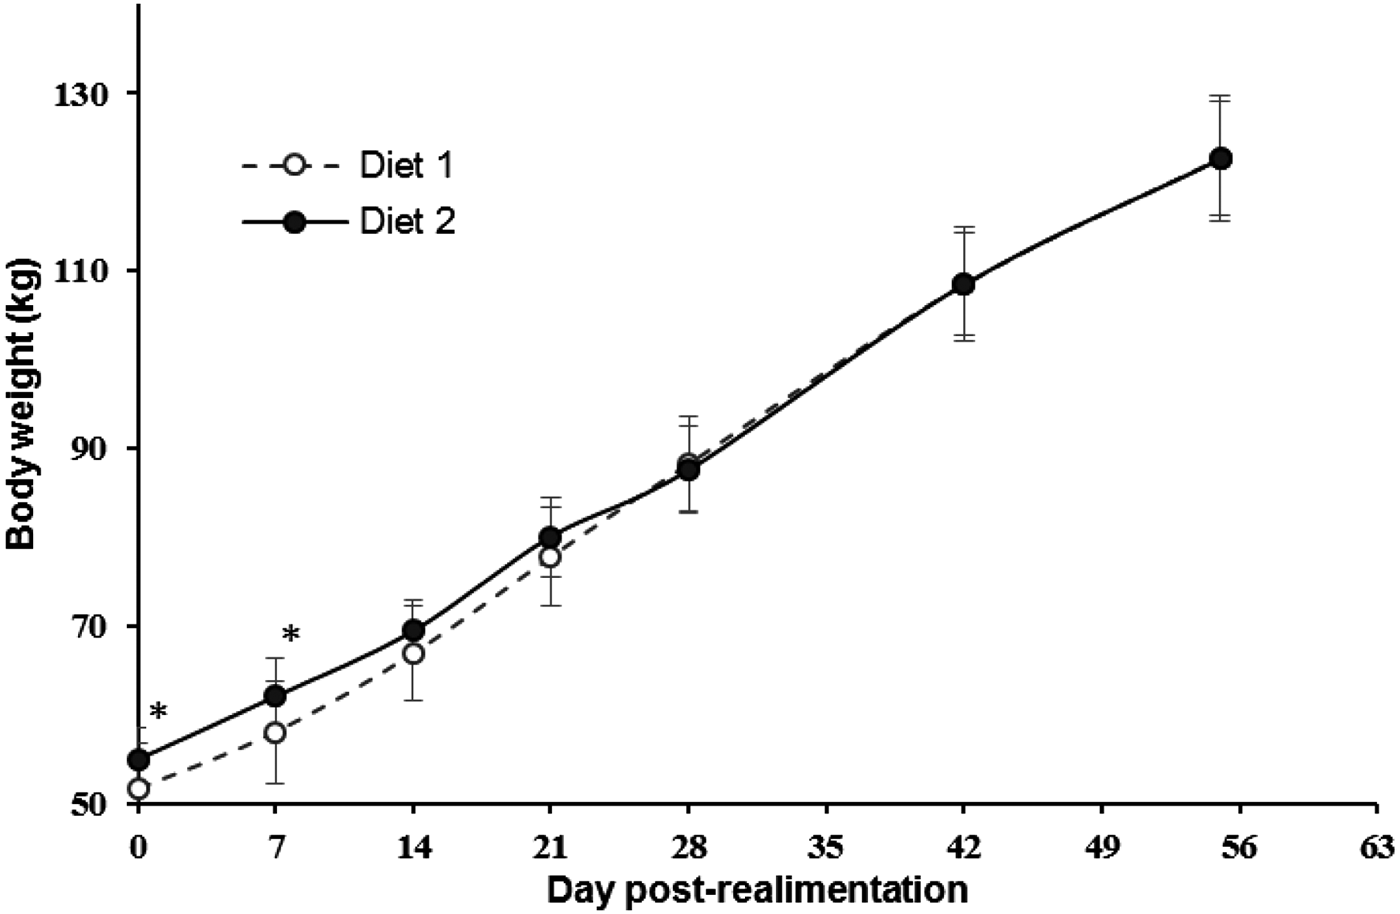
After the 31-day Met restriction treatment that resulted in retarded growth in the Diet 1 group, all pigs were switched to a common commercial grower-finisher diet (Table 3). As seen in Figure 1, at the beginning of the normal feeding period, BW of Diet 1 pigs was lower than that of Diet 2 pigs (51.6 vs. 55.0 kg; P = 0.102). By the end of day 7 post normal feeding, the BW of Diet 1 pigs was still lower than Diet 2 pigs (58.1 vs. 62.1 kg; P = 0.090). However, by the end of day 14 post normal feeding, the BW of Diet 1 pigs was still lower, but not significantly, than that of Diet 2 pigs (67.0 vs. 69.5 kg; P = 0.214), which continued until the end of day 21 (77.8 vs. 80.1 kg; P = 0.323). There were no differences in the BW between the two groups of pigs by the end of day 28 (88.3 vs. 87.6; P = 0.769), day 42 (108.5 vs. 108.5; P = 1.000), and day 55 (122.7 vs. 122.6; P = 0.989). These results clearly indicated that the Diet 1 group exhibited compensatory gain.
The growth of the average body weight (kg) of the pigs during the 8 week growing-finishing phase. Pigs were fed Diet 1 or 2 for one month (31 days) immediately before. The data for Diet 1 were obtained from the pigs previously fed a methionine-deficient diet. The data for Diet 2 were obtained from the pigs previously fed a methionine-adequate diet. Each value represents a Mean ± Standard deviation (n = 10). The sign of * indicates a statistical difference (P ≤ 0.10).

A greater growth rate or compensatory gain of pigs following a period of feed restriction or a restriction of dietary nutrients or energy have been previously reported (Chiba, Reference Chiba1994; Bikker et al., Reference Bikker, Verstegen, Kemp and Bosch1996; Skiba, Reference Skiba2005; Heyer and Lebret, Reference Heyer and Lebret2007), and several studies specifically indicated that pigs subjected to early dietary AA restriction can exhibit compensatory growth (Kamalakar et al., Reference Kamalakar, Chiba, Divakala, Rodning, Welles, Bergen, Kerth, Kuhlers and Nadarajah2009; Brestenský et al., Reference Brestenský, Nitrayová, Patráš and Heger2014). Bikker et al. (Reference Bikker, Verstegen, Kemp and Bosch1996) observed compensatory growth in finishing gilts subjected to dietary energy restriction. Heyer and Lebret (Reference Heyer and Lebret2007) observed compensatory gain of pigs during the finishing phase following feed restriction (65% of the ad libitum feed intake) in the growing phase.
For AA restriction, the compensatory response has been observed in some studies but not in others (Martínez-Ramírez et al., Reference Martínez-Ramírez, Jeaurond and de Lange2008; Brestenský et al., Reference Brestenský, Nitrayová, Patráš and Heger2014). Thaler et al. (Reference Thaler, Libal and Wahlstrom1986) reported that weanling pigs, when subjected to dietary lysine restrictions, exhibited accelerated growth in the subsequent phase, which resulted in no difference in the overall performance. Fabian et al. (Reference Fabian, Chiba, Frobish, McElhenney, Kuhlers and Nadarajah2004) reported pigs subjected to AA or crude protein restriction during the growing phase exhibited compensatory gain in terms of growth performance (ADG and nitrogen retention) during the re-establishment of nutrient levels at the finishing phase. Furthermore, Kamalakar et al. (Reference Kamalakar, Chiba, Divakala, Rodning, Welles, Bergen, Kerth, Kuhlers and Nadarajah2009) reported that pigs subjected to 80% lysine-deficient diets might have shown compensatory gain in terms of BW gain during the last finishing phase, although this was not observed in pigs subjected to 60% lysine-deficient diets, indicating that the AA restrictions might have been too severe, lasted too long, or both. Brestenský et al. (Reference Brestenský, Nitrayová, Patráš and Heger2014) concluded that compensatory growth after early dietary AA restriction depended on the method, degree and duration of the restriction, as well as the duration of the subsequent re-alimentation.
In the literature, previous studies of pigs’ compensatory growth following AA restriction have been mainly based on lysine restriction or, more accurately, on crude protein or several AA restrictions. Some studies have been confounded with dietary energy restriction. Almost none of these studies were conducted using a dietary restriction of only a single AA. This present study was conducted on single Met restriction. The Diet 1 pigs were fed a Met restricted diet for 31 days and then experienced an accelerated growth rate during the first two or three weeks of re-alimentation. After four weeks, the average BW of the Diet 1 and 2 pigs were basically the same. Skiba (Reference Skiba2005) stated that the faster growth rate usually does not last throughout the re-alimentation period, but it is significantly exhibited throughout the first four to six weeks after the change in diet. The results of this study agreed with this statement, as did the results of Fabian et al. (Reference Fabian, Chiba, Frobish, McElhenney, Kuhlers and Nadarajah2004).
Carcass characteristics
Statistical analysis showed there were no block effect (for the two slaughter dates) and no block × diet interactions, so carcass data have only been presented for the main effect of diet (Table 5). There were no differences between Groups 1 and 2 pigs in live weight (126.4 vs. 126.2 kg, P = 0.904), hot carcass weight (94.7 vs. 94.7 kg, P = 1.000), or chilled carcass weight (92.1 vs. 91.3 kg, P = 0.472). These similarities resulted in similar dressing percentages (74.9 vs. 75.0%, P = 0.875) between the two treatment groups. There were no differences in carcass length (83.6 vs. 85.3 cm, P = 0.154) or average back fat thickness (3.18 vs 2.89 cm, P = 0.133), or in the loin characteristics, as seen in weight (16.3 vs. 16.2 kg, P = 0.920), eye area (38.4 vs. 38.1 cm2, P = 0.890), pH (5.5 vs. 5.5, P = 0.980), marbling score (2.3 vs. 2.1, P = 0.224) or colour score (2.7 vs. 2.8 kg, P = 0.700). Ham fat thickness (2.06 vs. 1.85 cm, P = 0.369), Boston shoulder weight (7.14 vs. 7.18 kg, P = 0.898), and rib weight (3.24 vs. 3.26 kg, P = 0.832) was also unaffected by the pre-Met restriction.
The carcass characteristics of the 2 groups of pigs harvested on Day 55 or 62 post-realimentation1

1 Group 1 = a methionine-deficient diet was previously fed; Group 2 = a methionine-adequate diet was previously fed.
2 The average back-fat thickness was evaluated by averaging 3 measurements at the first rib, the last rib, and the last lumbar vertebra.
a,b Means within a row that have different superscripts differ (P ≤ 0.10).
There were several characteristics differences observed between Group 1 and Group 2 pigs (Table 5). Group 1 pigs had thicker back fat at the 10th rib (2.95 vs. 2.51 cm, P = 0.015) and a heavier belly weight (11.0 vs. 9.6 kg, P = 0.005) than Group 2 pigs. Group 1 pigs had lighter picnic shoulder weight (8.72 vs. 9.80 kg, P = 0.041), lighter untrimmed ham weight (20.8 vs. 21.6 kg, P = 0.043), and lighter trimmed ham weight (19.6 vs. 20.6 kg, P = 0.016) than Group 2 pigs. Overall, Group 1 pigs had less total lean cut weight (51.8 vs. 53.8 kg, P = 0.055), and lower lean cut percentage (56.4 vs. 59.0%, P = 0.012).
These data indicated that although a period of normal feeding after a Met restricted phase allowed Group 1 pigs to reach the same BW as Group 2 pigs, the former experienced a 2.6% decrease in total lean cut percentage and had more fat tissue than Group 2 pigs. The carcasses of Group 1 pigs would be graded lower because the 10th rib back-fat was thicker. This suggested that the growth retardation of Group 1 pigs had a negative, lasting effect on lean gain.
There are inconsistent results reported in the literature regarding the carcass characteristics affected by the dietary restriction and re-alimentation regimen. Converse to the results obtained in this study, Chiba (Reference Chiba1994) reported that growing pigs can be offered some diets marginally deficient in AA without adversely affecting the overall growth performance and carcass characteristics at the end of finisher phase. Kamalakar et al. (Reference Kamalakar, Chiba, Divakala, Rodning, Welles, Bergen, Kerth, Kuhlers and Nadarajah2009) recorded compensatory gain of finishing pigs in BW, but not in lean accretion. It was postulated that the increase in growth rate after previous AA restriction was influenced mostly by protein deposition due to the increased efficiency in protein accretion (Skiba, Reference Skiba2005).
On the other hand, although Bikker et al. (Reference Bikker, Verstegen, Kemp and Bosch1996) reported that the compensation in protein retention was likely to occur in the internal organs after feed restriction in the growing phase, the results of this study were supported by Heyer and Lebret (Reference Heyer and Lebret2007), who reported greater adipose than lean tissue deposition in finishing pigs that experienced feed restriction during the growing phase and then experienced nutrient re-establishment during the finishing phase. Chiba et al. (Reference Chiba, Ivey, Cummins and Gamble1999) also reported that the leanness of finished pigs might have been improved by the dietary AA restrictions in the growing phase.
Besides serving as a building block for protein synthesis, Met is the initial AA that binds specifically to the start codon on universal mRNA for protein synthesis. If an animal receives inadequate amount of dietary Met, protein synthesis can be inhibited. The other excess AA would be converted to acetyl CoA and stored as fat, instead of being used for building muscle mass. During re-alimentation, even though the level of dietary Met was recovered, the mechanism of fat accretion was probably not recovered to the normal level. This hypothesis may explain why pigs with compensatory growth had more adipose and less lean body mass relative to the control pigs fed adequate Met throughout the growing period.
For swine producers, the implications of this study vary depending on how pigs will be marketed. If the pigs are going to be sold on a live weight basis, producers may be able to take advantage of compensatory gain and reduce feed cost by limiting one or two expensive nutrients (such as dietary protein or Met) at an early stage of the growing phase. However, if they are sold on a carcass merit basis, producers may lose profit due to the reduced lean yield of carcasses. In practice, producers should evaluate the saving on feed cost against the possible loss of profit caused by reduced lean yield before attempting to benefit from physiological mechanisms of compensatory gain.
Conclusions
A Met-deficient diet can lead to a growth retardation in terms of BW gain in young growing pigs, and these animals can experience compensatory gain after nutrient re-alimentation at the finishing phase. However, when harvesting at market weight, the once growth retarded pigs would have more fat and less lean body mass compared with their adequately-fed counterparts. Whether or not a swine producer should take advantage of compensatory gain is dependent on the market incentive to produce less lean pigs, as well as on their marketing scheme. Producers should evaluate the saving on the feed cost during nutrient restriction against the possible loss of profit at marketing if the pigs are sold on carcass merits.
Acknowledgements
Authors wish to thank Mr. William White (farm manager, Leveck Animal Research Center, Mississippi State University) and his colleagues for their excellent support in facility and animal management. Authors are also indebted to Mr. Tim Armstrong and Mr. James Cannon at the Mississippi State University Meat Science and Muscle Biology Laboratory for pig slaughter and carcass evaluation. This research was supported in part by USDA-NIFA Hatch/Multistate Project 1007691 and the CALS/MAFES 2016 and 2017 Undergraduate Research Scholars Program.
Declaration of interest
None.