Introduction
Food availability is a key limitation for animal population size (Lack Reference Lack1954, Martin Reference Martin1987, Arcese and Smith Reference Arcese and Smith1988), and can influence territory size (Arvidsson et al. Reference Arvidsson, Askenmo and Neergaard1997), laying date and reproductive success (Arcese and Smith Reference Arcese and Smith1988). Many endangered or declining populations are food-limited as a result of habitat degradation or other anthropogenic activities such as pesticide use (e.g. Boatman et al. Reference Boatman, Brickle and Hart2004, Hart et al. Reference Hart, Milsom and Fisher2006). Efforts to increase food availability can improve breeding success, whether through the provision of foraging habitat at a broad scale (Baker et al. Reference Baker, Freeman and Grice2012, Bright et al. Reference Bright, Morris and Field2015), or through supplementary feeding (Castro et al. Reference Castro, Brunton and Mason2003, Schoech et al. Reference Schoech, Bridge and Boughton2007).
Direct supplementation, the provision of food (i.e. seed provided anthropogenically rather than on a growing plant), is a straightforward management intervention and, where food is limiting, generally has rapid, positive effects on breeding success (Castro et al. Reference Castro, Brunton and Mason2003, Schoech et al. Reference Schoech, Bridge and Boughton2007, Ruffino et al. Reference Ruffino, Salo and Koivisto2014). However, supplementary feeding may also have unexpected detrimental side-effects (e.g. Blanco et al. Reference Blanco, Lemus and García-Montijano2011) and, in some species, may even reduce productivity (Harrison et al. Reference Harrison, Smith and Martin2010, Plummer et al. Reference Plummer, Bearhop and Leech2013). Consequently, food supplementation for conservation management tends to be recommended as a short-term solution where, for example, a prey population is recovering from a population crash (López-Bao et al. Reference López-Bao, Rodríguez and Palomares2008), although for some translocated or heavily managed populations, long-term supplementary food provision may be necessary (Castro et al. Reference Castro, Brunton and Mason2003). Additional, undesired side-effects can include the concentration of predators, or increased transmission of pathogens and parasites (Schoech et al. Reference Schoech, Bridge and Boughton2007, Tollington et al. Reference Tollington, Greenwood and Jones2015), which can undermine the positive effects of food supplementation (Blanco et al. Reference Blanco, Lemus and García-Montijano2011).
Longer-term solutions to food shortage over a wider scale can be implemented through land management schemes, which can positively impact populations of widespread declining birds (Bright et al. Reference Bright, Morris and Field2015). Within farmland habitats, agri-environment schemes (AES) provide payments (based on the profit-forgone plus the costs of management) to farmers who modify their cropping and/or provide non-cropped habitat through various options designed to provide either nesting or seed/insect-rich foraging habitats for birds. In England, there is strong evidence for positive effects of management that provides seed food resources (e.g. stubble and wild bird seed mixes) on population growth rates across multiple granivorous species, at different landscape scales (Baker et al. Reference Baker, Freeman and Grice2012).
The European Turtle Dove (hereafter Turtle Dove) is one of Europe’s fastest declining breeding birds (-80% since 1980; PECBMS 2019). Within the UK, population declines have been linked to a reduced reproductive effort and a curtailing of the breeding season (Browne and Aebischer Reference Browne and Aebischer2004), occurring concurrently with a dietary switch from broad-leaved arable plants to mainly cultivated crops (Browne and Aebischer Reference Browne and Aebischer2003). Turtle Doves are obligate granivores, favouring weedy areas of sparse vegetation cover as foraging habitat and the reduction in such areas, along with a decline in previously widespread arable plants such as common fumitory Fumaria officinalis (Potts et al. Reference Potts, Ewald and Aebischer2010), suggests that food may now be limiting for this species. This is supported by our recent findings of a novel use of anthropogenic food likely provided by householders for garden birds in Turtle Dove diet (Dunn et al. Reference Dunn, Stockdale and Moorhouse-Gann2018). The continued population decline and evaluation of AES in the UK suggests current interventions may not be providing sufficient suitable foraging habitat, in terms of either food abundance or accessibility, to support the Turtle Dove population (Dunn and Morris Reference Dunn and Morris2012). Recent findings show positive effects of seed-rich habitat on post-fledging survival in this species (Dunn et al. Reference Dunn, Morris and Grice2017) but the high prevalence of the protozoan parasite Trichomonas gallinae, which has been linked to mortality in both adult and nestling Turtle Doves (Stockdale et al. Reference Stockdale, Dunn and Goodman2015), in ex-situ seed piles (Thomas Reference Thomas2017) and other columbids (Lennon et al. Reference Lennon, Dunn and Stockdale2013) made the standard methods of supplementary seed provision available at the time of this study (e.g. through options in the English Environmental Stewardship AES; Natural England 2012a, 2012b) unsuitable for Turtle Doves, even as a short-term solution. Consequently, we developed a conservation intervention designed to provide an in-situ source of seed food for Turtle Doves throughout the breeding season (Dunn et al. Reference Dunn, Morris and Grice2015). Here, we determine whether our intervention positively impacts Turtle Dove reproduction or breeding density.
First, we test whether our intervention influences the abundance of territorial male Turtle Doves at the farm scale over a five-year period. Second, for our intervention together with a suite of potentially beneficial AES options, we test whether the provision of seed-rich habitat influences the ranging behaviour or reproductive success of Turtle Doves on farmland.
Methods
Study sites and the provision of seed-rich intervention plots
Data collection was conducted at 12 sites per year spread across Essex, Suffolk, Cambridgeshire, and Norfolk in the east of England. Sites were selected during summer 2010 on the basis of the presence of at least two territorial Turtle Doves within a 1-km square dominated by arable farmland, with no more than 5% of the land area across the whole farm (not just the focal 1-km square) comprising seed-rich, non-cropped habitats such as fallow or wild bird seed mixes. This was to increase the likelihood that any effect of seed-rich habitat was due to intervention plots rather than pre-existing habitats. During 2011 and 2012, six intervention sites were established, each sown with 4–7 plots totalling 2 ha of a seed-rich mix (‘intervention plots’) designed to provide a source of seeds present in Turtle Dove diet, throughout the breeding season (Table S1 in the online supplementary material); the remaining six sites received no intervention management and served as control sites (Dunn et al. Reference Dunn, Morris and Grice2015). During 2013–2014, a modified seed mix, changed to improve vegetation structure and seed accessibility (Table S1), was sown at four of the existing intervention sites. Five new control and two new intervention sites were recruited using the same criteria as previously because Turtle Doves had become either scarce or absent at the original sites (Table S2).
Site status initially reflected the presence or absence of intervention plots (‘desired status’). However, vegetation structure on some sown plots was too tall and dense to allow access to foraging doves (Dunn et al. Reference Dunn, Morris and Grice2015), and one control site from 2011–2012 was found to have a sown strip of common fumitory in 2014, thus providing the vegetation structure and seed availability for which intervention plots had been designed. We therefore defined a second site status variable (‘actual’), which described the presence or absence of accessible sown intervention plots (including fumitory) for Turtle Doves (summarised in Table S2).
Surveys of territorial males
Field surveys aimed to detect the presence and abundance of singing male Turtle Doves at each site, where the site consisted of the entire farm rather than just the focal 1-km square (Mean ± 1 SE site area: 1.72 ± 0.31 km2). Each active intervention and control site was surveyed twice during each year of the study (2011–2014), once early in the breeding season (between mid-May and the end of the first week in June), and once later (mid–late June) to detect late-settling males. Field surveys followed the method of Dunn and Morris (Reference Dunn and Morris2012) and involved the observer walking two parallel 1-km transects recording all Turtle Doves. Transects began at sunrise and lasted a maximum of two hours as Turtle Dove vocal activity falls markedly thereafter (Calladine et al. Reference Calladine, Buner and Aebischer1999).
Turtle Dove capture and radio-tagging
Turtle Dove capture was attempted at all sites using mist nets and whoosh nets (Redfern and Clark Reference Redfern and Clark2001) at locations temporarily baited with wheat, oil seed rape or a commercial bird mix (details in Stockdale et al. Reference Stockdale, Dunn and Goodman2015). We caught birds in Essex and Norfolk only: 15 birds at five sites during 2011–2012, and 38 birds at seven sites during 2013–2014. Once caught, birds were sexed where possible according to plumage colouration and aged as either adult (hatched the previous year or before) or juvenile (Baker Reference Baker1993). Adults were fitted with a 1.7 g PicoPip radio-tag (Biotrack, Dorset, UK) glued to the central tail feathers and secured with dental floss. Tags had a line-of-sight range of up to 6 km and a ground-ground range of up to 600 m.
Following release, each bird was relocated as soon as possible in order to determine whether it was nesting. Subsequently, to minimise spatial correlation between consecutive tracking fixes, we divided the day into six 3-hour periods (between 04h00 and 22h00) and within each 5-day period we attempted to relocate each bird on at least one occasion during each 3-hour period (Browne and Aebischer Reference Browne and Aebischer2003). We obtained fixes by taking 3–5 bearings and calculating the central point of the overlap zone. To obtain each fix, we started searching for the bird in the vicinity of the nest site using a car-mounted aerial and then within concentric buffer zones around the nest up to 5 km from the nest. We excluded from the analysis any fixes for which points did not converge, or for which the observer was more than 1 km from the predicted location of the bird.
Nest location and breeding parameters
Turtle Dove nests were found by monitoring the movements of tagged birds as well as cold-searching habitat known to contain territorial males. Once found, nests were checked every 2–3 days, recording numbers of eggs or live chicks present and estimating chick age from plumage. Nest success was inferred from an empty and undamaged nest where the young were old enough to have fledged since the previous visit, or the presence of recently fledged young nearby. Nest failure was either known (nest contained cold eggs, egg fragments or dead chicks) or was inferred from an empty nest on a date prior to a plausible fledging date, often with chick remains visible near or underneath the nest. For analytical purposes, the date of failure was assumed to be the mid-point between the last two visits. First egg date (FED; a day-specific integer where 1 = 1 May) was deduced from incomplete clutches, known hatch dates and estimated chick ages. Nest habitat was categorised as within either a linear feature (hedgerow) or a non-linear habitat patch (scrub), and height of the nest platform above ground was measured (± 5 cm). Nest vegetation cover was measured using an upwards-facing fish-eye lens camera within three days of a nesting attempt ending. Images were subsequently analysed using Gap Light Analyser (Frazer et al. Reference Frazer, Canham and Lertzman1999) to derive the percentage of sky visible in the image. When nestlings were seven days old, they were weighed using a digital balance (± 0.1 g) and their tarsus measured using Vernier callipers (minimum tarsus ± 0.1 mm; Redfern and Clark Reference Redfern and Clark2001). Ideally, we would have measured the number of breeding attempts per pair per season as we expected to catch birds at the earliest stages of nesting; however, some birds were found to be at late stages of nesting when relocated shortly after radio-tagging relatively early in the season, and thus we could not be certain of including nesting attempts that may have occurred prior to radio-tags being fitted to estimate season-long productivity.
Home range
Radio-tracking fixes further than 50 m of the nest, which we assumed were likely to be foraging locations, were used to estimate adult home ranges for the incubation and chick stages separately. Minimum convex polygons (MCPs) were calculated for each adult nesting attempt stage with more than five qualifying locations (mean ± SE fix number: 10.82 ± 0.63; incubation stage: 31 nests from 22 birds; chick stage: 21 nests from 18 birds). We used 90% MCPs to define the core foraging range of each bird because including all fixes considerably inflated MCPs (mean ± SE home range at each % MCP (ha): 100%: 186.58 ± 32.00; 90%: 86.09 ± 16.38; 80%: 56.37 ± 13.79; 70%: 36.57 ± 11.54).
Measuring habitat availability
We quantified habitat availability within each home range as potential predictors of breeding performance. During 2013 and 2014, we mapped field-scale habitat within 3 km of each Turtle Dove nest, as well as around any more distant foraging areas located through radio-tracking. These data were digitised using ArcMap 10.1 and the habitat within each 90% MCP calculated using the ‘gIntersection’ command in the rgeos package (Bivand et al. Reference Bivand, Rundel and Pebesma2014). All statistical analyses were carried out in R version “Pumpkin helmet” for Mac (R Core Team 2016). Within each 90% MCP we calculated the proportions of cereal and oilseed rape, along with the ratio of grass to arable land. Using Rural Land Registry data, we also calculated the proportion of non-farmed land within each MCP. Non-farmed habitat lies outside land upon which Basic Payment Scheme (BPS) payments are claimed and in our study areas comprised areas of mainly woodland and scrub, quarries, amenity land and “seed rich” habitats such as fallow, semi-natural grassland and low intensity horse pastures (any standing water or urban areas were excluded from the area of non-farmed habitat; Table 1). We calculated the distance of each nest to the nearest intervention plot providing accessible habitat, the nearest semi-permanent standing water source (known to influence territory retention; Dunn and Morris Reference Dunn and Morris2012) and the nearest inhabited building (as a surrogate for the availability of provisioned food such as bird seed mix in gardens) (± 5 m) using digitised 1: 10,000 GB Ordnance Survey maps. Data on the extent of AES options likely to provide suitable foraging habitat for Turtle Doves were provided by Natural England. Option areas were weighted by the expected seed abundance and accessibility to foraging doves to calculate an index of available seed-rich habitat within farmed areas (or ‘seed index’; Table S3).
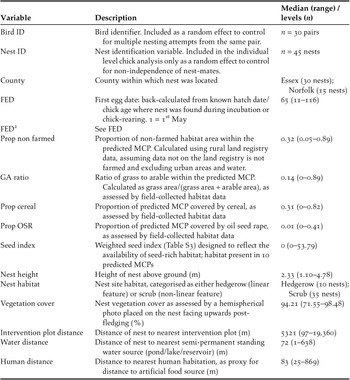
Terms examined as potentially influencing turtle dove home range size. Terms included in a multivariate analysis examining factors influencing home range size, following univariate analyses (which included Fix Number a priori), have their variable names italicised.

* denotes habitat terms excluded from the predictive model.
Changes in Turtle Dove abundance
To determine whether changes in the abundance of territorial Turtle Doves differed between intervention and control sites, we fitted a Poisson general linear model with the maximum number of territories recorded at each site in each year as the response variable. Site, year (as a continuous variable) and site status (intervention/control) were included as fixed factors along with the proportion of the total area surveyed which consisted of scrub. The latter controlled for the strong influence of scrub area (as a nesting habitat) on the likelihood of territory retention between years (Dunn and Morris Reference Dunn and Morris2012). As we were interested in whether site status affected temporal changes in the abundance of territorial doves, we included an interaction between year and status. We analysed both the desired and the actual intervention/control status of study sites (see above; Table S2).
Model selection
In order to identify factors affecting MCP area and breeding success, generalised linear mixed models (GLMMs) were initially used to screen potential predictor variables (Tables 1 and 3) one at a time against the null model containing random effects only. Variables found to be potentially influential (at P < 0.1) were tested for multicollinearity, which was found to be weak (r < 0.5 in all cases). All potentially influential terms were then included in a global multivariate model, on which we used the ‘dredge’ term in the MuMIn library (Barton Reference Barton2012) to rank all possible model combinations using Akaike’s Information Criteria (AICc) (Burnham and Anderson Reference Burnham and Anderson2002). Where no single model fitted the data better than any other model (i.e. with no models where ΔAIC was less than 2), we used model averaging on the set of most plausible models (i.e. all with ΔAIC less than 2) to estimate effect sizes (Burnham and Anderson Reference Burnham and Anderson2002). We interpreted a variable as significantly influencing the response variable where 95% confidence intervals from the averaged model did not overlap zero.
Minimal model used to predict home range size for all nests.

* comparison of the model with and without this term supported its inclusion in the final model (L. ratio1 = 2.84, P =.09)
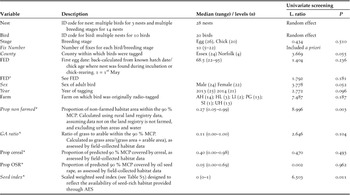
Terms examined as potentially influencing turtle dove nest survival or nestling biometrics. Median, range (for continuous variables) and levels (for factors) are provided for the whole dataset (each model utilises a subset of the whole dataset). Results of univariate screening for each model are provided in Table 6.

Factors affecting home range size
Our aim was to identify any habitat components that affected home range size. As sampling effort (fix number) commonly influences home range size (e.g. Girard et al. Reference Girard, Ouellet and Courtois2002), we used a linear mixed-effects model (LMM) (with Gaussian error structure) to describe the form of the relationship between the 90% MCP area (log transformed) and fix number. There was a significant positive linear relationship but no evidence of any non-linearity (quadratic and cubic terms were both non-significant; P > 0.1). We therefore screened a set of potential predictors of 90% MCP (described in Table 1) using a null linear mixed-effects model containing nested random terms of nest within bird to account for the non-independence of home ranges of paired doves and of multiple nesting attempts of individual birds, plus fix number as a linear fixed term. As the analysis included home ranges derived solely from incubation stage fixes (n = 31), and solely from chick stage fixes (n = 21), we included a two-level nest stage factor to test for any differences and included nested random effects as above. We included two-way interactions between adult sex and FED in multivariate analyses, to test for sex-specific seasonal changes in ranging behaviour.
Prediction of home range size
Tracking data were available for 36 out of 45 nests, from 23 birds. We therefore used a simplified version of the home range LMM (above, but excluding habitat variables as described in the legend to Table 1) to predict 90% MCPs for those nests without tracking data. Assuming a circular home range shape allowed us to derive habitat composition measures from the predicted home range for all nests (with and without tracking data), which could then contribute to analyses of breeding parameters. Terms potentially influential (P < 0.1) in univariate analyses (Fix number, County, Year and Sex; Table 1) were included in a multivariate global model. This was simplified using backwards stepwise deletion removing any terms that failed to achieve a conservative significance threshold (P < 0.1; Table 2). This model had reasonable predictive power (observed vs. predicted MCP: r = 0.788, P < 0.001). As the relationship between 90% MCP and fix number showed no clear asymptote, we used the 95th percentile of the available fix number (n = 17) to predict 90% MCPs. Female 90% MCPs were 11% larger than those of males (predicted values from the final model of 3.89 ± 0.29 ha for females and 3.49 ± 0.31 ha for males; Table 2), so we predicted areas of the former in order to ensure the inclusion of all potentially important foraging areas. We used these predicted home ranges to define habitat composition around all nests regardless of whether we had actual home range data.
Compositional analysis of foraging habitat selection
To examine foraging habitat preferences of Turtle Doves, we compared usage and availability of intervention plots and other available habitats. AES option availability (for those options included in our seed index; Table S3) was categorised at the field scale according to the presence or absence of AES options within the field, and then further categorised by the crop type within the field. We did this because the exact location of strip options within fields was unknown, and some options (e.g. cultivated fallow, low input spring cereal) are applied at the field scale. The following seven habitat categories were distinguished in the analysis: intervention plots in fields of any crop type (TP); AES in or adjacent to cereal fields (Cereal AES); AES in or adjacent to grassland or other crop fields (Grassland/other crop AES); cereal fields with no AES options (Cereal non-AES); grass fields with no AES options, mostly lightly grazed and ungrazed meadows (Grassland non-AES); other crop fields such as OSR or break crops with no AES options (Other crop non-AES) and apparently unfarmed areas such as amenity land and quarries with no AES options (Non-cultivated non-AES). To calculate foraging habitat, we took the approach described by Dunn et al. (Reference Dunn, Morris and Grice2017): briefly, we assumed that each radio-tracking fix of a bird more than 50 m from its nest site was a foraging location and assumed each fix (n = 529 foraging locations from 28 birds) to have an accuracy of ± 50 m based on re-sightings and calibrations from nest locations. We calculated the composition of utilised habitat for each bird from a 50 m radius around each foraging location, and the composition of available habitat from a 3-km radius around each nest site (to encompass the mean maximum foraging distance of 2762 m), using the ‘gIntersection’ command in the rgeos package (Bivand et al. Reference Bivand, Rundel and Pebesma2014).
We using the ‘compana’ function in the adehabitatHS package (Calenge Reference Calenge2006) to perform a compositional analysis of habitat use (Aebischer et al. Reference Aebischer, Robertson and Kenward1993). Habitat categories for each bird were expressed as a proportion of the total available or used area, and we then replaced all zero values with 0.0001 because zero values can bias the test as log-ratio differences cannot be computed. We repeated our analysis with additional arbitrary non-zero values (0.001 and 0.00001) because the value selected can potentially influence results. First, we tested whether habitat selection was significant using a Wilk’s lambda test, subsequently ranking habitats independently of availability according to the number of differences between each pair of habitat types.
Factors affecting nesting success and nestling biometrics
We tested for any influence of a set of candidate predictors of nesting success and chick biometrics from 45 Turtle Dove nests monitored during 2013 and 2014 (see Table 3). To determine whether nesting success was influenced by habitat composition within the predicted circular 90% MCPs or by the availability of seed-rich habitat, we examined daily nest survival (at the egg and chick stages separately), individual chick survival and the number of fledglings per nesting attempt. We were unable to monitor the nesting activity of enough breeding pairs through the breeding season to estimate the number of breeding attempts per pair per year with confidence. All models contained a pair identifier as a random effect to control for multiple nesting attempts; the individual chick survival model also contained a nest identifier as a random term to control for non-independence of sibling outcomes. GLMMs were used to analyse nest and chick survival, in which the response variable was nest outcome or chick mortality (0 = survived, 1 = failed), with the number of exposure days during the relevant nest stage declared as a binomial denominator (Aebischer Reference Aebischer1999, Hazler Reference Hazler2004). For the fledgling GLMM we used the number of fledglings (0–2) within a Poisson error structure.
To test whether nestling mass or condition were affected by home range habitat composition or the availability of seed-rich habitat we constructed two LMMs with Gaussian error structure, designating pair and nest identity as random effects to allow for non-independence of nestlings from the same nest and multiple nests from the same pair. We used residuals from a linear regression of body mass against tarsus length at 7 days old as an index of condition (Labocha and Hayes Reference Labocha2012).
Results
Territory density
The presence of intervention plots on sites (‘desired’ status) had no influence on the change in Turtle Dove territory abundance over time (Year x desired status interaction: χ2 1=0.084, P = 0.77). However, when sites were classified according to the presence of successful intervention plots providing accessible food-rich habitat (‘actual’ status), those successful intervention sites lost territorial Turtle Doves at a marginally slower rate than sites lacking such successful intervention (Year x actual status interaction: χ2 1=3.202, P = 0.074). Sites where accessible seed-rich habitat was successfully provided lost on average 67% of their Turtle Dove territories between 2010 and 2014 compared to a 95% loss on control sites and those with unsuccessful intervention plots (Figure 1).
Variation in territory density over time across actual status of study sites with (“trial”) or without (“control”) suitable turtle dove foraging habitat. Sites in 2010 had no intervention but are split into sites forming intervention and control sites during subsequent years for illustration. Bars show raw data ± 1 SE; numbers in or above bars denote sample size of sites.

Factors affecting home range size
Home range size increased linearly with the number of available fixes (Table 4) and decreased with an increasing proportion of non-farmed habitat in the home range (Table 4; Figure 2a). The presence of seed-rich habitat was linearly associated with larger home ranges (Table 4; Figure 2b; quadratic term was non-significant in univariate screening: Likelihood ratio test = 1.69, P = 0.19).

Model averaged results from an LMM analysing terms influencing home range size. Estimates and 95% CIs are model averaged coefficients, and CIs not overlapping zero (bold) are taken to indicate statistical significance.

Foraging habitat selection
Turtle Doves showed significantly non-random selection of foraging habitat types (Wilk’s λ = 0.16, P = 0.001; Table 5; Figure 3), with non-AES grassland the strongest selected habitat, followed by fields containing intervention plots. AES arable and AES grassland/other crop were the least selected habitats (Table 5; Figure 3).
Mean ± 1 SE proportion of habitat selected by foraging turtle doves (n=30) compared to that available within 3km of their nest.

Ranking matrix comparing habitat use from foraging locations of breeding turtle doves with available habitat within 3km of the nest (n = 30); and b) Selection ratios and confidence intervals for each habitat type.

+ indicates a preference for the habitat in the row over the habitat in the column; a triple sign indicates a significant preference (P < 0.05). The highest numbered rank (i.e. 6) is the most preferred habitat.
TP: Intervention Plot; AES: Agri-Environment Scheme
Factors affecting nesting success and chick biometrics
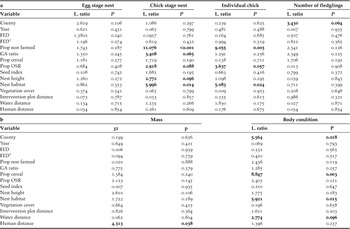
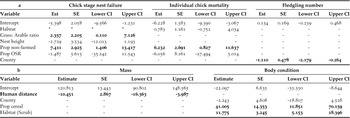
We found no terms influencing whole nest failure at the egg stage (Table 6a), but at the chick stage whole nest failure was higher where home ranges contained more non-farmed habitat (Figure 4a) and a higher ratio of grass to arable (Figure 4b; Table 7a). Individual chick mortality showed a relationship with non-farmed habitat in the same direction and of similar magnitude to that with whole nest failure (Figure 4a; Table 7a). The number of fledglings differed between counties (or clusters), with Essex nests producing more fledglings than nests in Norfolk (Essex: 1.17 ± 0.17; Norfolk: 0.38 ± 0.21 fledglings per nest).
Nest survival at the chick stage was highly correlated with a) the proportion of non-farmed habitat and b) the Grass: Arable ratio within the 90% MCP. Points show raw data; lines are predicted from the final averaged model (Table 7a) with mean scaled nest height (0.48).

Results of univariate screening for fixed effects potentially influencing a) nest or chick mortality, or b) nestling biometrics. Statistics in bold denote terms included in multivariate analyses. Statistics in italics denote terms excluded from the relevant analysis due to multicollinearity.

Results of multivariate analyses examining a) nest failure and chick mortality, and b) chick biometrics.

* term removed from multivariate analysis as its inclusion destabilised the model. Examination of raw data did not suggest an important effect of this variable.
Nestling mass at seven days decreased with increasing distance to human habitation (Table 7b; Figure 5). Nestling condition at seven days increased with the proportion of cereal in the home range (Table 6b) and was higher for chicks in scrub nests than for those in hedgerow nests (Figure 6).
Nestling mass at seven days decreased with increasing distance from human habitation. Points show raw data, line is predicted from the final averaged model (Table 7b) with a mean value for PCA1 (0); note log x-axis.

Nestling condition at seven days increased with an increasing proportion of cereal in the home range, and differed between nest habitats. Points show raw data; lines are predicted from the final averaged model (Table 7b) for nests in scrub (solid line) and nests in hedgerows (dotted line) in Norfolk.

Discussion
Conservation interventions that boost food availability have the potential to reverse population declines where food is limiting (e.g. Perkins et al. Reference Perkins, Maggs and Watson2011, Baker et al. Reference Baker, Freeman and Grice2012). For the rapidly declining Turtle Dove, changes in abundance of territorial males were marginally less negative on farms where we provided additional accessible seed-rich habitat, and fields containing intervention plots were selected by foraging Turtle Doves. However, neither the availability of seed-rich AES habitat nor the proximity of our intervention plots had any detectable influence on nesting success or nestling biometrics.
Whilst less negative abundance trends on farms with suitable foraging habitat suggest that intervention plots may locally beneficial, overall populations still declined on intervention farms. Turtle Dove population structure and settlement patterns are little studied, but in general, population densities of species tend to become lower closer to their range edge (e.g. Lawton Reference Lawton1993, Holt et al. Reference Holt, Keitt and Lewis2005). The UK Turtle Dove population has shown a marked range contraction towards south-east England (Gibbons et al. Reference Gibbons, Reid and Chapman1993, Balmer et al. Reference Balmer, Gillings and Caffrey2013) so our study sites are now nearing the edge of the European breeding range and it seems plausible that abundance may decline faster at range edges due to settlement patterns, rather than habitat effects. The slightly more positive abundance trend on intervention sites suggests a higher probability of settlement at the beginning of the breeding season probably mediated through enhanced habitat quality. Turtle Doves are not thought to be site faithful (Browne and Aebischer Reference Browne and Aebischer2001) and juveniles may not return to natal breeding areas but settle earlier on the migration route (e.g. Studds et al. Reference Studds, Kyser and Marra2008). A recent range-wide population genetic study of Turtle Dove (Calderón et al. Reference Calderón, Campagna and Wilke2016) found no evidence of genetic population structure across flyways, suggesting range-wide population admixture.
We could not directly test the effect of our intervention plots on ranging behaviour and reproductive parameters as Turtle Doves dispersed widely following radio-tagging. Only three of the 26 tagged birds for which we had habitat and nesting data had intervention plots within their predicted home ranges and the median distance of a nest to a plot was 5.3 km (range 0.1–19.4 km), although fields containing intervention plots were positively selected by foraging Turtle Doves where available. We therefore constructed a wider ‘seed index’ which included AES options with the potential to provide suitable seed-rich habitats, although we lacked the resources to undertake direct field assessments of whether these habitats actually provided abundant and accessible seed. However, we did not detect any associations between this predicted availability of seed-rich habitat, and any Turtle Dove reproductive metrics. Thus, our study provides no evidence of any demographic response to the likely availability of seed-rich habitats. The main caveat to this conclusion is that our measure of seed-rich habitat was assumed rather than measured.
The relationship between smaller home ranges and a high proportion of non-farmed habitat within MCPs suggests that unfarmed habitats may represent important foraging habitats allowing birds to occupy smaller home ranges. This is supported by our previous finding of the importance of these habitats for recently fledged Turtle Doves (Dunn et al. Reference Dunn, Morris and Grice2017). Furthermore, our compositional analysis of foraging habitats suggests that extensively managed grassland (non-AES grassland) and unfarmed habitats (non-cultivated non-AES) are selected by foraging Turtle Doves, while fields containing AES options were generally avoided. Further examination of our data indicated that the more utilised foraging habitats consisted of mainly lightly grazed (mostly horse) pastures, semi-natural grassland, amenity land and fallows. Whilst it was beyond the scope of this study to undertake detailed assessment of the habitats present on non-farmed or non-AES land, our observations suggest that many non-farmed habitat patches in our study areas provided more seeding plants, short swards and bare ground than surrounding farmland (Dunn et al. Reference Dunn, Morris and Grice2017). The tendency for relatively large home ranges to contain proportionately little unfarmed habitat, and a high proportion of seed-rich habitat, implies that doves occupying home ranges that lacked unfarmed habitats may have needed to travel further from their nests in order to forage in seed-rich habitats.
Despite the likely greater availability of food in non-farmed habitat, at the chick stage, nest failure was higher where more non-farmed habitat was present within predicted 90% MCPs, with 70% of nest failures at the chick stage (n = 10) due to predation. Higher nest failure rates were also associated with a higher ratio of grass to arable land, and gamekeeping in our study areas occurred largely or entirely on arable land. Observations of predators and the examination of depredated nests or nestling remains suggest that mammals were the main nest predators in our study areas (Dunn et al. Reference Dunn, Morris and Grice2017), and the negative impact on chick survival may negate positive impacts of increased food availability on reproductive metrics.
Where nests survived until chicks were seven days old, those nearer human habitation contained significantly heavier chicks. There has been an anecdotal increase in sightings of Turtle Doves foraging under garden bird feeders (BTO GBW, personal communication), supported by molecular analysis of Turtle Dove faecal samples finding a high proportion of Turtle Dove diets to contain sunflower Helianthus annuus, Sorghum sp., hemp Cannabis sativa and niger Guizotia abyssinica (Dunn et al. Reference Dunn, Stockdale and Moorhouse-Gann2018), all common components of garden bird seed. This finding suggests that Turtle Doves may be relying on supplementary food sources such as those provided in gardens in order for their chicks to reach adequate weight: elsewhere we show that heavier chicks at seven days old are more likely to survive for 30 days post-fledging (Dunn et al. Reference Dunn, Morris and Grice2017). Supplementary feeding is a widespread practice both in gardens (mainly aimed at passerines, Robb et al. Reference Robb, Mcdonald and Chamberlain2008), for gamebirds in wider farmland (Sánchez-Garcia et al. Reference Sánchez-Garcia, Buner and Aebischer2015) and when targeted for conservation objectives (Castro et al. Reference Castro, Brunton and Mason2003, Schoech et al. Reference Schoech, Bridge and Boughton2007, López-Bao et al. Reference López-Bao, Rodríguez and Palomares2008, Blanco et al. Reference Blanco, Lemus and García-Montijano2011). However, Turtle Doves have a high prevalence of the protozoan parasite Trichomonas gallinae (95%: Lennon et al. Reference Lennon, Dunn and Stockdale2013, Thomas Reference Thomas2017), which has been linked to mortality in both adults and nestlings within our study population (Stockdale et al. Reference Stockdale, Dunn and Goodman2015). The T. gallinae parasite is spread at shared water and food resources (Stabler Reference Stabler1954); in such instances, supplementary food sources in the form of unmanaged spills from garden bird feeders may be contraindicated as negative impacts may undermine any positive effects (Blanco et al. Reference Blanco, Lemus and García-Montijano2011). Recently, new ways of supplementary feeding Turtle Doves without increasing the prevalence of the T. gallinae parasite have been tested successfully and rolled out in the Countryside Stewardship AES or as a voluntary measure in England (UK Government 2020).
Nestling body condition was better where a higher proportion of the home range consisted of cereal crops. This contrasts with our previous finding that chicks with a high proportion of cereals in their diet were in poorer body condition (Dunn et al. Reference Dunn, Stockdale and Moorhouse-Gann2018). However, alternative sources of seed food may be available in some arable field margins especially those subject to restricted herbicide application (Vickery et al. Reference Vickery, Feber and Fuller2009), which, depending on vegetation structure, may be accessible to foraging Turtle Doves. Before the widespread use of herbicides on arable land, a large proportion of Turtle Dove diet was formed of arable plants such as common fumitory and common chickweed Stellaria media (Murton et al. Reference Murton, Westwood and Isaacson1964), both of which have declined strongly in cereal dominated landscapes over the past 40 years (Potts et al. Reference Potts, Ewald and Aebischer2010). We previously reported that Turtle Dove nestling condition was positively associated with the proportion of ‘natural’ (i.e. non-crop, non-supplementary food) items in their diet (Dunn et al. Reference Dunn, Stockdale and Moorhouse-Gann2018).
Conclusions
The abundance of territorial Turtle Doves declined more slowly on sites containing accessible seed-rich intervention plots. Due to the mobility of radio-tagged individuals, we could not directly test effects of our intervention plots on reproductive parameters and our wider seed index may have included areas unsuitable for foraging potentially masking any positive effects of seed-rich areas. Although foraging Turtle Doves selected fields containing intervention plots and may have expanded their home ranges to exploit seed-rich habitats, there was no evidence that the availability of potentially seed-rich habitats influenced breeding success or chick biometrics. Our study highlights the importance of non-farmed habitats (lightly grazed and semi-natural grassland, amenity land, fallows) for breeding Turtle Doves, these being selected by foraging doves and associated with smaller home ranges. However, nest failure rates (mainly linked to predation) were higher in home ranges containing more non-farmed habitats. Future research should focus on linking dietary components to potential habitat sources, and on linking reproductive performance to fine-scale habitat utilisation using recently developed high-resolution tagging technology (e.g. GPS tags). Optimising delivery of various sources of seed to ensure food is abundant, accessible, and does not increase parasite transmission, will be an important conservation challenge for this species. This should be delivered in a variety of ways (i.e. through supplementary feeding, bespoke sown mixtures and encouraging a diversity of natural plants to set seed through enhancement of existing seed rich, accessible habitats where these are known to already exist) to ensure that seed is available throughout the time that Turtle Doves are present on the breeding grounds, and that the birds have a varied diet. Placing these resources close to suitable nesting habitat and safe water sources will be of most benefit to allow both breeding adults and recently fledged juveniles to obtain all of their key requirements without flying long distances.
Supplementary Materials
To view supplementary material for this article, please visit http://dx.doi.org/10.1017/S0959270920000635.
Acknowledgements
This work was funded jointly by the RSPB and Natural England as part of the Action for Birds in England (AfBiE) partnership. Thanks to farmers and landowners in Essex, Suffolk, Norfolk, and Cambridgeshire who sowed intervention plots and allowed access to their land for monitoring nests and radio-tracking birds. Thanks to many staff and volunteers who assisted with radio-tracking and nest monitoring: Jacqui Weir, Kerry Skelhorn, Jenny Bright, Judit Mateos, Eliza Leat, Rebecca Thomas, Alexander Ball, Rebecca Melville, Vivien Hartwell, Joanne Stonehouse, Maureen Gibson, Holly Neville-Smith, Chris Pringle, Rebecca Andrews, Laura Wright, Emma Cutten, Louis O’Neill and Connie Miller. Countryside Stewardship and Environmental Stewardship Options data were provided from Natural England datasets (© Natural England copyright 2014). Thanks to two anonymous reviewers for their comments on an earlier version of the manuscript. Birds were caught and radio-tagged under licence from the British Trust for Ornithology, following approval from the Special Marks Technical Panel.