

1 Introduction
The large-scale flows of plasma in a tokamak are dominantly toroidal, and largely consist of solid body rotation of nested, topologically toroidal shells of plasma (flux surfaces) with a rotation rate dependent on the radial parameter
 $r$
that labels the flux surfaces. These flows are significant because they can substantially suppress turbulence by shearing it, and are a key means to access better confinement. A recent computational study, using global gyrokinetic simulations (McMillan Reference McMillan2015), suggested a possible explanation for the anomalously large flow shears seen in certain experimental tokamaks (Hillesheim et al.
Reference Hillesheim, Parra, Barnes, Crocker, Meyer, Peebles, Scannell and Thornton2015) despite the absence of a strong external forcing: the momentum diffusivity is essentially zero. In this regime, the local flow shear amplitudes increase up to a steady state saturated value, as part of the energy flow arising from temperature-gradient-driven instabilities is directed into increasing flow shear, forming banded spatial structures. The consequence on longer length scales is that flows are undamped until the average flow shear exceeds the saturation point.
Zero effective toroidal momentum diffusivity is closely related to the well-known self-organisation seen for poloidal zonal flows in tokamaks; toroidal flows are essentially undamped by collisions, however, so the consequences are quite different. This self-organisation can be seen as a form of spinoidal decomposition (Cahn Reference Cahn1961) that, in the context of zonal flows, leads to a phase separation of the fluid into bands of vorticity of opposite signs. This is compared to a system with diffusive momentum transport, where, in the absence of external forcing, little long-wavelength flow is expected. We therefore speak of a phase transition that occurs when the momentum diffusivity goes to zero, and flow structures are spontaneously generated. In the context of neutral fluids, the creation of large-scale flows due to temperature-gradient-driven instabilities, and inverse cascades, is universal in laboratory and natural systems (for example, Earth’s and Jupiter’s atmospheric motions (Rhines Reference Rhines1994)). In general some kind of symmetry breaking is required to allow turbulence driven by temperature-gradient instabilities to generate mean flows, and for tokamak turbulence this can be formulated in terms of the symmetry of the local gyrokinetic equations (Parra, Barnes & Peeters Reference Parra, Barnes and Peeters2011): for non-rotating, up–down symmetric tokamaks, and in the local limit, the ensemble-averaged radial momentum flux
 $\unicode[STIX]{x1D6E4}_{v}$
is zero. As in the Earth’s atmosphere, where overall planetary rotation imposes a particular rotation direction on the mid-latitude winds, overall rotation in a tokamak strongly breaks the symmetry. However, in an initially non-rotating tokamak discharge, more subtle effects due to finite size effects (Gürcan et al.
Reference Gürcan, Diamond, Hennequin, McDevitt, Garbet and Bourdelle2010; Parra & Catto Reference Parra and Catto2010; Idomura Reference Idomura2012) can still provide a weak overall torque, but these scale like
 $\unicode[STIX]{x1D70C}\ast$
, and thus are particularly weak in reactor-scale devices. This is in addition to the effect of up–down asymmetry, which, while formally ‘strong’, produces quite weak intrinsic torques (Camenen et al.
Reference Camenen, Peeters, Angioni, Casson, Hornsby, Snodin and Strintzi2009; Ball et al.
Reference Ball, Parra, Barnes, Dorland, Hammett, Rodrigues and Loureiro2014). The effect here, which may be seen as a form of spontaneous symmetry breaking, is strong enough to allow large rotation even for up–down symmetric equilibria. Although negative momentum diffusivity would not lead to a preferred rotation direction (which is forbidden by symmetry arguments (Parra et al.
Reference Parra, Barnes and Peeters2011)), it allows
 $\unicode[STIX]{x1D6E4}_{v}=0$
for large absolute values of toroidal rotation shear, in addition to the solution
 $\unicode[STIX]{x1D6E4}_{v}=0$
at zero rotation shear, which may be an unstable equilibrium.
In standard models of momentum transport, diffusive terms, which arise in the simplest models through passive advection of velocity, compete with antidiffusive terms associated with kinetic resonances and Reynolds stress, to balance external and intrinsic torques. In most previous works, the diffusive terms have been considered to dominate the antidiffusive terms so that net rotation is set by balancing flow damping due to the effective diffusivity against flow drive due to the total torque. Negligible momentum diffusivity is surprising in light of previous results (albeit in different regimes) that have found strong positive diffusivity (Kinsey, Waltz & Candy Reference Kinsey, Waltz and Candy2005; Strintzi, Peeters & Weiland Reference Strintzi, Peeters and Weiland2008; Casson et al.
Reference Casson, Peeters, Camenen, Hornsby, Snodin, Strintzi and Szepesi2009). We therefore performed an investigation of the parameter regime where near-zero long-wavelength diffusivity was reported in global simulations, using the local version of the GKW (Peeters et al.
Reference Peeters, Camenen, Casson, Hornsby, Snodin, Strintzi and Szepesi2009a
) gyrokinetic turbulence code. We replicate the simulation parameters of the previous global runs in local simulations and find there is indeed a transition from Prandtl number (ratio of thermal diffusivity
 $\unicode[STIX]{x1D712}_{E}$
to the momentum diffusivity) of order 1 at small field line pitch,
 $P\sim a/qR$
(with
 $a$
the distance from the magnetic axis,
 $R$
the major radius and
 $q$
the safety factor) to negligible Prandtl number as
 $P$
increases. The field line pitch gives the angle between the toroidal direction and the magnetic field lines, or, in other words, the size of the poloidal component of the magnetic field direction. When the field line pitch is large, not only does sheared toroidal rotation imply strong perpendicular flow shear, but sheared turbulence gives rise to strong toroidal Reynolds stresses. We also find that the effective momentum diffusivity decreases at low levels of heat flux.
2 A model for toroidal momentum transport
The dynamics of large-scale flows generated by turbulence may be understood as a combination of a passive process, where passive advection of momentum (which we represent in terms of the parallel velocity profile
 $v_{\Vert }$
) in the turbulence leads to a flow diffusion, and an active process, where the flows modify local turbulence properties, either enhancing or reducing the overall momentum transport. A key active process is the tilting of turbulence eddies by the sheared background flow; in the absence of tilting, temperature-gradient-driven instabilities lead to turbulence with phase fronts aligned in the radial direction
 $r$
but no average tilt in the toroidal direction
 $\unicode[STIX]{x1D701}$
, but the background shear flow gives rise to a non-zero average tilt. This may be quantified in terms of cross-moments of the plasma velocity
 $v$
such as
 $\langle v_{r}v_{\unicode[STIX]{x1D701}}\rangle$
, which is a component of the Reynolds stress (equivalently, one finds a peak in the power spectra at non-zero
 $k_{r}$
and
 $k_{\unicode[STIX]{x1D701}}$
).
Tilting gives rise to the universal fluid process of flow drive via the Reynolds stress. However, an additional tokamak-specific kinetic effect is usually considered to dominate. A mode tilted in the positive
 $\unicode[STIX]{x1D701}$
direction generally is not up–down symmetric along the field line, and this leads to a velocity-space asymmetry as a particle streaming in the positive parallel direction may interact more strongly with the wave field than one streaming in the negative direction (Dominguez & Staebler Reference Dominguez and Staebler1993); the result is in an overall momentum flux when integrated over velocity.
These active effects are typically antidiffusive. A simple model for the competition between diffusive and antidiffusive effects is that the momentum flux
 $\unicode[STIX]{x1D6E4}_{v}=-v_{\Vert }^{\prime }\unicode[STIX]{x1D712}_{E}+C\unicode[STIX]{x1D70E}\unicode[STIX]{x1D712}_{E}$
, where the first term models a diffusive effect which by itself would result in the thermal and momentum diffusivity being equal (Prandtl number of 1),
 $C$
is a parameter dependent coupling coefficient (with frequency units) and
 $\unicode[STIX]{x1D70E}\in [-1,1]$
represents the mean tilting of the mode structures in the presence of a sheared toroidal background flow. The usual way to solve this equation is to linearise the two terms on the right-hand side of this equation in
 $v_{\Vert }^{\prime }$
, and balance this effective momentum diffusivity against the external momentum input (minus residual stress or pinch terms): we will instead explain how non-trivial solutions
 $v_{\Vert }^{\prime }\neq 0$
can arise when there is no momentum input or residual stress, due to the components of the effective momentum diffusivity cancelling.
We define
 $\unicode[STIX]{x1D70E}=2\langle v_{r}v_{\unicode[STIX]{x1D701}}\rangle /\langle \boldsymbol{v}.\boldsymbol{v}\rangle$
, where the angle brackets represent an average over turbulent scales (later a more explicit average will be defined). Competition between mean tilting of eddies due to flow shear and isotropisation by turbulent interaction is represented by a model predicting this tilt,
 $$\begin{eqnarray}\unicode[STIX]{x1D70E}_{M}=\frac{\unicode[STIX]{x1D714}_{E\times B}}{(\unicode[STIX]{x1D714}_{E\times B}^{2}+1/\unicode[STIX]{x1D70F}_{\text{NL}}^{2})^{1/2}},\end{eqnarray}$$
where
 $\unicode[STIX]{x1D70F}_{\text{NL}}$
is a typical nonlinear time, and
 $\unicode[STIX]{x1D714}_{E\times B}$
is the perpendicular flow shearing rate due to the background field; this is inspired by relations found in earlier studies on zonal flow dynamics (we follow in particular the reasoning of § 8.2.2 in Connaughton, Nazarenko & Quinn Reference Connaughton, Nazarenko and Quinn2015). Qualitatively, this model predicts a turbulence tilt of order 1 for large enough shear flow amplitude, and a tilt approximately equal to the ratio between the shearing rate and the turbulence decorrelation time for small shear flow amplitude.
With the mixing length (or eddy viscosity (Boussinesq Reference Boussinesq1903)) estimate
 $\unicode[STIX]{x1D712}_{E}=1/\unicode[STIX]{x1D70F}_{\text{NL}}k_{\bot }^{2}$
, and toroidal rotation implying
 $\unicode[STIX]{x1D714}_{E\times B}=Pv_{\Vert }^{\prime }$
we find
 $$\begin{eqnarray}\unicode[STIX]{x1D6E4}_{v}=v_{\Vert }^{\prime }\unicode[STIX]{x1D712}_{E}\left[-1+\frac{CP}{(P^{2}v_{\Vert }^{\prime 2}+\unicode[STIX]{x1D712}_{E}^{2}k_{\bot }^{4})^{1/2}}\right],\end{eqnarray}$$
and the ‘effective momentum diffusivity’
 $\unicode[STIX]{x1D712}_{v}=\unicode[STIX]{x1D6E4}_{v}/v_{\Vert }^{\prime }$
, is then identified as the factor multiplying
 $v_{\Vert }^{\prime }$
. The word ‘effective’ signifies that the effect of self-consistent background electric field due to toroidal rotation has been accounted for correctly. The form of this term suggests a parameter regime of antidiffusive behaviour when both the thermal diffusivity,
 $\unicode[STIX]{x1D712}_{E}$
and
 $v_{\Vert }^{\prime }$
are simultaneously small, and for sufficiently large pitch angle
 $P$
. In other words, although the model predicts a Prandtl number
 $\unicode[STIX]{x1D712}_{v}/\unicode[STIX]{x1D712}_{E}$
of typical magnitude 1, as expected from dimensional considerations, the sign is parameter dependent. Since a negative Prandtl number suggests flows will spontaneously arise (McMillan Reference McMillan2015), we expect physically that mean flow shear levels
 $\langle {v_{\Vert }^{\prime }}^{2}\rangle$
will tend to increase until
 $\unicode[STIX]{x1D712}_{v}/\unicode[STIX]{x1D712}_{E}\sim 0$
.
In this model, the balance between diffusive and antidiffusive terms (so
 $\unicode[STIX]{x1D6E4}_{v}=0$
) occurs when either
 $v_{\Vert }^{\prime }=0$
or
 $v_{\Vert }^{\prime }=\pm (C^{2}-\unicode[STIX]{x1D712}_{E}^{2}k_{\bot }^{4}/P^{2})^{1/2}$
. Note that unlike in the usual model, in the antidiffusive regime the flux increases with
 $v_{\Vert }^{\prime }$
around
 $v_{\Vert }^{\prime }=0$
, so this is an unstable fixed point. Near the critical parameter regime, where the right-hand side of (2.2) is zero, and for small
 $v_{\Vert }^{\prime }$
, the momentum flux
 $\unicode[STIX]{x1D6E4}_{v}\propto v_{\Vert }^{\prime }(K-{v_{\Vert }^{\prime }}^{2})$
, where
 $K$
is a parameter-dependent constant. The response to a small torque is inversely proportional to the constant
 $K$
that measures the distance to the critical point; this non-smooth dependence of the system response on parameters is a characteristic of a phase transition.
This model does not include the weak-flow effects, or Coriolis and centrifugal effects (Peeters et al. Reference Peeters, Strintzi, Camenen, Angioni, Casson, Hornsby and Snodin2009b ) or the up–down asymmetry effects (Camenen et al. Reference Camenen, Peeters, Angioni, Casson, Hornsby, Snodin and Strintzi2009; Ball et al. Reference Ball, Parra, Barnes, Dorland, Hammett, Rodrigues and Loureiro2014) that have been the focus of recent work in the field; in many regimes the fluxes due to such effects are expected to be very small, especially for planned reactor devices. Of course, if the momentum diffusivity is indeed around zero, small fluxes are more, rather than less important, and strong-flow effects are more likely to play a role. Previous work has often taken the effective turbulent momentum diffusivity to be around one, and would need some adaptation to deal with regimes where momentum transport is not diffusive.
3 Transition to near-zero momentum diffusivity at zero magnetic shear
The transition to zero momentum diffusivity is most simply shown in simulations at zero magnetic shear. This allows us to avoid an additional flow drive effect that occurs in the neighbourhood of each rational surface, where field lines close on themselves, and which complicates the interpretation of structure formation. This torque does not lead to any inhomogeneity in a zero magnetic shear simulation because all of the field lines are rational (Beer, Cowley & Hammett Reference Beer, Cowley and Hammett1995), and there is a continuous radial translation symmetry in the local gyrokinetic equations. This ensures that any structures arising are a result of spontaneously generated inhomogeneities of the turbulence, rather than from the background geometry.
We present gyrokinetic simulations of zero magnetic shear regions of plasma in circular concentric geometry in the electrostatic limit: these are local, up–down symmetric simulations with zero average rotation so ‘residual momentum flux’ and ‘intrinsic torques’ are zero (Parra et al.
Reference Parra, Barnes and Peeters2011). Ions are taken to be collisional, with an ion–ion collision frequency of
 $0.01v_{ti}/R$
(
 $v_{ti}=(2T/m)^{1/2}$
is the thermal ion velocity). Safety factor
 $q$
is 1.15. Background temperature gradient is taken as
 $\text{d}T/\text{d}r=6T/R$
and density gradient as
 $\text{d}n/\text{d}r=0.7n/R$
. Electrons are treated as adiabatic and the same temperature as the ions. The simulation box lengths are
 $(l_{x},l_{y})=(188,94)\unicode[STIX]{x1D70C}$
; 43 toroidal modes are simulated, and the number of computation grid points are 325, 32, 8 and 32 in the radial, parallel,
 $\unicode[STIX]{x1D707}$
and parallel velocity directions respectively. The maximum poloidal wavenumber simulated is
 $k\unicode[STIX]{x1D70C}=2.8$
.
In order to analyse momentum transport in the system as a function of local flow gradients, and thereby determine an effective momentum diffusivity, we introduce a radially sinusoidal parallel flow perturbation (with peak gradient
 $v_{\Vert 0}^{\prime }$
, and wavelength equal to the simulation radial box size) into the particle distribution function: this results in a sinusoidal toroidal flow in the plasma after a few collision times, because the small poloidal component should be rapidly damped (this was indeed found to occur in the simulations presented). The evolution of the toroidal flow can then be diagnosed to measure the toroidal momentum fluxes in the system (this is related to the method presented in Candy & Belli (Reference Candy and Belli2018) that also uses sinusoidal flow profiles). For a sufficiently long-wavelength initial-flow perturbation, these flows evolve much more slowly than typical turbulence times, and are much longer wavelength than the turbulence, so can be considered as a quasi-homogeneous and quasi-static background flow. We assume that at long wavelengths toroidal flows obey a momentum diffusion equation of the form
 $$\begin{eqnarray}\frac{\unicode[STIX]{x2202}v_{\Vert }}{\unicode[STIX]{x2202}t}=\frac{\unicode[STIX]{x2202}}{\unicode[STIX]{x2202}x}\left(\unicode[STIX]{x1D712}_{M}\frac{\unicode[STIX]{x2202}v_{\Vert }}{\unicode[STIX]{x2202}x}\right).\end{eqnarray}$$
In the limit where the perturbation to
 $v_{\Vert }$
is sufficiently small, and the background is otherwise homogeneous,
 $\unicode[STIX]{x1D712}_{M}$
may be considered a constant, and a flow of the form
 $v_{\Vert }=V(t)\sin (k_{r}r)$
follows the equation
 $\unicode[STIX]{x2202}v_{\Vert }/\unicode[STIX]{x2202}t=-k_{r}^{2}\unicode[STIX]{x1D712}_{M}v_{\Vert }$
. In general, we define a momentum-diffusivity diagnostic
 $\langle \unicode[STIX]{x1D712}_{M}\rangle =-(1/k_{r}^{2})(\unicode[STIX]{x2202}/\unicode[STIX]{x2202}t)\log (v_{\Vert 1})$
, where
 $v_{\Vert 1}=\int \text{d}rv_{\Vert }\sin (k_{r}r)$
is the flow component in the first radial Fourier mode. We expect this to agree with the usual definition of momentum diffusivity in the long-wavelength limit for sufficiently small
 $v_{\Vert }^{\prime }$
. The initial flow perturbation usually decays with time, and we report the time-average
 $v_{\Vert }^{\prime }$
,
 $\langle \unicode[STIX]{x1D712}_{M}\rangle$
and heat fluxes over the last half of the simulation: simulations are considered complete once the flow has dropped to 70 % of the initial value, or
 $t=5000R/v_{ti}$
. When
 $v_{\Vert }^{\prime }$
is sufficiently large,
 $\unicode[STIX]{x1D712}_{M}$
would be expected to vary with radius, and
 $\langle \unicode[STIX]{x1D712}_{M}\rangle$
is an average momentum diffusivity across the simulation box, rather than the value at the peak
 $v_{\Vert }^{\prime }$
. Note that for a typical momentum diffusivity of
 $1\unicode[STIX]{x1D712}_{GB}$
the time scale of decay is of order
 $1000v_{ti}/R$
for this simulation box size, which allows a reasonable separation of time scales between the flow evolution and turbulence time scale (
 ${\sim}v_{ti}/R$
). Turbulence correlation lengths are of the order of a few gyroradii for these simulations, with zonal flow radial wavelengths of order 10–20 gyroradii, so the separation in spatial scale between the box-size flow and the turbulence scale is also reasonable.
We prefer this over the methods designed to simulate homogeneously sheared flow, partly because we are not convinced the wavevector-remap method (Hammett et al. Reference Hammett, Dorland, Loureiro and Tatsuno2006; Casson et al. Reference Casson, Peeters, Camenen, Hornsby, Snodin, Strintzi and Szepesi2009; Candy & Belli Reference Candy and Belli2018; McMillan, Ball & Brunner Reference McMillan, Ball and Brunner2019) implemented in these codes is correct, and also because we thereby avoid dependence on derived diagnostics of toroidal momentum transport. The components of the momentum fluxes are large in simulations with near-zero momentum flux (McMillan Reference McMillan2015) but almost exactly cancel so would otherwise require very accurate momentum diagnosis. We also present simulations using the wavevector-remap method, which show trends that agree with simulations initialised with a sinusoidal flow, once the toroidal Reynolds stress is added to the momentum transport diagnostic. Numerical convergence of momentum flux also requires relatively high radial resolution to resolve the strongly sheared modes that give rise to substantial momentum fluxes.
A two parameter scan is taken over the flow amplitude over the values
 $v_{\Vert 0}^{\prime }=\{0,0.17,0.34,0.51,0.68\}v_{ti}/R$
and over the local aspect ratio
 $a/R$
for values
 $\{0.18,0.36\}$
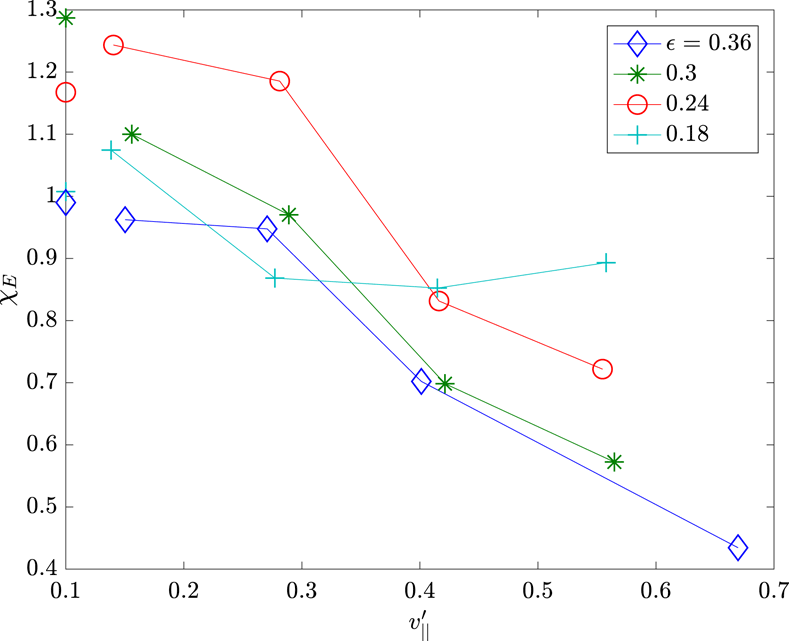
. The heat diffusivity, plotted in figure 2, shows a relatively weak dependence on the scan parameters, except at low aspect ratio, where strong stabilisation is observed for sufficient background flow levels. The Prandtl number (figure 3) has a strong dependence on aspect ratio, and drops from around 0.7 to nearly zero for small aspect ratio; it also generally increases at large flow shear. For low Prandtl numbers, longer simulations are required to achieve reasonable convergence of late-time momentum fluxes: we estimate a statistical uncertainty of 0.1 units on the Prandtl numbers in these simulations. Wavevector-remap simulations are run for values
 $a/R=\{0.18,0.36\}$
with
 $v_{\Vert 0}^{\prime }=0.1$
. Because the total background flow profile is fixed in the wavevector-remap method, fluxes are computed from the local turbulence properties, rather than based on flow profile evolution. The largest term is the toroidal component of the transport of parallel momentum by the turbulent
 $E\times B$
drift,
 $\langle Rv_{\Vert }v_{r}\rangle$
, but the toroidal Reynolds stress, which was ignored in many previous publications, was found to be significant for these parameters. The Prandtl numbers and thermal diffusivities are also plotted in figure 3 and figure 2 as isolated points. For the
 $a/R=0.36$
simulation, a Prandtl number of 0.71 would be measured if the Reynolds stress is ignored, which is in line with previous findings that the Prandtl number is of order 1, but a value of 0.22 is found once the Reynolds stress contribution is added to the toroidal momentum diagnostic (the long wavelength approximation is used, where the associated toroidal momentum flux due to
 $ExB$
motion in the toroidal direction is
 $\langle Rv_{\text{zeta}}v_{r}\rangle$
).
Radial zonal parallel flow
 $\langle v_{\Vert }\rangle$
versus radius for the
 $\unicode[STIX]{x1D716}=0.36$
(red curve, at
 $t=4900v_{ti}/R$
) and
 $\unicode[STIX]{x1D716}=0.18$
(blue curve at
 $t=1900v_{ti}/R$
) simulations with
 $v_{\Vert 0}^{\prime }=0.34$
. The initial-flow state is shown as a black trace.

Late-time heat diffusivity (
 $\unicode[STIX]{x1D712}_{E}$
) in gyroBohm units (
 $\unicode[STIX]{x1D70C}c_{s}$
) versus flow shear for various inverse aspect ratios. Connected traces show sinusoidal initial-flow method results, and isolated points are wavevector-remap results.

Late-time Prandtl number (
 $Pr$
) versus flow shear for various inverse aspect ratios. Connected traces show sinusoidal initial-flow method results, and isolated points are wavevector-remap results.

The zonal
 $v_{\Vert }$
flow patterns observed in the
 $\unicode[STIX]{x1D716}=0.36$
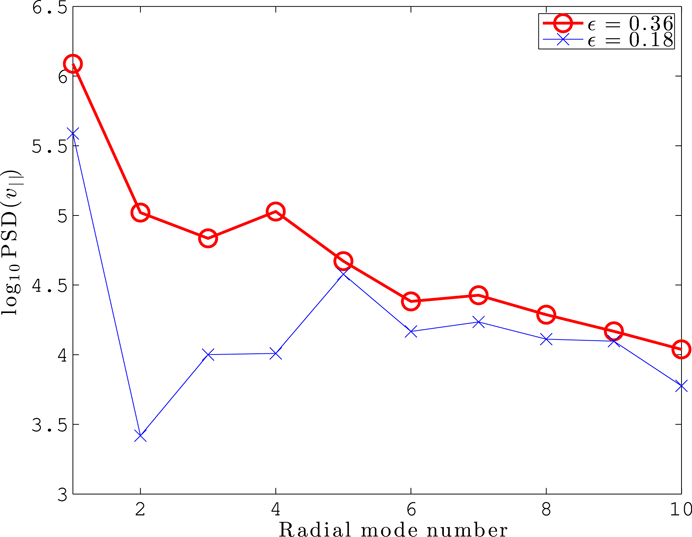
simulations have the sawtooth pattern characteristic of poloidal zonal flows (figure 1). The square amplitudes of long radial wavenumber zonal flows (with radial mode number 2–4) are an order of magnitude higher that in
 $\unicode[STIX]{x1D716}=0.18$
simulations (figure 4), which have a peak at
 $k\unicode[STIX]{x1D70C}\sim 0.2$
; note that the first radial mode is associated with the large-scale initial flow in these simulations. The accumulation of flow energy at long scales, which we propose is associated with near-zero momentum diffusivity, is characteristic of an inverse cascade occurring in the small aspect ratio simulations, i.e. a qualitatively different organisation of flows than in the
 $\unicode[STIX]{x1D716}=0.18$
simulations. We consider this evidence that the phase transition expected is taking place. One characteristic of the predicted phase transition is that simulation outputs (like mean flux levels) should non-smoothly depend on parameters when the momentum diffusivity goes to zero: higher-resolution scans and smaller statistical error bars would be required to test this convincingly. Note that this does not lead to an amplification of the initial-flow pattern, which is why the long-wavelength effective momentum diffusivity is near zero.
Radial spectrum of zonal parallel flow
 $\langle v_{\Vert }\rangle$
versus radial mode number for the smallest and largest aspect ratio simulations for the
 $v_{\Vert 0}^{\prime }=0.17$
simulations. This is time averaged over the last half of the simulation.

Additional simulations were run over several temperature gradients
 $R/L_{T}=\{5,5.5,6,7\}$
for the case with
 $r/R=0.3$
and initial flow
 $v_{\Vert 0}^{\prime }=0.1$
, and find thermal diffusivities
 $\{0.19,0.7,1.0,1.6\}$
and Prandtl numbers
 $\{-0.05,0.08,0.13,0.19\}$
: there is a transition from positive to near-zero Prandtl number as the heat flux reduces near the critical temperature gradient, in line with our model of momentum transport, but quite low Prandtl numbers are observed far from marginality. Simulations with small but finite magnetic shear were also performed (results are not shown here) and predict similar near-zero Prandtl numbers, but required unusually large simulation boxes to reach convergence, because of the effects of rational surfaces in generating flow structures (zonal flow structures due to rational surfaces have been investigated elsewhere (Dominski et al.
Reference Dominski, Brunner, Aghdam, Görler, Jenko and Told2012), but become particularly strong in low-momentum-diffusivity regimes).
In the simulations with a radially varying flow profile, we examine the alignment between the turbulent eddies and the local flow profile. The turbulence tilting angle
 $\unicode[STIX]{x1D70E}$
is measured at each time and radial position on the plane
 $\unicode[STIX]{x1D703}=0$
, with the average in the definition of
 $\unicode[STIX]{x1D70E}$
taken in the toroidal direction. Since the sign of the background flow shear changes sign across the domain, we use the time and space average of
 $\unicode[STIX]{x1D70E}^{\ast }=\unicode[STIX]{x1D70E}\text{sign}[v_{\Vert }^{\prime }(x,0)]$
to measure how well the turbulence is aligned with the initial-flow shear perturbation. The proposed model for turbulent momentum diffusivity of (2.2) suggests a linear relationship between Prandtl number and normalised turbulence alignment
 $\unicode[STIX]{x1D70E}^{\ast }/v_{\Vert 0}^{\prime }$
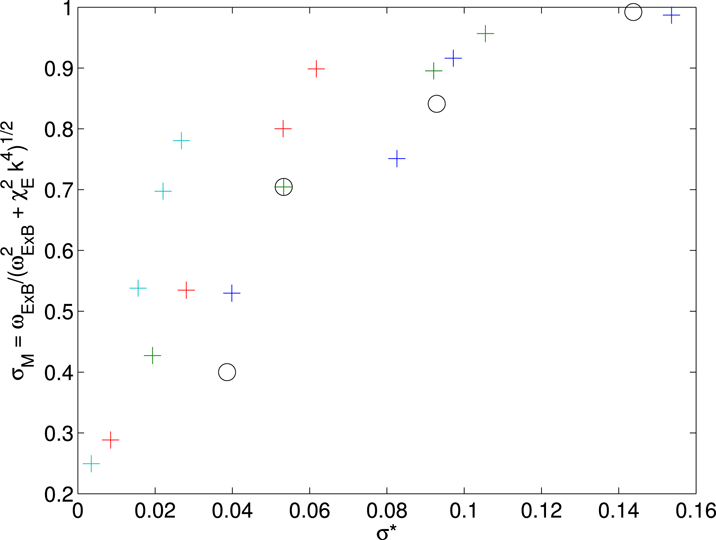
, which is reproduced reasonably well in the simulation data (figure 5). The qualitative dependence of the turbulence tilting angle
 $\unicode[STIX]{x1D70E}^{\ast }$
is also well predicted (figure 6) by the model
 $\unicode[STIX]{x1D70E}_{M}$
, which is functionally dependent on the relative strength of the flow shear and nonlinear time scale. The measured turbulence alignment is considerably weaker than the prediction. This model is clearly not capturing some important details, such as the observation that the turbulence is generally quite well radially aligned, with low typical local tilting, rather than saturating at
 ${\sim}1$
. Overall, however, the simple model effectively predicts the trends of turbulence alignment and momentum flux for the two parameter scans.
Late-time Prandtl number versus normalised flow turbulence alignment
 $\unicode[STIX]{x1D70E}^{\ast }/v_{\Vert 0}$
for the flow aspect ratio scans (crosses, colours match figure 3) and temperature gradient scan (circles).

Observed (
 $\unicode[STIX]{x1D70E}^{\ast }$
) versus modelled (
 $\unicode[STIX]{x1D70E}_{M}$
) mean turbulence tilting for the flow aspect ratio scans (crosses, colours match figure 3) and temperature-gradient scan (circles).

4 Kinetic electron studies
A simulation was run with fully kinetic electron dynamics (with artificial mass ratio
 $m_{i}/m_{e}=400$
and a small pressure
 $\unicode[STIX]{x1D6FD}=nT/(B^{2}/2\unicode[STIX]{x1D707}_{0})=10^{-3}$
), with electron and ion temperature gradients reduced to
 $R/L_{T}=4$
(so the ion and electron heat diffusivities
 ${\sim}1\unicode[STIX]{x1D712}_{GB}$
roughly match the adiabatic simulations, figure 7), but otherwise equivalent parameters. We do not attempt to fully resolve the electron scales in these simulations, which would require solving down to the electron gyroscale. The shorter-scale modes grow faster than the ion-scale modes, and there is an initial period, with low overall ion heat flux, where the short-wavelength modes have saturated but the ion-scale modes are still growing. After the ‘overshoot’ period (roughly
 $t>150R/v_{ti}$
), several bursts, spaced
 ${\sim}400R/v_{ti}$
apart, occur in the ion heat flux, which are synchronised with dips in the total flow amplitude. It is as yet not entirely clear why these bursts occur, but drops in the ion flux seem so be associated with increases in the flow amplitude, which is potentially consistent with stronger turbulence tilting at low flux levels. The electron heat flux shows less overall time variation, possibly because it is less strongly coupled to the flow dynamics (since the short-wavelength growth rates are too high for significant flow shear stabilisation to take place).
Volume-averaged heat flux (in units
 $nmc_{s}^{3}\unicode[STIX]{x1D70C}/R$
) for a kinetic electron simulation with
 $\unicode[STIX]{x1D716}=0.36$
.

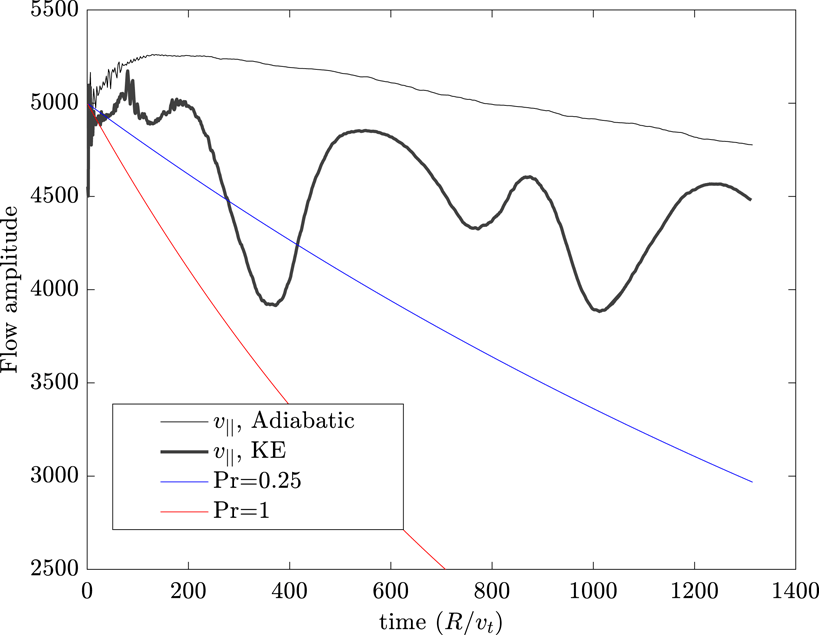
The relatively long period of the bursts, combined with the numerical difficulty of running long kinetic electron simulations, means that the overall momentum diffusivity is more uncertain in these simulations than in the adiabatic electron simulations. We plot the ion parallel flow versus time (figure 8), together with exponential decay curves consistent with Prandtl numbers of 1 and 0.25. Here, the Prandtl number is measured by dividing momentum diffusivity by the ion heat diffusivity; if the electron heat flux was included, this would tend to suggest an even lower number. The time trace of the toroidal flow is consistent with a value
 $Pr<0.25$
, indicating that the Prandtl number, as in the adiabatic electron simulations are very much less than 1; using the same fitting method as for adiabatic electron simulations yields
 $Pr=0.03$
but with a wide range of plausible fits. The existence of fairly long time periods where the rotation actually increases is also evidence that antidiffusive processes are able to overcome diffusive momentum fluxes for this parameter regime.
Flow amplitude
 $v_{\Vert }$
(in the radially sinusoidal component) versus time, for an adiabatic (thin black trace) and a kinetic electron simulation (thick black trace) with
 $\unicode[STIX]{x1D716}=0.36$
. The blue and red traces are exponential decay curves expected given a Prandtl number of 0.25 and 0.5 respectively and the thermal diffusivity of the kinetic simulation.

5 Conclusions
We find that the effective toroidal momentum diffusivity in certain tokamak configurations is near zero when the field line pitch exceeds 0.3, for thermal diffusivity
 ${\sim}1$
in gyroBohm units. These values of field line pitch are regularly exceeded in spherical tokamak configurations (i.e. MAST), and outboard midplane values near the pedestal of tokamaks like JET are typically 0.2 when central
 $q\sim 1$
: it would require dedicated (and more detailed) simulations to determine whether these results extend to shaped plasmas. Low momentum diffusivity suggests that, counter to current expectations, it may be possible to make reactor-scale tokamaks rotate relatively fast, and stabilise not just certain weak magnetohyrodynamic instabilities, like resistive wall modes, but also significantly suppress turbulent transport. For one of the cases studied here, a shearing rate of
 ${\sim}0.3v_{t}/R$
is possible with negligible torque input. This provides an alternative method to explain unexpectedly large sheared toroidal rotation in discharges with weak external torque (Solomon et al.
Reference Solomon, Burrell, Garofalo, Kaye, Bell, Cole, deGrassie, Diamond, Hahm and Jackson2010; Camenen et al.
Reference Camenen, Angioni, Bortolon, Duval, Fable, Hornsby, McDermott, Na, Na and Peeters2017) that are difficult to explain with residual stresses; this is particularly attractive to explain the excess rotation seen in spherical tokamaks (Hillesheim et al.
Reference Hillesheim, Parra, Barnes, Crocker, Meyer, Peebles, Scannell and Thornton2015). Near-zero momentum diffusivity potentially provides a mechanism to explain rapid changes in direction of rotation when experimental parameters are varied relatively smoothly (Bortolon et al.
Reference Bortolon, Duval, Pochelon and Scarabosio2006; McDermott et al.
Reference McDermott, Angioni, Conway, Dux, Fable, Fischer, Pütterich, Ryter and Viezzer2014; Hillesheim et al.
Reference Hillesheim, Parra, Barnes, Crocker, Meyer, Peebles, Scannell and Thornton2015); because large rotation is possible given small forcings, the sign of the flow shear may be controlled by small residual stresses, while the amplitude is limited by nonlinear saturation.
A finding of near-zero effective momentum diffusivity contradicts some other studies that find strong positive toroidal momentum diffusivity even for tight aspect ratio (Strintzi et al. Reference Strintzi, Peeters and Weiland2008; Casson et al. Reference Casson, Peeters, Camenen, Hornsby, Snodin, Strintzi and Szepesi2009). However, these previous studies ignored certain momentum fluxes (most importantly the toroidal momentum fluxes due to Reynolds stresses) that are expected to be much more important for tight aspect ratio devices, and these missing fluxes are large enough to explain the difference in results. We note however, that these neglected momentum fluxes are not significant in many conventional regimes, as when the fluxes are indirectly calculated (by measuring global flow profile evolution), the results are consistent with momentum diffusivities predicted by standard local treatments that ignore the toroidal Reynolds stress (Hornsby et al. Reference Hornsby, Angioni, Lu, Fable, Erofeev, McDermott, Medvedeva, Lebschy and Peeters2018). We have confirmed that, for a range of parameters, the Prandtl number measured by tracking the decay of an initial velocity perturbation is comparable to that found by imposing a uniform background sheared toroidal flow (the standard technique in local simulation), once the toroidal Reynolds stress is accounted for (but a more detailed quantitative comparison of these methods would be desirable to determine the remaining disagreement). This is despite our misgivings about the wavevector-remap method (McMillan et al. Reference McMillan, Ball and Brunner2019). The claim that a low-momentum-diffusivity regime exists is supported by earlier preliminary studies using a global gyrokinetic code, ORB5 (McMillan Reference McMillan2015), and theoretical expectations (Casson et al. Reference Casson, Peeters, Camenen, Hornsby, Snodin, Strintzi and Szepesi2009) that the Prandtl number should decrease in devices with large field line pitch. Initial investigation of more realistic geometry and with additional physics (such as the inclusion of kinetic electrons) suggest that this effect is not an artefact of the simplified simulation setup.
Acknowledgements
B.F.M. is partially supported by EPSRC grants EP/N035178/1 and EP/R034737/1. We would like to thank S. Brunner for comments on the manuscript, Y. Camenen for encouragement and the authors of the GKW code, which is available under an open-source license. Simulations were performed with the support of Eurofusion and MARCONI-Fusion. This manuscript is based upon work supported by the US Department of Energy, Office of Science, Office of Fusion Energy Sciences and has been authored by Princeton University under Contract No. DE-AC02-09CH11466 with the US Department of Energy.