I. INTRODUCTION
Lattice materials with designed three-dimensional (3D) microarchitecture, which combine high strength with low density, have been studied extensively over the past few years. Reference Bauer, Schroer, Schwaiger and Kraft1–Reference do Rosário, Berger, Lilleodden, McMeeking and Schneider9 New limits of the material property space were demonstrated and realized through a miniaturization of the individual building blocks within the lattice and a specific or hierarchical microarchitecture. Foam-like structures, in contrast, achieve rather low strength values because of their random structure. Reference Deshpande, Ashby and Fleck10,Reference Ashby11 However, they are, in general, superior when it comes to absorbing energy during deformation, which is reflected in the typical, long and flat plateau in the stress–strain curve after yield. Reference Ashby11 Most microarchitected lattices, though, show post-yield softening, after reaching the high initial maximum stress, caused by plastic buckling or crushing of the ligaments. Reference Ashby11–Reference Schaedler, Ro, Sorensen, Eckel, Yang, Carter and Jacobsen13 Hollow metallic microlattices have shown a lot of promise for energy absorbing applications. Reference Schaedler, Jacobsen, Torrents, Sorensen, Lian, Greer, Valdevit and Carter4,Reference Evans, He, Deshpande, Hutchinson, Jacobsen and Carter12–Reference Torrents, Schaedler, Jacobsen, Carter and Valdevit15 However, until now, high-strength solid-beam microlattices have not been analyzed in detail regarding their energy absorption capability during several loading cycles. To repeatedly absorb energy during compression, specifically designed structures with tailored buckling elements Reference Frenzel, Findeisen, Kadic, Gumbsch and Wegener16 or structures with multistable configurations Reference Haghpanah, Salari-Sharif, Pourrajab, Hopkins and Valdevit17,Reference Shan, Kang, Raney, Wang, Fang, Candido, Lewis and Bertoldi18 were presented.
The optimization of the energy absorption capability of high-strength microlattices is strongly desirable, but it requires a better understanding of cyclic deformation and failure of the strength-optimized structures. Not only the absorbed energy during the first loading cycle is important but also the ability of the lattice to recover, maintain its strength, and be able to absorb energy during additional cycles. Extensive recovery upon unloading after compression was reported for both hollow metallic and ceramic microlattices due to localized elastic deformation mechanisms. Reference Meza, Das and Greer2–Reference Schaedler, Jacobsen, Torrents, Sorensen, Lian, Greer, Valdevit and Carter4,Reference Torrents, Schaedler, Jacobsen, Carter and Valdevit15,Reference Maloney, Roper, Jacobsen, Carter, Valdevit and Schaedler19 These elastic mechanisms are related to their low density, resulting from a low ratio of wall thickness to strut diameter. Reference Meza, Das and Greer2–Reference Schaedler, Jacobsen, Torrents, Sorensen, Lian, Greer, Valdevit and Carter4,Reference Torrents, Schaedler, Jacobsen, Carter and Valdevit15,Reference Maloney, Roper, Jacobsen, Carter, Valdevit and Schaedler19 By contrast, polymer and ceramic-polymer composite microlattices did not show very pronounced recovery upon unloading. Reference Bauer, Hengsbach, Tesari, Schwaiger and Kraft5,Reference Schroer, Bauer, Schwaiger and Kraft20
In general, energy dissipation in solid materials is attributed to fracture, plastic deformation, and intrinsic material damping, whereas elastic buckling and hysteretic instabilities are additional effects typical of cellular materials. Reference Bauer, Meza, Schaedler, Schwaiger, Zheng and Valdevit21 Fracture and plastic deformation were identified as the predominant damping mechanisms during the first compression cycle of hollow metallic microlattices, whereas elastic mechanisms were observed to dominate during additional loading cycles. Reference Schaedler, Jacobsen, Torrents, Sorensen, Lian, Greer, Valdevit and Carter4,Reference Salari-Sharif, Schaedler and Valdevit14,Reference Torrents, Schaedler, Jacobsen, Carter and Valdevit15 In the case of epoxy-based nanoframes, Reference Lee, Wang, Kooi, Boyce and Thomas22,Reference Lee, Wang, Boyce and Thomas23 high amounts of dissipated energy during one cycle of compression have been related to plastic shearing.
Both the architecture and dimensions appear to affect the energy dissipation. Metal-coated polymer microlattices exhibited a dependence not only on the thickness of the NiB coating but also on the type of architecture. Reference Mieszala, Hasegawa, Guillonneau, Bauer, Raghavan, Frantz, Kraft, Mischler, Michler and Philippe24 For pyramidal lattice structures, the details of the architecture, such as strut angle, length and diameter, or number of stacked layers, were shown to be critical for the energy absorption capability as analyzed by finite element (FE) simulations. Reference Hammetter, Rinaldi and Zok25 It was shown that the designs could also outperform foams at higher stress levels.
In this paper, we report fully displacement-controlled in situ compression tests of polymer and ceramic-polymer composite microlattices under cyclic and progressive cyclic loading conditions, to identify and to understand the contributing mechanisms for deformation and energy dissipation of the microlattices. The testing method is critical here, since instabilities, such as those caused by buckling, Reference Ashby11–Reference Schaedler, Ro, Sorensen, Eckel, Yang, Carter and Jacobsen13 may result in premature failure under load control, Reference Bauer, Schroer, Schwaiger and Kraft1,Reference Bauer, Hengsbach, Tesari, Schwaiger and Kraft5 preventing the characterization of any deformation behavior beyond the initial yielding. Moreover, due to the in situ setup, the analysis of load–displacement data and postcompression microscopy imaging is supported with real-time observations of the microlattice deformation. In this way, it is possible to identify the deformation behavior of the microlattices under cyclic loading, and thus, the contributing energy dissipation mechanisms can be examined. The deformation and failure behavior as well as the energy absorption capability of the lattices are analyzed with respect to (i) the effect of different microarchitectures and (ii) the influence of the processing conditions of the lattices and, thus, the material behavior. Overall, a superior behavior of stretching-dominated architectures was observed. In combination with additional curing of the polymer, high recoverability as well as energy absorption can be achieved.
II. EXPERIMENTAL
Microlattices with four different types of architectures were fabricated, i.e., honeycomb structures, hexagonal structures, cubic structures with fully diagonal bracings (referred to as cubic), Reference Bauer, Hengsbach, Tesari, Schwaiger and Kraft5,Reference Bauer, Schroer, Schwaiger and Kraft6 and tetrahedral structures Reference Bauer, Schroer, Schwaiger and Kraft6,Reference Schroer, Bauer, Schwaiger and Kraft20,Reference Bauer, Schroer, Schwaiger, Tesari, Lange, Valdevit and Kraft26 (depicted in the Supplementary Material, Fig. S.1). Architectural details of the individual structures can be found in previous studies. Reference Bauer, Hengsbach, Tesari, Schwaiger and Kraft5,Reference Bauer, Schroer, Schwaiger and Kraft6 The fabrication process was performed using 3D direct laser writing (3D-DLW, Photonic Professional, Nanoscribe GmbH, Eggenstein-Leopoldshafen, Germany) with the proprietary resist IP-Dip (Nanoscribe GmbH, Eggenstein-Leopoldshafen, Germany). All types of structures are tested in the as-written state. Additionally, for selected sample batches of tetrahedral structures, a second process step was conducted. One set of samples was annealed in a vacuum tube furnace at 200 °C for 15 min as described in Ref. Reference Schroer, Bauer, Schwaiger and Kraft20 and another one coated with alumina (Al2O3) of 10- and 100-nm thicknesses using atomic layer deposition (Picosun SUNALE R-200 Advanced, Picosun Oy, Espoo, Finland) at a process temperature of 130 °C.
Mechanical characterization of the microlattices was performed by compression tests using an Alemnis in situ indenter (Alemnis, Thun, Switzerland) in a scanning electron microscope (SEM). Reference Wheeler and Michler27 The indenter was equipped with a diamond flat punch of 50 µm in diameter, and all tests were carried out fully displacement-controlled to a fixed maximum displacement of 5 µm. This maximum displacement corresponds to a nominal strain of 50% for the honeycomb structure, 25% for the hexagonal and the cubic structure, and 29% for the tetrahedral structure. Two different cyclic measuring routines at a constant displacement rate of 500 nm/s were carried out to analyze the deformation behavior and the mechanisms of energy dissipation: progressive loading to the maximum displacement in increasing steps of 500 nm with full unloading in between two loading steps and cyclic loading for 20 cycles to the predefined maximum displacement (compare Fig. 1). Using the in situ videos, it is possible to analyze the deformation behavior throughout the compression experiment and, thus, to examine the contributing deformation mechanisms. A fixed displacement rate of 500 nm/s was used for testing all structures. However, due to the different sizes of the structures, the imposed strain rates during compression varied slightly between the different structures: 0.05 s−1 for the honeycomb, 0.029 s−1 for the tetrahedral, and 0.025 s−1 for the hexagonal and the cubic structures. However, the strain rate has only a minor effect on the stress–strain behavior, as shown in Figs. S.2 and S.3 of the Supplementary Material.
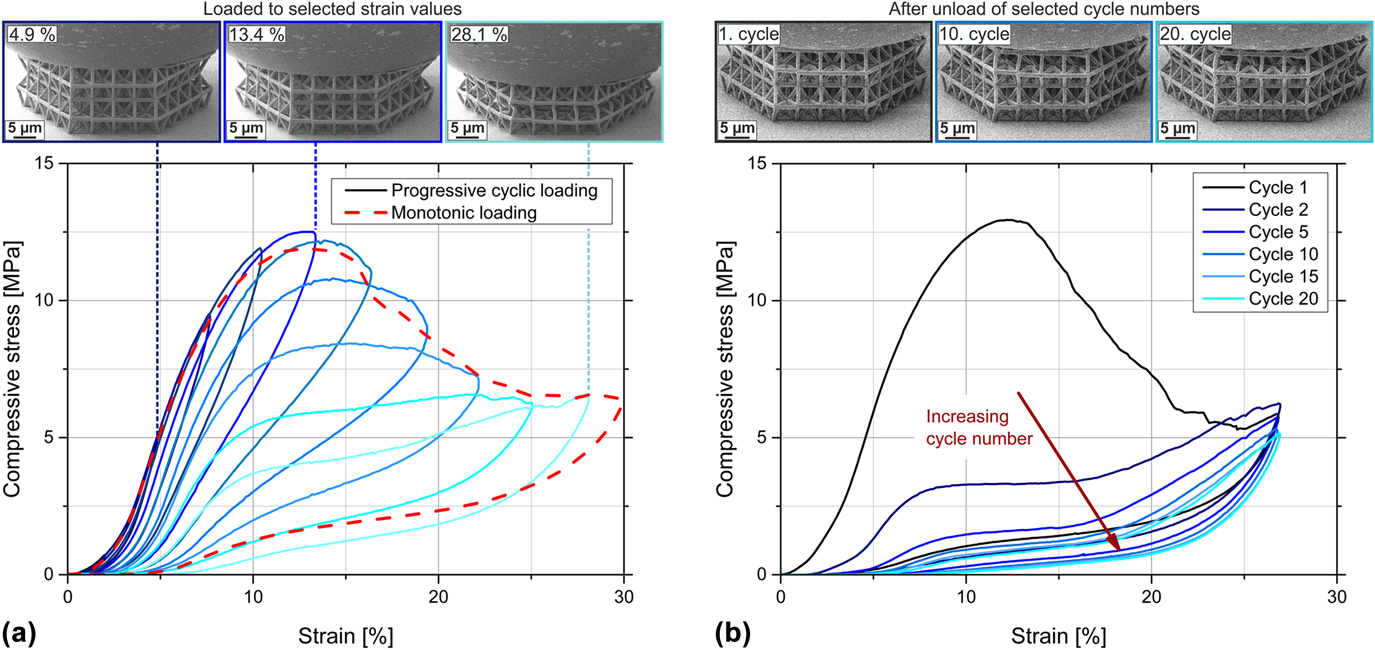
Representative compressive stress–strain curves of annealed tetrahedral structures (200 °C/15 min) to a maximum strain of ∼28% and in situ video frames of structures during testing. (a) Behavior of the structure during monotonic loading (red dashed curve) and during progressive cycling in increasing steps of 500 nm to the maximum displacement (blue continuous curves). Very good agreement of the overall stress–strain behavior between the two different test methods is visible. The offset micrographs above show video frames acquired in situ during progressive cyclic loading to selected strain values, from left to right: 4.9, 13.4, and 28.1% strain. (b) Behavior of the structure during cyclic loading to ∼28% strain for 20 cycles, only selected cycles are plotted. The offsets above show video frames during cyclic loading after complete unloading of selected cycle numbers (from left to right: after cycle 1, cycle 10, and cycle 20).

Stress and strain values were calculated using the nominal cross-sectional area and the nominal height of the structures. The stiffness of the structures was determined as the maximum slope of the loading portion of the stress–strain curve and the remaining strain as the value at zero stress upon unloading. Due to viscoelastic damping, the remaining strain might be overestimated, especially for the as-written structures. However, only low viscoelastic recovery was observed during in situ testing, confirming this evaluation (Supplementary Material Videos S.1–S.4 for polymeric structures). The compressive strength of the structures is defined as the maximum stress value within the experiment, while the maximum strain is the highest achieved strain value. During compression testing, typically a strong hysteresis is observed (compare Fig. 1) with the dissipated energy ΔU calculated from the load–displacement graph as the area enclosed by the loading and the unloading curves. Additionally, the total energy U and the elastic energy are analyzed as the areas underneath the loading and unloading curves, respectively. The loss coefficient Ψ is then calculated as the quotient of the dissipated energy ΔU and the total energy U; thus, Ψ = ΔU/U. To account for the different sizes of the lattices, the specific energy values are calculated by normalizing the energy by their mass. Overall, the influence of edge effects due to finite structure sizes cannot be excluded. Therefore, only effective structural responses can be discussed, which approximate the properties of infinite structures.
Effective density values of the structures were calculated using CAD models of a single unit cell of the structures with density values of 1280 kg/m3 for IP-Dip Reference Bauer, Hengsbach, Tesari, Schwaiger and Kraft5 and 2900 kg/m3 for ALD alumina deposited at 130 °C. Reference Groner, Fabreguette, Elam and George28 Within the CAD models, the following dimensions were applied: for the strut lengths, the nominal, programmed lengths of the ligaments, and for the strut diameters or side lengths of rectangular cross-sections of ligaments, the real dimensions measured using SEM images. The deformed structures were analyzed using a helium ion microscope (HIM; ORION NanoFab, Carl Zeiss Microscopy GmbH, Oberkochen, Germany).
To estimate the amount of fractured ligaments or fractured nodes during cyclic loading, FE simulations were carried out using ANSYS Academic Research APDL (ANSYS, Inc., Canonsburg, Pennsylvania). A tetrahedral structure was simulated with linear-elastic material behavior and geometric nonlinearities. As material input parameters, a Young’s modulus value of 2.9 GPa and a Poisson’s ratio of 0.41 were used for annealed IP-Dip. Young’s modulus of annealed IP-Dip was estimated by fitting an FE simulation of a push-to-pull tensile test to the experimentally measured curve of a corresponding sample, as described in Ref. Reference Schroer, Bauer, Schwaiger and Kraft20. A CAD model of the tetrahedral structure was implemented by applying measured side lengths of rectangular cross-sections of the ligaments [see Fig. S.8(a) in the Supplementary Material] and the nominal strut length. The symmetry of the structure was exploited to simplify calculations. Thus, only the upper half of the structure was simulated. Meshing of the model was conducted with automatic, fine mesh sizing by applying the element type solid187, which is a higher-order 3D element and well suited to model irregular meshes. The element possesses 10 nodes with three degrees of freedom at each node (translation in the x-, y-, and z-direction) and the model is meshed with more than 398,000 elements. A coarser mesh with only 290,000 elements resulted in <0.2% higher values in the area without geometrical nonlinearities (displacement <1800 nm), which confirms mesh convergence with the finer mesh. When geometrical nonlinearities occur (displacement >1800 nm), the results differ by up to 5%; therefore, the finer mesh was used. The displacement was applied on the top nodes of the structure in the vertical direction (i.e., z-direction) with only half of the value of the experiments to account for the symmetry of the structure. The displacements in the horizontal plane of the top nodes (i.e., the x- and y-direction) are set to zero to replicate the observed sticking friction condition between the indenter tip and the lattice and between the substrate and the lattice. Symmetry boundary conditions are applied at the bottom nodes within the FE simulation (u z = 0).
To simulate the fractured nodes within the structure, the elements of selected vertical struts were deactivated by setting the stiffness to near-zero. Figure S.8(b) of the Supplementary Material depicts two examples of deleted ligaments with the deactivated elements shown in red. The first two sets of deleted ligaments (12 and 24 deleted ligaments) take into account the regions of the highest von Mises stresses at the six outer corners of the top surface of the structure. Further deleted sets were selected manually to distribute the deleted ligaments evenly over the whole structure. All elements within horizontal struts and within nodes are still active. The vertical reaction forces on the top nodes were calculated for different given displacement values and the corresponding stiffness values were compared to compression experiments of an annealed tetrahedral structure.
III. RESULTS AND DISCUSSION
A. General survey
Representative stress–strain curves of the three different experimental routines for an annealed tetrahedral structure are shown in Fig. 1. Loading to an ∼28% maximum strain [red dashed line, Fig. 1(a) and first cycle of cyclic loading, Fig. 1(b)] shows elastic–plastic deformation behavior in the first part of the curve until the maximum stress value is reached in the range of 12% strain. A small part of the curve reflects some misalignment between the indenter tip and the structure or irregularity on the top surface of the lattice, which shows as nonlinear behavior at low strain values. The maximum stress value is then followed by a pronounced decrease in stress, which is related to buckling or brittle fracture of the ligaments. Reference Ashby11 The onset of buckling at the maximum stress value can also be observed in the offset micrographs of Fig. 1(a). The image in the middle shows the lattice deformed to 13.4% strain, which is approximately the strain value at the maximum stress; slight buckling is already visible for the ligaments at the outer left- and right-hand side of the structure. No buckling is visible at 4.9% strain (left offset), while pronounced buckling of the individual ligaments can be observed at the maximum strain value of 28.1% which is shown in the right offset of Fig. 1(a) (also compare the in situ Video S.1 of cyclic loading of an annealed tetrahedral structure presented in the Supplementary Material). Pronounced recovery upon unloading can be identified by the low remaining strain at zero stress. During loading and unloading, distinct hystereses are observed clearly indicating energy dissipation. The stress–strain curves of the progressive cyclic testing [blue continuous lines, Fig. 1(a)] coincide very well with the stress–strain behavior of the monotonic loading [red dashed line, Fig. 1(a)], confirming a comparable deformation behavior under the two different experimental conditions. It is noted that the occurring deformation mechanism of buckling is based on the analysis of the in situ videos, where buckling is clearly visible (compare Supplementary Material Video S.1, particularly cycle 1). Moreover, by analyzing the value of remaining strain, it is obvious that not only plastic deformation mechanisms are present but also elastic contributions.
During repeated cyclic loading to the maximum strain [Fig. 1(b)], a strong reduction of the area of the hysteresis loop is observed from cycle to cycle, which is mainly attributed to continuous irreversible fracture events within the structure. The most distinct decrease of the hysteresis occurred from the first to the second cycle, indicating that most fracture events appear during the first compression cycle to ∼28% strain. For higher cycle numbers, the deformation behavior stabilized and is characterized by an almost self-similar size and shape of hysteresis loops, which was also observed for other cellular materials. Reference Meza, Zelhofer, Clarke, Mateos, Kochmann and Greer3,Reference Schaedler, Jacobsen, Torrents, Sorensen, Lian, Greer, Valdevit and Carter4,Reference Salari-Sharif, Schaedler and Valdevit14,Reference Torrents, Schaedler, Jacobsen, Carter and Valdevit15 Comparing the structures after unloading at different cycle numbers, as shown in the offsets of Fig. 1(b), it is also observed that the appearance of the structure, especially its height, differs more between the first and the 10th cycle [left and middle offsets of Fig. 1(b)] than between cycle 10 and cycle 20 [middle and right offsets of Fig. 1(b)], indicating more pronounced fracture during the early cycles than during larger cycle numbers. Nevertheless, pronounced recovery of the structure is visible even after 20 loading cycles [right offset of Fig. 1(b)]. The very high number of fracture events during the first cycle was confirmed by FE simulations, which are shown in Sec. III.C. Here, ligaments within the structure were deleted to match the experimentally measured decreasing stiffness of the structure from cycle to cycle. It was shown that the highest number of newly deleted ligaments is necessary from the first to the second cycle.
The energy dissipation during compression can be related to several processes as described in Ref. Reference Salari-Sharif, Schaedler and Valdevit14. These processes include deformation mechanisms with fracture events and plastic deformation as well as elastic buckling of ligaments. Moreover, frictional dissipation plays a role (i) when whole ligaments come into contact at higher strain values (referred to as “macroscale friction”) or (ii) due to frictional contact of fracture surfaces in microcracks within the structure (referred to as “microscale friction”). Intrinsic material damping of the constituent materials is a further dissipation mechanism, while it should be noted that polymeric materials generally have high damping capacities and ceramics have low damping capacities. Reference Ashby29 Viscous air damping around the structure might also contribute to energy dissipation Reference Salari-Sharif, Schaedler and Valdevit14 but can be excluded in our study, since all compression tests were carried out in vacuum. As described in Ref. Reference Bauer, Meza, Schaedler, Schwaiger, Zheng and Valdevit21, energy dissipation can also result from a damped high frequency vibration. Such a vibration is induced during a snap-through event between buckled and unbuckled states of a ligament, which is the case for lattices specifically designed for energy absorption or multistable lattices. Reference Frenzel, Findeisen, Kadic, Gumbsch and Wegener16,Reference Haghpanah, Salari-Sharif, Pourrajab, Hopkins and Valdevit17 However, this effect is not relevant for energy absorption within our study, since the presented microlattices are not designed for snap-through events but rather buckle uniformly during compression. The contributing dissipation mechanisms during compression of the presented microlattices are discussed in more detail in Sec. III.D.
Overall, no catastrophic fracture of the annealed tetrahedral structures was observed during compression. Instead, pronounced recovery was seen upon unloading even after several loading cycles. Nevertheless, fracture events do occur within the structure, the majority of them during the first cycle of compression, which also reduce the area of the observed hysteresis the most from the first to the second cycle.
The general behavior during compression of the microlattices was described on the basis of the stretching-dominated tetrahedral structure under the annealed condition, for which a superior behavior was observed with respect to energy absorption and recoverability in comparison with the other types of architecture and processing conditions. As a consequence of different deformation modes for other microarchitectures (Sec. III.B) and different material properties resulting from the processing conditions (Sec. III.C), the individual values of specific properties, e.g., remaining strain or compressive strength, differ for the other experiments. However, the overall behavior of the stress–strain curves and the individual regimes of deformation are still transferable to the other architectures and material systems. Based on the comparison with literature data, the different mechanisms contributing to energy dissipation are discussed (Sec. III.D).
B. Influence of microarchitectures
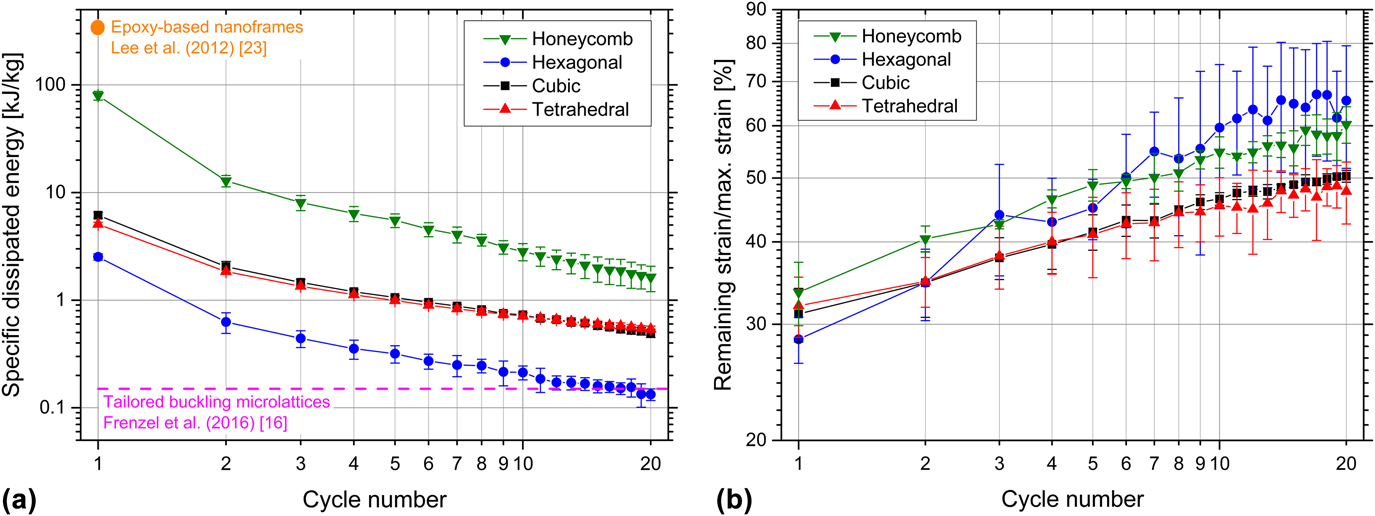
The specific dissipated energy of the microlattices during cyclic testing is shown in Fig. 2(a) as a function of the cycle number. The honeycomb structures dissipate the highest amount of specific energy during the experiments, which results from the high maximum stress values Reference Bauer, Hengsbach, Tesari, Schwaiger and Kraft5 due to the solid material all aligned in the direction of loading. The hexagonal structures, with the lowest maximum stress value, Reference Bauer, Hengsbach, Tesari, Schwaiger and Kraft5 dissipate the lowest amount of specific energy, while the cubic and tetrahedral structures lie in between showing very similar behavior. For all four types of architectures, the specific dissipated energy decreases with increasing cycle numbers, which is caused by numerous and irreversible fracture events within the structures.
Results of cyclic testing to a maximum number of 20 cycles for the as-written structures with different types of architectures as a function of the cycle number. (a) Average specific dissipated energy of the structures and (b) average remaining strain after unloading divided by the maximum strain. Maximum displacement of individual cycles: 5 µm. Error bars show the standard deviation of three tests. In (a), literature values of epoxy-based nanoframes Reference Lee, Wang, Boyce and Thomas23 and of polymer microlattices with tailored buckling elements Reference Frenzel, Findeisen, Kadic, Gumbsch and Wegener16 are included for comparison.
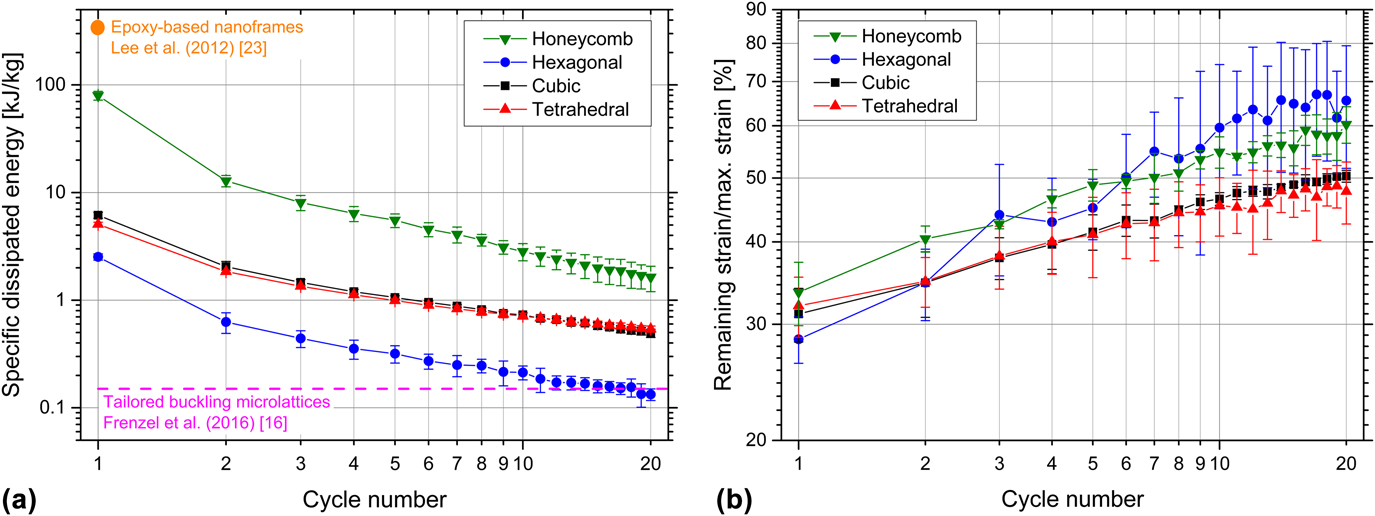
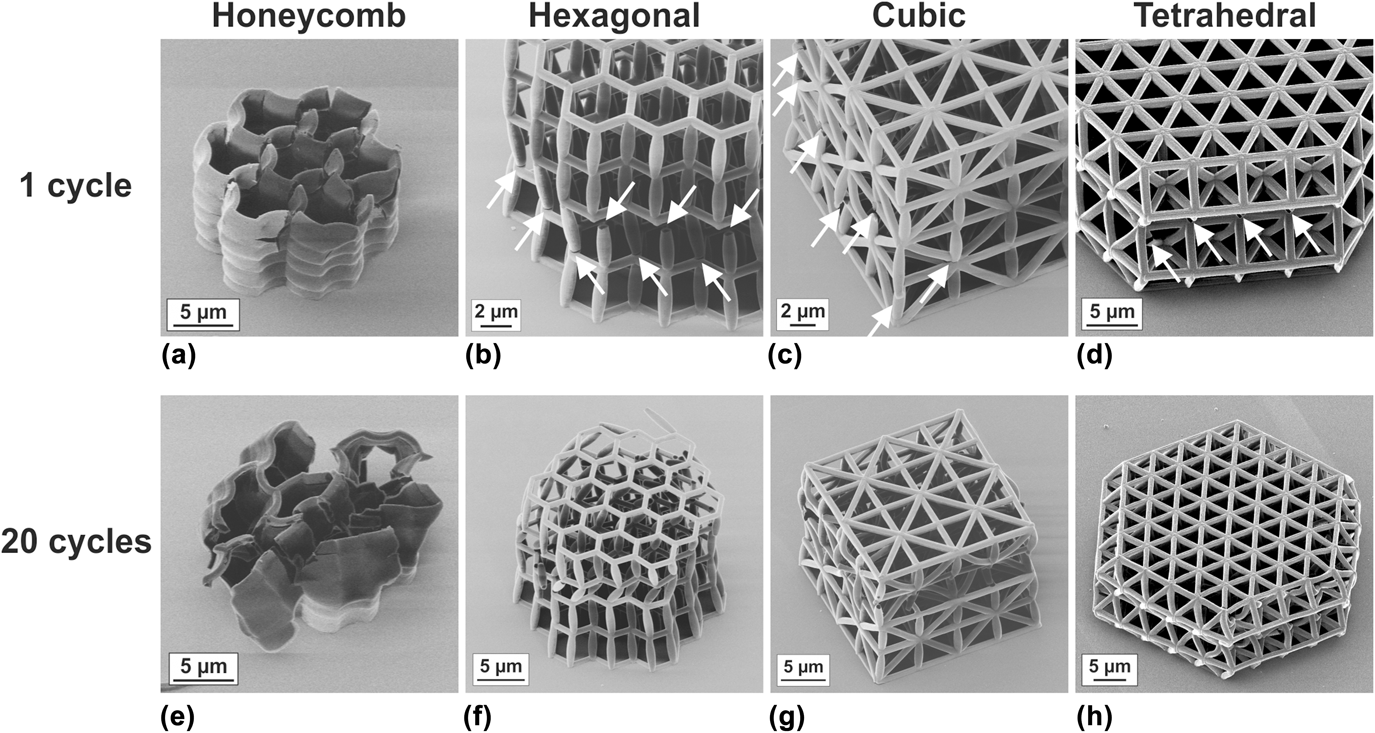
For all architectures, during the first cycle, the energy dissipation is highest and then significantly decreases in the second loading cycle. The characteristic values are summarized in Table S.1 of the Supplementary Material. The honeycomb structures show the most distinct decrease in the specific dissipated energy when comparing the first to the second cycle. The reduction to 16% of the initial value is accompanied by an increase of the remaining strain by 21%. This general trend can be seen for all architectures, while the reduction in energy dissipation is less pronounced. As shown in Figs. 3(a)–3(d), damage within the structures is clearly visible already after one loading cycle. Global and local buckling of the structures and the ligaments can be observed as the main failure mechanisms as well as fracture at the nodes, which agrees well with earlier studies. Reference Bauer, Hengsbach, Tesari, Schwaiger and Kraft5,Reference Schroer, Bauer, Schwaiger and Kraft20 Buckling can be identified by analyzing the in situ videos along with the microscopy images after compression (compare Supplementary Material Fig. S.4 and in situ Videos S.2–S.4 of monotonic loading of a hexagonal and a cubic structure, and cyclic loading of a tetrahedral structure, along with Fig. 3).
HIM images of tested microlattices with different types of architecture, in the as-written state. (a)–(d) After one cycle and (e)–(h) after 20 cycles to a maximum displacement of 5 µm. Already after the first cycle, numerous fracture events within the different structures are visible (marked with an arrow), whereas fracture occurs mainly at the nodes. After 20 cycles, the extent of damage increased for all structures.

Considering the accumulated amount of specific dissipated energy during the experiment of 20 cycles, the honeycomb structure exhibited the best performance, which was also reported for nickel–boron–coated structures of the same microarchitecture. Reference Mieszala, Hasegawa, Guillonneau, Bauer, Raghavan, Frantz, Kraft, Mischler, Michler and Philippe24 However, for larger cycle numbers, the advantage of triangular braced frameworks, i.e., cubic and tetrahedral structures, is emphasized. While it was shown that for the strength and stiffness of microlattices, the characteristics of a bending- or stretching-dominated architecture are not the only relevant factor but rather the effective density determines these values. Reference Meza, Phlipot, Portela, Maggi, Montemayor, Comella, Kochmann and Greer30 We observed a major influence of a stretching-dominated architecture on energy dissipation and recoverability. For both triangular braced microarchitectures (cubic and tetrahedral), the reduction in the specific dissipated energy is much smaller when comparing the normalized values for cycle 20 reaching approximately 10% compared with only 2% in the case of the honeycombs (Table S.1 of the Supplementary Material). Furthermore, the increase in the remaining strain is smaller after 20 cycles as listed in Table S.1 and plotted in Fig. 2(b). However, it should be noted that the maximum strain of the honeycomb structure is higher than that of the other ones (honeycomb ∼47%, hexagonal ∼22%, cubic ∼25%, and tetrahedral ∼28%) since the structures were deformed to a fixed maximum displacement instead of a fixed strain value. A weak scaling of the loss factor with lattice density but a strong influence of the maximum strain during compression was found for polymeric bending- and stretching-dominated architectures fabricated with the same resist as used in our study. Reference Krödel, Li, Constantinescu and Daraio31 Although the honeycomb structures are compressed to the highest maximum strain, their performance of energy dissipation for higher cycle numbers is inferior compared to the stretching-dominated architectures. This again emphasizes the importance of the specific microarchitecture for energy dissipation.
The specific dissipated energy per cycle remains at a fairly constant value for the higher cycle numbers with a decrease of 15% for the cubic and 10% for the tetrahedral structures comparing the 15th and the 20th cycles, respectively. By contrast, for the honeycomb structures, the specific dissipated energy per cycle decreases more strongly over the whole experiment with an 18% reduction from cycle 15 to cycle 20. Such a behavior is less preferable for longtime loading since additional damage within the structure is still generated in every cycle. The hexagonal structure is very prone to global and local buckling, and node fracture. It is therefore quite weak, which results in a pronounced decrease of the specific dissipated energy in 20 cycles and a strong increase of the remaining strain. The deformed structures after 20 loading cycles are shown in Figs. 3(e)–3(h). Compared with the first cycle [Figs. 3(a)–3(d)], the extent of fracture or damage is significantly higher for all four types of architectures. However, the most severe damage is observed for the hexagonal structures with a large number of fractured nodes and for the honeycomb structures, whose overall shape is no longer recognizable. Fracture as the main failure mechanism in the hexagonal and honeycomb structures might also contribute to the large scatter of the individual results reflected in the larger standard deviation (Fig. 2). In particular, the remaining strain of the hexagonal structures varied greatly between samples, which might be related to the statistical nature of the fracture events.
Overall, the tetrahedral structure outperforms the cubic one, as reflected by the higher loss coefficient and normalized specific energy dissipation, and the lower values of normalized remaining strain (Supplementary Material, Table S.1). The differences in specific dissipated energy are small for the two architectures; however, the damage of the tetrahedral structure after 20 cycles appears less compared with the cubic structure [compare Figs. 3(g) with Reference Meza, Zelhofer, Clarke, Mateos, Kochmann and Greer3(h)].
Higher values of specific dissipated energy were found for epoxy-based nanoframes with a porosity of 30–40% Reference Lee, Wang, Boyce and Thomas23 than for our epoxy-based microlattices [Fig. 2(a)]. However, in our study, the maximum strains were lower, which make recoverability and repeated energy dissipation during further cycles possible. A constant but lower amount of specific energy during multiple cycles can be absorbed by polymer microlattices with specifically designed buckling elements. Reference Frenzel, Findeisen, Kadic, Gumbsch and Wegener16
C. Influence of processing
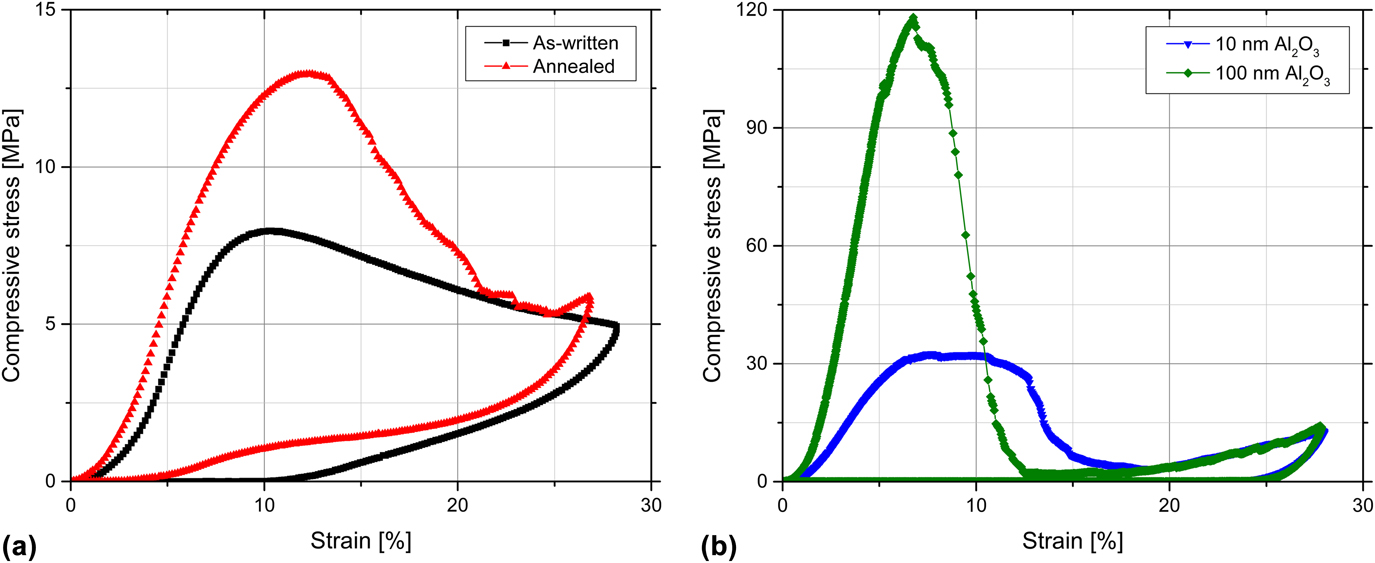
The additional processing steps after 3D-DLW have a significant effect on the deformation behavior under cyclic loading of otherwise identical architectures. Figure 4 shows representative compressive stress–strain curves of one loading cycle for four differently processed tetrahedral structures—as-written and annealed [Fig. 4(a)] as well as coated with 10 and 100 nm of alumina [Fig. 4(b)]. As expected, both the compressive strength and the stiffness increase due to annealing and alumina coating as reported in Refs. Reference Bauer, Hengsbach, Tesari, Schwaiger and Kraft5, Reference Bauer, Schroer, Schwaiger and Kraft6, and Reference Schroer, Bauer, Schwaiger and Kraft20. While the annealing treatment only increases the strength and the stiffness, the alumina coating also causes an increase of the density of the structures. Overall, the specific stiffness increases by a factor of 1.3 for the annealed structure and by about 3 and 7 for the 10-nm and 100-nm alumina-coated structures, respectively. The specific compressive strength increases by a factor of 1.6 after annealing and by about 3 and 6 for the 10-nm and 100-nm alumina coatings, respectively. However, the increase of the compressive strength due to the alumina coating is more pronounced than in earlier studies. Reference Bauer, Schroer, Schwaiger and Kraft6,Reference Schroer, Bauer, Schwaiger and Kraft20 This highlights the importance of the processing conditions and, in this case, the resulting properties of the ALD coating. Here, the ALD process was performed at 130 °C (Picosun SUNALE R-200 Advanced, Picosun Oy, Espoo, Finland), whereas in earlier studies, ALD was performed at 90 and 250 °C (Savannah 100, Cambridge NanoTech, Veeco/CNT, Waltham, Massachusetts). Furthermore, the mechanical properties might also vary depending on the resist batch being used.
Representative compressive stress–strain curves of the tetrahedral structures to a maximum strain of ∼28%: (a) As-written and after annealing and (b) with 10- and 100-nm alumina coating.

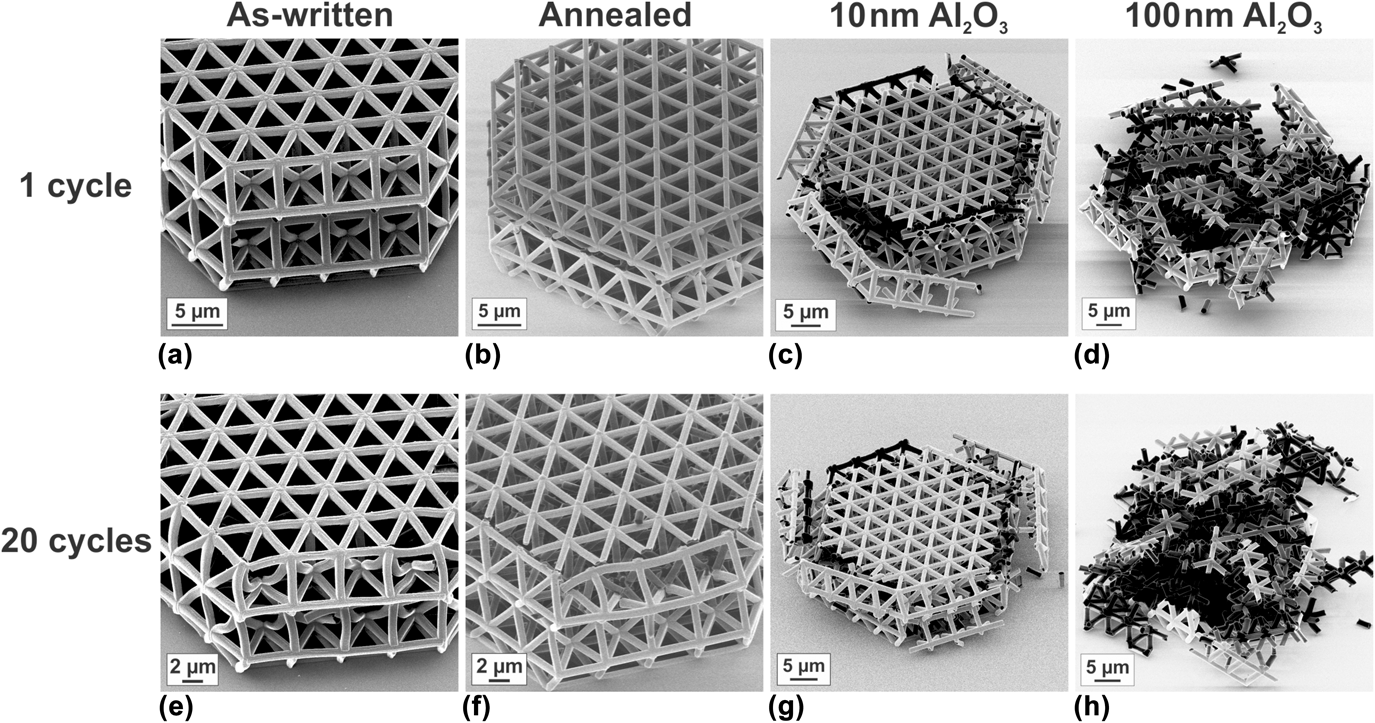
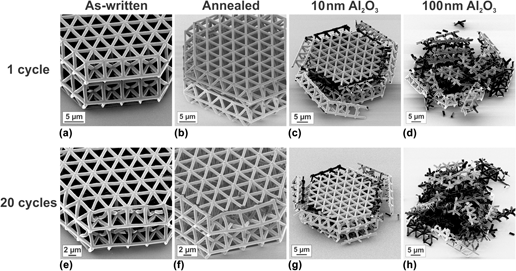
The softening behavior observed in the stress–strain curves is also more pronounced for the annealed and coated samples. In particular, the structure with the 100-nm-thick alumina coating shows a pronounced decrease of the stress value to only ∼2% of the compressive strength due to catastrophic and brittle fracture [Fig. 4(b)]. Moreover, all stress–strain curves of the annealed or coated structures exhibit a second stress increase at strains >20% related to localized compression, which results from deformation that is limited to individual parts of the microlattice. Such a stress increase is not observed for the as-written samples. While the as-written samples exhibit mainly buckling of the ligaments and only few fractured nodes, the annealed structures had a large number of fractured nodes as shown in Figs. 5(a) and 5(b). The coated structures are severely damaged after only one cycle to ∼28% [Figs. 5(c) and 5(d)]. Typically, when buckling occurs, the structures deform rather homogeneously, while the deformation localizes in the damaged parts, when fracture is the predominant mechanism (compare Supplementary Material Fig. S.5 and Videos S.1, S.4, and S.5 for an annealed tetrahedral structure, an as-written structure, and a structure with a 10-nm-thick alumina coating, respectively). In these regions, the broken ligaments come into contact and become entangled, which finally results in localized compression and, thus, in the higher stress values. This mechanism is most pronounced for the 100-nm-thick alumina coating with the steepest stress decrease and fracture at the lowest strains [compare Fig. 4(b)]. It is noted that localized compression should not be confused with densification, as also explained in Ref. Reference Schaedler, Jacobsen, Torrents, Sorensen, Lian, Greer, Valdevit and Carter4, since this is only an effect in the already deformed parts and not in the whole structure. Apparently, the thickness of the alumina coating has a limited effect on the strength of the structures as soon as several ligaments have fractured as indicated by the overlapping curves describing the coated structures after 20% strain.
HIM images of tested tetrahedral structures: (a)–(d) after one cycle and (e)–(h) after 20 cycles to a maximum strain of ∼28%. More pronounced fracture from left to right (as-written—annealed—10-nm Al2O3 coating—100-nm Al2O3 coating) is visible. The as-written structure in (a) shows buckling as the deformation mechanism with an increasing number of fractured nodes and buckled ligaments after 20 cycles (e). Due to annealing and coating, the fracture behavior changes from pronounced buckling to mainly brittle fracture. Coated samples show only minor differences in the extent of fracture between one loading cycle (c and d) and 20 cycles (g and h), whereas the annealed structure shows a strongly increased number of fractured nodes after 20 cycles in comparison with 1 cycle (b and f).

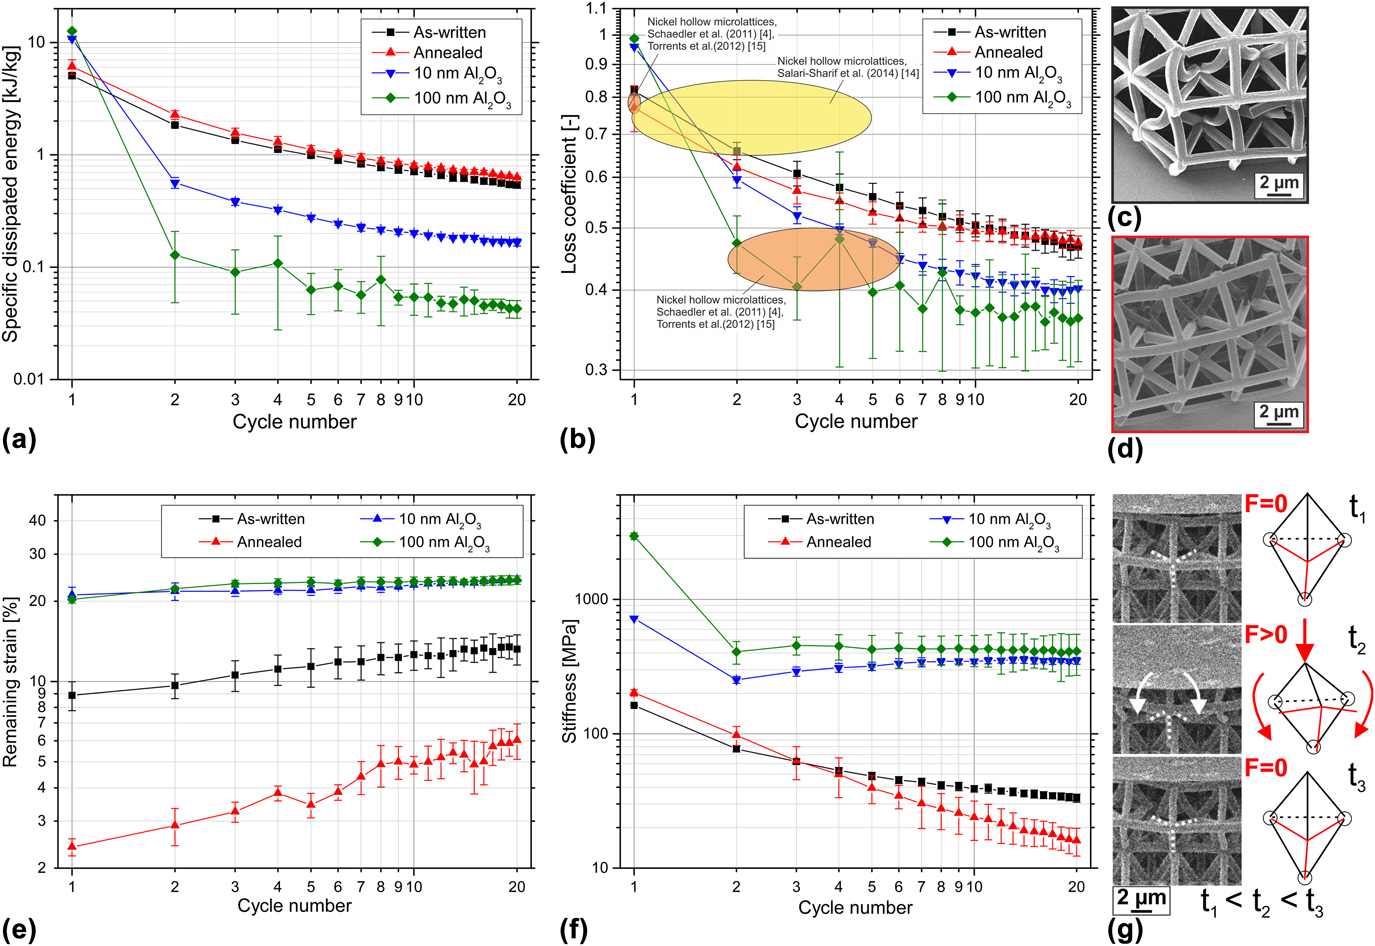
The specific dissipated energy of the different tetrahedral structures as a function of the cycle number is plotted in Fig. 6(a). Similar to the as-written structures [Fig. 2(a)], the specific dissipated energy decreases with increasing cycle number. The highest value is observed for the coated structures during the first cycle, which mainly results from the high compressive strength. However, due to the catastrophic fracture of these structures during the first cycle [Figs. 5(c) and 5(d)], the energy dissipation is much less in the following cycles than for the polymer structures. In the second cycle, the coated structures reach 5% or less of the initial energy dissipation and practically nil after 20 cycles in the case of the 100-nm coating (Table S.2 of the Supplementary Material). Annealed and as-written structures exhibit a smoother decrease of the specific dissipated energy per cycle (Table S.2). The annealing treatment only plays a minor role for the energy dissipation. Slightly higher specific dissipated energy values are reached in comparison with the as-written samples. As in the case of the coated structures, this is to some extent a result of the higher compressive strength, but in addition, the recovery upon unloading is more pronounced [compare Fig. 6(e)], which results in a higher contribution of the elastically stored energy. Summing up over all 20 cycles, the amount of specific dissipated energy is highest for the annealed structures. The change per cycle is comparable for the different tetrahedral structures with a decrease of 11% and 10% when comparing cycles 15 and 20 for the annealed structure and the as-written structure, respectively. For the 10-nm coating, a 9% reduction was observed and 15% for the 100-nm coating. In the case of the polymeric samples, fracture events may still contribute to the energy dissipation during the higher cycle numbers, since the structures are, in general, less damaged in the earlier loading cycles. Comparing the micrographs after cycle 1 and cycle 20 (Fig. 5), both polymeric structures show more deformation and fractured nodes after 20 cycles, indicating that in addition to the elastically stored energy plastic deformation and fracture events within the structures contributed to the energy dissipation. By contrast, the coated structures do not look very different after one and 20 cycles, indicating that after the first cycle, the contribution of the fracture events is reduced. Due to the catastrophic fracture of the coated structures during the first loading cycle, the energy dissipation during following cycles cannot be related to the structural response any longer. Therefore, the coated structures cannot be cycled at strains exceeding their failure strain (approximately ≥10%).
Results of cyclic testing to 20 cycles for tetrahedral structures in the as-written state, annealed, and with 10- and 100-nm Al2O3 coating. The maximum strain was ∼28%. The average values of three tests for the as-written structures and annealed structures, and two tests for the coated ones are shown with error bars representing one standard deviation. (a) Specific dissipated energy. (b) Loss coefficient in comparison with literature values for the different cycle numbers. (c and d) HIM images of tetrahedral structures after 20 cycles: (c) as-written and (d) annealed. Buckled ligaments and few fractured nodes can be observed for the as-written structure and pronounced fracture at the nodes is seen for the annealed structure. (e) Remaining strain after unloading of the structures. (f) Stiffness for the different cycle numbers. (g) Video frames from in situ testing in combination with schematic images showing rotation of ligaments around intact nodes. Within the schematic images, rotating ligaments are shown in red and fractured nodes are highlighted with circles.

Comparable or even higher loss coefficients than found in Refs. Reference Schaedler, Jacobsen, Torrents, Sorensen, Lian, Greer, Valdevit and Carter4, Reference Salari-Sharif, Schaedler and Valdevit14, and Reference Torrents, Schaedler, Jacobsen, Carter and Valdevit15 for hollow nickel microlattices were observed in our study [Fig. 6(b) and Table S.2 of the Supplementary Material]. Even after 20 cycles, the loss coefficients were still ≥0.4. The higher loss coefficients of hollow nickel microlattices during first loading cycles were attributed to fracture events, Reference Schaedler, Jacobsen, Torrents, Sorensen, Lian, Greer, Valdevit and Carter4,Reference Salari-Sharif, Schaedler and Valdevit14,Reference Torrents, Schaedler, Jacobsen, Carter and Valdevit15 in agreement with the very high loss coefficients of the Al2O3-coated structures showing pronounced fracture during the first cycle. After fracture, it is suggested that mainly elastic and recoverable events are present in the Ni microlattices during further cycles. Reference Torrents, Schaedler, Jacobsen, Carter and Valdevit15 In our study, additional fracture events were observed after the first cycle, in particular for the polymeric structures (Fig. 5), which can explain the higher loss coefficients. It needs to be noted, though, that the relative density of our structures (∼10–25%) is considerably higher compared with the hollow metallic microlattices, which yields considerably higher maximum stress values.
The different deformation behaviors after different processing conditions are also reflected by the remaining strain and the stiffness of the tetrahedral structures, as shown in Figs. 6(e) and 6(f). For the coated structures, the remaining strain is rather high and relatively constant over 20 cycles. The stiffness decreases significantly after the first cycle and remains constant afterward, again related to the catastrophic and brittle fracture during the first cycle and only minor changes of the remaining structure afterward. The two polymeric samples show lower remaining strains for all cycle numbers, especially for the annealed structure, a pronounced recovery upon unloading is observed with a remaining strain of 6% after 20 cycles. The superior elastic recovery over the whole experiment for the annealed structures [Fig. 6(e)] in comparison with the as-written ones (also compare video frames from in situ testing in the Supplementary Material, Fig. S.6) seems to be in contradiction to the change of stiffness during cyclic loading [Fig. 6(f)]. The stiffness of the annealed structures determined in cycles 1 and 2 is higher than the stiffness of the as-written samples. From the 4th cycle on, though, their stiffness is lower showing a more pronounced decrease than the as-written samples.
Competing influences of material and structural properties may be related to this behavior: Young’s modulus of the annealed material is higher than that of the as-written material, Reference Schroer, Bauer, Schwaiger and Kraft20 which leads to a higher stiffness of the structure in the initial state. For the as-written sample, buckling is observed as the main failure mechanism (compare Supplementary Material Video S.4); even after 20 cycles, mainly buckled ligaments are clearly visible [Fig. 6(c)]. By contrast, the annealed sample shows pronounced fracture at the nodes with a large number of fractured nodes after 20 cycles but no buckled ligaments [Fig. 6(d)]. Due to node fracture, in comparison with mainly buckled ligaments, the stiffness of the annealed structure decreases faster with every cycle and, thus, is already lower after three cycles. However, the elastic recovery of elastically buckled ligaments is time-dependent, while plastically buckled ligaments do not recover. Therefore, the remaining strain of the as-written samples is fairly high. The elastic recovery of the annealed samples is based on the rotation of the fractured ligaments around intact nodes [schematic in Fig. 6(g) based on video frames from in situ testing], which leads to fast and pronounced recovery upon unloading. As in a spring (with the spring constant k and the displacement u), the restoring force can be defined as −k·u. The higher Young’s modulus (equivalent to the spring constant) of the annealed material leads to a higher restoring force within the material in comparison with the as-written one. Consequently, elastically buckled ligaments within the annealed structures can be expected to recover in a more pronounced way than in the as-written structures.
For the coated structures, rotation of ligaments around nodes is not expected due to the catastrophic fracture of large parts of the structures. Thus, recovery due to this effect can be neglected.
For hollow metallic and ceramic microlattices, pronounced recoverability with very low remaining strain values after compression to ≤50% strain was observed. Reference Meza, Das and Greer2–Reference Schaedler, Jacobsen, Torrents, Sorensen, Lian, Greer, Valdevit and Carter4,Reference Salari-Sharif, Schaedler and Valdevit14,Reference Torrents, Schaedler, Jacobsen, Carter and Valdevit15,Reference Maloney, Roper, Jacobsen, Carter, Valdevit and Schaedler19 This behavior is related to a low wall-thickness-to-strut-diameter ratio of the hollow beams, which enables deformation modes withstanding the high strains. Local elastic shell buckling together with wrinkling of tubes near nodes was observed for thin-walled, hollow ceramic microlattices, which enabled the recovery of the lattices. Reference Meza, Das and Greer2 For the hollow metallic microlattices, large deformations were enabled by rotation at lattice nodes induced by local buckling or partial node fracture. Reference Torrents, Schaedler, Jacobsen, Carter and Valdevit15,Reference Maloney, Roper, Jacobsen, Carter, Valdevit and Schaedler19 However, both recovery mechanisms are only observed for low relative density values.
Hierarchical polymer lattices produced from the same resist used in our study showed a remaining strain of ∼10–25% after compression to ≤50% strain, Reference Meza, Zelhofer, Clarke, Mateos, Kochmann and Greer3 which is in good agreement with the remaining strain values of our as-written tetrahedral structures [Fig. 6(e)] and also the polymeric structures with different types of architecture [Fig. 2(b)]. Here, values between 6 and 29% were found depending on the cycle number, the maximum strain values, and the type of architecture. The remaining strain values of the polymer structures were related to residual plastic deformation of buckled struts, Reference Meza, Zelhofer, Clarke, Mateos, Kochmann and Greer3 which is also in line with our observations of buckled ligaments in as-written tetrahedral structures, as discussed before. By contrast, the superior recovery of the annealed tetrahedral structures (with only 6% remaining strain after 20 cycles) is related to the rotation of ligaments around intact nodes after node fracture, which is also a locally induced elastic process, enabling pronounced recovery upon unloading.
The remaining strain of the alumina-coated structures is comparable and independent of the coating thickness. By contrast, a thickness effect was reported for polymeric microlattices with Zr–Ni–Al metallic glass coatings Reference Liontas and Greer32 and hollow metallic glass NiP microlattices Reference Rys, Valdevit, Schaedler, Jacobsen, Carter and Greer33 ; structures with thinner coating or wall thicknesses exhibited improved recovery than structures with thicker coatings. For the thinner wall or coating thickness, failure was initiated by node bending Reference Liontas and Greer32 or buckling followed by plastic deformation, Reference Rys, Valdevit, Schaedler, Jacobsen, Carter and Greer33 whereas the thicker coatings induced fracture events within the structures. Reference Liontas and Greer32,Reference Rys, Valdevit, Schaedler, Jacobsen, Carter and Greer33 Thus, the recovery of the thicker coated structures was mainly eliminated by catastrophic fracture events as seen for alumina-coated structures, both with 10- and 100-nm coating thickness, within our study. The described catastrophic failure is also the reason for the remaining high stiffness after two cycles. The intact part of the stiff structure is still compressed in every cycle experiencing only small changes upon loading and unloading, since deformation is localized in the already damaged part.
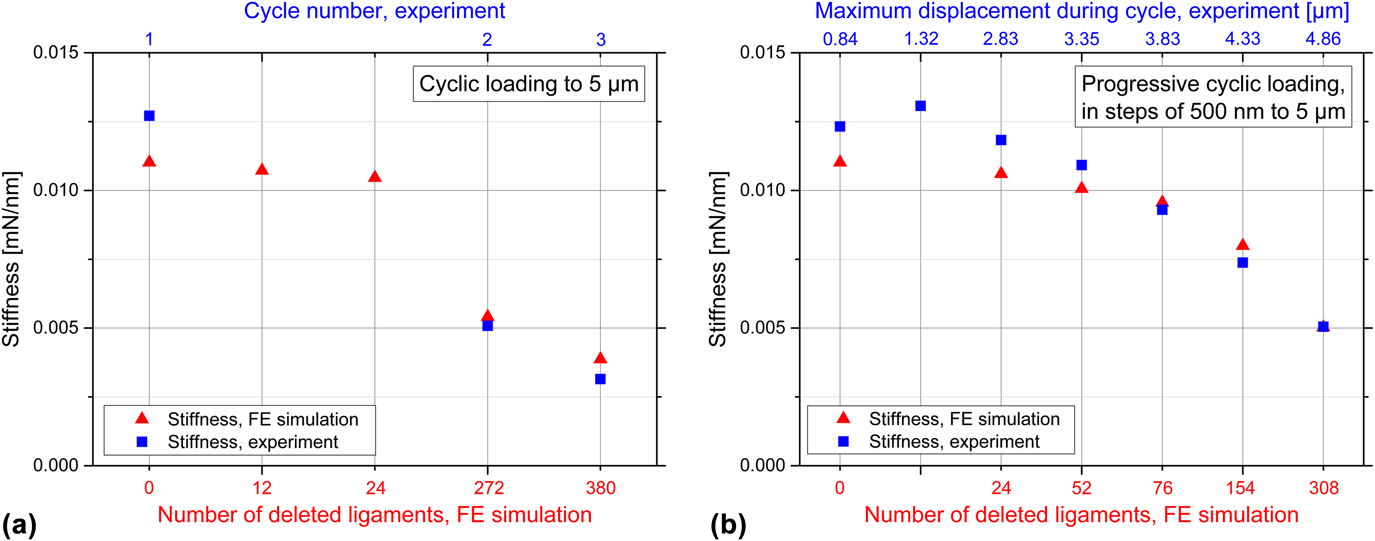
Figure 7(a) depicts the results of different FE simulations in comparison with the experimentally measured data of an annealed tetrahedral structure under cyclic loading. Here, the loading stiffness of the first three cycles of cyclic loading is compared with the calculated loading stiffness values of FE simulations with different numbers of deleted ligaments. Overall, a reasonably good agreement between the experimentally measured loading stiffness values and the FE simulations is observed. It is noted that plastic deformations within the structure cannot be accounted for in the simulations due to the applied linear-elastic material behavior. Figure S.9(a), of the Supplementary Material, depicts the corresponding experimentally measured load–displacement curves and simulated force values. Any deviation from linear-elastic behavior within these curves can only be related to geometrical nonlinearities, such as buckling of ligaments, not to plastic material behavior. This fact results in overestimated load values within the FE simulations, when buckling and plastic deformation occur while compressing the structures. However, within the linear-elastic regimes of the loading portions of experimentally measured load–displacement curves, it is possible to estimate the number of deleted ligaments due to the changing stiffness of the structures. The strongest decrease of specific dissipated energy during cyclic loading was observed from the first cycle to the second cycle as discussed above. This indicates that the most pronounced fracture occurs during this first cycle. This assumption is also confirmed by the FE simulations, since already from the first cycle to the second cycle, 272 ligaments need to be deleted to account for the decrease in stiffness. By contrast, from the second cycle to the third cycle, only 108 additional deleted ligaments are necessary to reach the reduced stiffness. With these calculations, it is also shown that the annealed tetrahedral structure is expected to be highly fractured already after the first two cycles: 272 deleted ligaments correspond to 37% of the vertical struts and 308 deleted ligaments correspond to 52%. In the case of only few deleted ligaments, i.e., 12 or 24, the stiffness of the microlattice is not yet strongly affected. Only the load values are reduced, in displacement ranges where geometrical and, thus, structural nonlinearities were observed, suggesting that buckling would occur already at lower load values [displacement >1700 nm, compare Fig. S.9(a) of the Supplementary Material]. Overall, the specification of the exact number of deleted ligaments is unlikely with these simple FE calculations, since plastic effects within the material are not accounted for and horizontal struts as well as nodes within the structure are still intact. However, an estimate can be made as well as the change from cycle to cycle can be analyzed.
Comparison of experimentally measured loading stiffness values from load–displacement curves for an annealed tetrahedral structure (blue rectangles) with the simulated loading stiffness values of FE simulations (red triangles). (a) Comparison of first three cycles of cyclic loading to a maximum displacement of 5 µm. (b) Comparison of selected cycles of progressive cyclic loading in steps of 500 nm to a maximum displacement of 5 µm. The decreasing stiffness of the structure from cycle to cycle (specified on the upper x-axis) as well as the decreasing stiffness with increasing number of deleted ligaments within the simulation (specified on the lower x-axis) can be seen. Due to symmetry reasons, only one half of the tetrahedral structure was simulated; however, the number of deleted ligaments stated on the lower x-axis of the graphs corresponds to the whole tetrahedral structure.

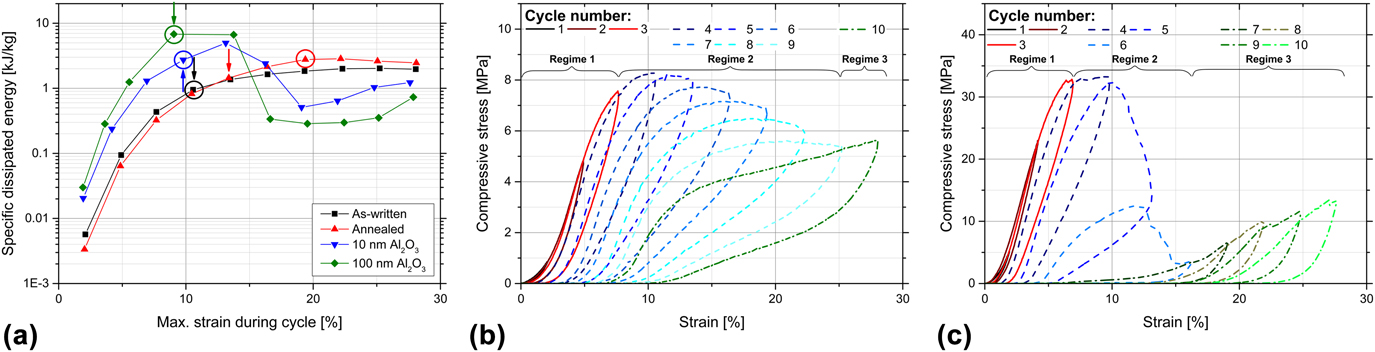
The performance of the structures during progressive cycling is depicted in Fig. 8, showing specific dissipated energy and stress over strain. In Fig. 8(a), the cycle, in which the maximum stress during compression testing is reached, is marked with an arrow for the different samples. The circle identifies the cycle in which the dissipated energy first exceeds the elastic energy. For low strain values, the specific dissipated energy increases for all processing conditions. For the Al2O3-coated samples, a steep decrease of the specific dissipated energy is observed for strain values >15%, which indicates the strain range of brittle fracture. Then, only low values of specific dissipated energy are reached with a slight increase due to localized compression. The polymeric samples show a more even distribution of specific dissipated energy, which increases until ∼20% strain is reached. For the as-written sample, a constant value of specific dissipated energy is observed beyond that point, while the annealed sample shows a slight decrease of specific dissipated energy. This indicates that in an already buckled or even fractured structure, less energy can be dissipated since irreversible events have already taken place. Moreover, as discussed earlier, for the annealed sample, a more pronounced decrease of stress is observed after reaching the compressive strength [compare Fig. 4(a)] as well as a stronger stiffness decrease after the onset of node fracture [Fig. 6(f)]. The coated samples as well as the as-written structure reach the compressive strength during the same cycle as the dissipated energy exceeds the elastic one, indicating that after the onset of brittle fracture or buckling of the ligaments, only little elastic recovery is achieved. By contrast, for the annealed structure, the dissipated energy exceeds the elastic energy only two cycles after reaching the compressive strength, which is a result of the pronounced elastic recovery of the structure. Overall, the superior behavior of the annealed tetrahedral structure is attributed to a set of features. First, the highest strain value at compressive strength is reached although stiffness and strength exceed the values of the as-written structure. Second, the elastic energy is still higher than the dissipated energy after reaching the compressive strength, which is a result of the pronounced recovery upon unloading. And third, the annealed structure dissipates the highest amount of energy for higher strain values.
(a) Specific dissipated energy as a function of the maximum strain during individual cycles of progressive cycling for tetrahedral structures in the as-written state, annealed, and with 10- and 100-nm Al2O3 coating: The cycles, in which the maximum stress value is reached, are marked with arrows. The cycles, in which the dissipated energy first exceeds the elastic energy, are marked with circles. (b and c) Individual cycles of progressive loading: The cycles before the maximum stress—regime 1—is reached are indicated by continuous red lines. The following cycles are marked with dashed blue lines—regime 2—until localized compression occurs. The cycles with localized compression—regime 3—are shown as dashed-dotted green lines. (b) As-written structure and (c) structure with 10-nm alumina coating.

D. Energy dissipation mechanisms
Different mechanisms contribute to the energy dissipation during compression of the structures. The contribution of irreversible effects, i.e., fracture events and plastic deformation, can be identified by the difference between the initial energy dissipation and the constant plateau value for higher cycle numbers. Reference Salari-Sharif, Schaedler and Valdevit14 Thus, for the structures studied here, a high amount of energy is dissipated due to these irreversible effects, especially during the first cycle; the specific dissipated energy shows the strongest decrease from cycle 1 to cycle 2 for all microarchitectures and processing conditions. The highest amount of dissipated energy due to fracture and plastic deformation during the first loading cycle results from the chosen maximum strain value, exceeding the strain value of the onset of buckling and fracture within the structures. This behavior was also confirmed by FE simulations for an annealed tetrahedral structure [presented in Sec. III.C and Fig. 7(a)], which yielded the largest number of fractured nodes after cycle 1 to match the stiffness during cycle 2. However, in particular, the honeycomb structure exhibits a continuous reduction of the specific dissipated energy [Fig. 2(a)], indicating that energy is dissipated due to fracture and plastic deformation in all 20 cycles. The other structures show a more constant specific dissipated energy for higher cycle numbers, indicating that also other mechanisms are more relevant for energy dissipation. Fracture events and plastic deformation are major contributors in the alumina-coated tetrahedral structures and the as-written structures, respectively. As shown in Fig. 3, the as-written structures exhibit local and global buckling not only after 20 cycles but also after the first one.
Additional mechanisms for energy dissipation, which might play a role for the structures tested, are elastic buckling of ligaments, macroscale friction between ligaments, microscale friction within microcracks, and intrinsic material damping. To some extent, a contribution from elastic buckling can be expected for all structures and material combinations, but it is expected to play a greater role for the polymer structures [Figs. 3, 5(a), 5(b), 5(e), and 5(f)], as also observed during in situ testing (Videos S.1–S.4 of the Supplementary Material).
Macroscale friction occurs between individual ligaments that come into contact and get entangled during localized compression at higher strain values. As discussed in Sec. III.C, already during the first cycle, localized compression occurs for the annealed and the alumina-coated tetrahedral structures, which is then accompanied by macroscale friction between the individual ligaments in contact. For the coated tetrahedral structures, macroscale friction is expected to be the major contributor to energy dissipation from the second cycle onwards, since pronounced further fracture of the structure is not observed in the following loading cycles [Figs. 5(c), 5(d), 5(g), and 5(h)]. However, as a consequence of the catastrophic fracture during the first cycle, the occurring macroscale friction cannot be related to the structural response of the lattice but only to a response of the already fractured parts. For the as-written polymeric structures, macroscale friction also contributes to the energy dissipation mainly through the buckled ligaments but also the ligaments after nodal fracture coming into contact.
Microcracks are likely to be present within the structures causing microscale friction between adjacent fracture surfaces. Since the alumina-coated structures fail rather catastrophically during the first cycle, the contribution through microcracks might be negligible, though. This is different for the polymeric structures, in which microcracks might be present in both the buckled ligaments and the partially fractured nodes. However, in this study, the role of microcracks was not analyzed in detail.
In general, the intrinsic damping capabilities of ceramic materials are low, while they are higher for polymeric materials, especially elastomers. However, since IP-Dip is an epoxy-based polymer, the extent of intrinsic material damping is limited. Reference Ashby29 The intrinsic material damping in polymers is based on the sliding of chain segments against each other. Reference Ashby29 Annealing is expected to increase the number of crosslinks within the polymer, Reference Schroer, Bauer, Schwaiger and Kraft20 and thus, chain sliding is hindered, which therefore reduces the intrinsic material damping. Due to the presumably fewer crosslinks within the as-written samples, the contribution of intrinsic material damping is likely higher than in the further processed structures. As a consequence of the low material damping within the ceramic alumina coating in combination with the unavoidable annealing treatment during ALD coating at 130 °C, the intrinsic material damping in the coated structures is expected to play only a minor role for energy dissipation.
Figures 8(b) and 8(c) depict the stress–strain curves of individual cycles of the as-written tetrahedral structure and the 10-nm alumina-coated structure during progressive cycling, respectively. For the as-written sample, the maximum stress is reached in loading cycle 4 at approximately 10.5% strain. The previous loading cycles 1–3 (regime 1) are shown as continuous red lines and the subsequent cycles 4–9 (regime 2) are shown as dashed blue lines. Cycle 10, in which compression started to localize (regime 3), is shown as a dashed-dotted green line. For the 10-nm alumina-coated structure, the assignment to the three regimes is different: cycles 1–3 contribute to regime 1, cycles 4–6 to regime 2, and cycles 7–10 to regime 3, which shows a more pronounced contribution of cycles to regime 3 due to the catastrophic fracture of the coated structure. By analyzing the specific dissipated energy during these three different regimes, a rough estimate of the contributions from the different mechanisms can be made. The different contributions of the specific dissipated energy are listed in Supplementary Material Table S.3. It is noted that during progressive cycling, the as-written tetrahedral structure also showed a second increase of stress due to localized compression during the last cycle, admittedly rather weak. But this is in contrast to the deformation behavior during one loading cycle to the same maximum strain, which did not show localized compression [Fig. 4(a)].
The specific dissipated energy in total is higher during progressive cycling than the amount of specific energy dissipated during one loading cycle to the same maximum strain [Fig. 6(a)]. Also, the differences for the different processing conditions are smaller for progressive cycling. The highest value is 17.0 kJ/kg for the 100-nm Al2O3-coated sample, and the lowest one is 12.3 kJ/kg for the as-written sample, which results in a ratio of 1.4. By contrast, for one cycle of loading [Fig. 6(a)], the highest value is 12.6 kJ/kg and the lowest one is 5.1 kJ/kg (for the same type of structures), which results in a ratio of 2.5. For the annealed samples, the total amount of specific dissipated energy during progressive cycling is even higher than that of the 10-nm Al2O3-coated sample, which is the other way around when only one loading cycle is performed. This behavior indicates that the annealed tetrahedral structures are tougher and that during progressive cycling more energy can be dissipated at lower strain values due to reversible events. However, this behavior also indicates that the contributions of the different mechanisms might be different during cyclic testing to a fixed strain since the energy dissipation depends on the applied strain.
The different amounts of specific dissipated energy during cyclic and progressive cyclic loading can also be explained by the FE simulations. In Fig. 7(b), the loading stiffness values of individual cycles of progressive cyclic loading are compared with the calculated stiffness values resulting from FE simulations with different numbers of deleted ligaments. It is observed that fracture events occur with every further cycle and, thus, with increasing maximum displacement (specified on the upper x-axis of the graph). Figure S.9(b), of the Supplementary Material, depicts the corresponding experimentally measured load–displacement curves and simulated force values. After 10 cycles of progressive cyclic loading (i.e., ∼5 µm maximum displacement), it is likely that more ligaments are fractured than after one cycle of cyclic loading. A maximum number of 308 deleted ligaments were found for progressive cyclic loading during cycle 10 [Fig. 7(b)], which corresponds to 42% of the vertical struts. By contrast, during the second cycle of cyclic loading [Fig. 7(a)], only 272 ligaments were deleted to account for the decrease in stiffness. This might explain the higher specific dissipated energy observed during progressive cyclic loading in comparison with the first cycle of cyclic loading.
Microscale friction and intrinsic material damping are expected to dominate mainly at low strains, at which buckling of ligaments as well as fracture and plasticity are eliminated. Reference Salari-Sharif, Schaedler and Valdevit14 These two mechanisms are the main contributors to the energy dissipation in regime 1. However, some elastic buckling might also occur before the maximum stress value is reached. The specific dissipated energy in regime 2 is mainly related to fracture, plastic deformation, and elastic buckling of the ligaments. In regime 3, when localized compression is initiated, the energy dissipation is mainly related to macroscale friction especially for the coated samples. Plastic deformation may still contribute to the energy dissipation in this final regime, in particular, in the case of the polymeric samples with typically fewer fractured ligaments or nodes.
As expected, the highest amount of energy for all tetrahedral structures is dissipated in regime 2 (Table S.3 of the Supplementary Material) due to fracture, plastic deformation, and elastic buckling amounting to 67–80% of the total specific dissipated energy. The lowest amount of energy is dissipated during regime 1, which is not only related to microscale friction and intrinsic material damping but also, to some extent, related to elastic buckling. In regime 3, also the polymeric samples show a relatively high amount of specific dissipated energy although only one loading cycle was performed in regime 3, i.e., cycle 10, in contrast to the coated samples with at least four contributing cycles. This behavior can be rationalized by the different mechanisms, i.e., higher elastic recovery and plastic deformation of the polymeric structures in regime 3 versus the fracture events, which in combination with macroscale friction, are the main mechanisms in the alumina-coated samples. This difference can also be seen in the stress–strain curves of the cycles in regime 3: the stress–strain curves of the polymeric samples exhibit strain hardening [Fig. 8(b) and Supplementary Material Fig. S.7(a)], whereas the curves of the coated samples reflect localized compression for strains ≥10% [Fig. 8(c) and Supplementary Material Fig. S.7(b)]. A more quantitative comparison of the processing conditions on the energy dissipation in the different deformation regimes is difficult, though, since every cycle is assigned to only one regime, although it might also contribute to another one. Overall, the energy dissipation due to microscale friction and intrinsic material damping appears lower in our polymer and ceramic-polymer composite structures compared with hollow nickel microlattices, Reference Salari-Sharif, Schaedler and Valdevit14 for which a fraction of 17% was determined. Furthermore, the contribution of fracture events and plastic deformation appears higher in comparison with 19% reported for hollow nickel microlattices. Reference Salari-Sharif, Schaedler and Valdevit14
IV. CONCLUSION
Polymer and ceramic-polymer composite microlattices were analyzed under cyclic loading to examine and understand the contributing mechanisms to their deformation behavior and energy dissipation. The effect of the microarchitecture and the processing conditions, i.e., different material properties, was investigated. Displacement-controlled compression experiments were conducted to obtain detailed information regarding the relevant mechanisms. All experiments were carried out in situ in the SEM to gain further insights about the deformation behavior of the microlattices during the compression experiments. For polymeric structures, no catastrophic failure was observed, instead distinct buckling during compression and pronounced recovery upon unloading occurred. Overall, the honeycomb structures show the highest amount of specific dissipated energy during cyclic compression loading due to their high strength. However, for larger cycle numbers, a stretching-dominated microarchitecture is the crucial factor for a more constant amount of dissipated energy during cycling and an enhanced recoverability. The stretching-dominated polymeric tetrahedral structures exhibit superior properties after an annealing treatment at 200 °C for 15 min. In these structures, pronounced recoverability was observed in combination with the highest amount of specific dissipated energy and the highest loss coefficients during cyclic loading. In addition to the stretching-dominated microarchitecture, there are additional contributing factors: the higher Young’s modulus and strength of IP-Dip due to the annealing treatment, in combination with a ductile and tough behavior as reported in Ref. Reference Schroer, Bauer, Schwaiger and Kraft20, and the ability of fractured ligaments to rotate around intact nodes during compression.
Within alumina-coated structures, the main contributing mechanisms for energy dissipation are fracture (during the first loading cycle) and macroscale friction upon further cycling: the only significant amount of specific energy is dissipated during the first cycle. For all polymeric structures, the energy is mainly dissipated by elastic buckling, plastic deformation, and fracture events with a smooth decrease from cycle to cycle, providing superior behavior for larger cycle numbers.
As indicated by our FE simulations, it should be possible to adjust the stiffness of microlattices by adjusting the number of ligaments within the lattice. To also tailor the microlattices for their energy dissipation capability, one could include specific frictional elements into the microarchitecture. The capability of repeated energy absorption should then be improved, due to a stronger frictional contribution to the energy dissipation in comparison with irreversible effects due to fracture. However, extended cyclic compression tests would be necessary to verify this statement.
Supplementary Material
To view supplementary material for this article, please visit https://doi.org/10.1557/jmr.2017.485.
ACKNOWLEDGMENTS
We would like to thank the Karlsruhe Nano Micro Facility (KNMF, http://www.knmf.kit.edu) of the Karlsruhe Institute of Technology (KIT) for access to the helium ion microscope at their laboratories and Ben Breitung [Institute of Nanotechnology (INT), Karlsruhe Institute of Technology (KIT)] for the ALD coating of the structures. The work of A.S. and R.S. was supported by the Robert Bosch Foundation.