1. INTRODUCTION
The fast adoption of Inertial Navigation Sensors (INSs) into many products comes with a wide range of performance grades of INS. Consumer grade INSs are at the low-end of both performance and cost, and as such are suitable for applications such as video game controllers and smartphones. Applications such as navigation systems demand industrial-grade performance and they are much more expensive. The key factor to superior performance is their better gyro bias stability, which indicates how stable the bias of a gyro is over a certain specified period. The lower the bias stability the lower the errors will be when integrating the gyro output to estimate the heading angles.
On the other side, consumer-grade INSs have greater bias stability and generally are not suitable for navigation purposes. The poor orientation estimated from these gyros contains drift that results in errors in the navigation in two ways (Vincent, Reference Vincent2013). First, orientations (pitch, roll and yaw) are used to separate accelerations from gravitational acceleration. The poor estimates of orientation cause the acceleration estimations to be erroneous and upon double integration result in errors in the magnitude of the actual movement. Second, the tracking will go in the wrong direction due to inaccurate orientation estimation. High bias stability could be related to several causes such as manufacturing defects and angular random walk.
Consumer-grade INSs offer low-cost and small platform navigation solutions, such as the foot-mounted INS (Gu et al., Reference Gu, Song, Li and Ma2014). It has been demonstrated that position drift can be minimised in foot-mounted INS by applying Zero-velocity Update (ZUPT). The detected stance phase instinctively produces zero velocity that can be used as a reference to reset the position drift. In contrast, the heading drift has not been well solved as the heading error is unobservable in the Kalman-based navigation framework (Abdulrahim et al., Reference Abdulrahim, Hide, Moore and Hill2011). Some have resorted to use geomagnetic information from a magnetometer (Kim and Kong, Reference Kim and Kong2016) but the information is susceptible to magnetic disturbance under certain operational conditions.
To minimise the negative effects of heading drift in indoor navigation, researchers have proposed to use a corridor's direction as constraints. For instance, the authors in Borenstein and Ojeda (Reference Borenstein and Ojeda2010) stressed that most indoor corridors are in four major directions (named dominant directions), either parallel or orthogonal to each other and to the peripheral walls of the building. They have developed a Heuristic Drift Elimination (HDE) algorithm that corrects the computed heading to match with the closest dominant direction. The algorithm is based on a feedback control system and works well for short stretches of walking in non-dominant directions. However, a longer walk (30 to 60 s) in non-dominant directions will cause the algorithm to overcorrect the headings, and leads to wrong positions. To resolve the problem, an adaptive gain function is introduced where one or more attenuators are multiplied with the gain in every iteration. The attenuators would suspend the HDE algorithm from correcting the heading if walks along non-dominant directions are detected.
Still, the heading drift is present in a prolonged walk in the non-dominant directions, as reported by Jiménez et al. (Reference Jiménez, Seco, Zampella, Prieto and Guevara2011). These authors showed the position error from HDE by using a circular path as an example. In addition, HDE fails to determine the correct position when the pedestrian walks in a straight line which is not aligned with the dominant directions. To solve these problems, the authors proposed an improved HDE method (iHDE). iHDE still uses dominant directions to correct the heading but also incorporates movement analysis and a confidence estimator to estimate the heading error as well as the confidence level of that estimation. Their tracking results, particularly for circular paths, indicate better performance than the HDE. Nonetheless, our in-house experiments used to replicate the method indicate that the given thresholds (i.e. step size attenuator's threshold) are not robust. In many occasions, walking along circular paths is detected as a straight walk.
Moreover, researchers in Ju et al. (Reference Ju, Lee, Park, Lee and Park2014) claimed that iHDE performance suffers when the pedestrian is not walking along the dominant directions for a long time. They proposed an Advanced HDE (AHDE) that will classify the motion of a pedestrian into three types; non-straight motion, straight motion and straight motion along the dominant directions. The AHDE algorithm is based on linear regression that fits a straight line to a six-position data set. A residual function D, the sum of the squares of the perpendicular offsets, is computed and used to determine the first two types of motions. If the value of D is higher than the pre-determined threshold, Th D , the motion is considered as non-straight if not, it is considered as straight. If the motion is straight, and the difference with respect to the dominant direction is smaller than another pre-determined threshold, Thθ, then the motion is a straight motion along the dominant directions. However, since six pedestrian's steps are required to start the process, the algorithm lags in classifying the motion. The lag that causes the short stretches of non-dominant directions will not be detected.
The choice of inertial sensors greatly influences the performance of pedestrian tracking. High-end consumer-grade INS have better specifications and cost hundreds of dollars. Some of them such as the one from XSens Inc. used by Jiménez et al. (Reference Jiménez, Seco, Zampella, Prieto and Guevara2011), are equipped with an Attitude Heading Reference System (AHRS) which has a performance almost on a par with high-grade INSs. The low-cost inertial sensors, on the other hand, experience more drifts and noise that affect the tracking performance.
To mitigate these issues, we propose a novel threshold-less turn detection method that is robust for different groups of people and operational conditions, and uses low-cost INS. The new method is based on the relationship between pelvic rotation and ZUPT, and we call this Pelvic Rotation-ZUPT Turn Detection (PZTD). In addition, the proposed method is also able to determine the direction of the turn, made by the pedestrian, with fewer pedestrian steps.
The second contribution is the application of PZTD to correct the heading angles derived from a waist-worn INS. The proposed filtering method can differentiate a straight walk that is along the dominant or non-dominant directions. The new filtering produces more accurate heading angles compared to the un-filtered version.
The rest of this paper is organised as follows: Section 2 introduces the pelvic rotation and establishes the relationship between pelvic rotation and ZUPT. Section 3 analyses the relationship statistically. Section 4 presents the methodologies to detect turns and to correct the heading. Section 5 reports the experimental results from experiments performed. Finally, Section 6 presents the conclusions.
2. PELVIC ROTATION AND ZUPT
Saunders et al. (Reference Saunders, Inman and Eberhart1953) proposed that pelvic rotation reduces the vertical movements of the body's Centre Of Mass (COM), thus saving energy. This is based on the premise that the COM displacements are costly in terms of used energy. However, other studies suggested the contribution of pelvis rotations in reducing vertical displacement is either negligible or at least far less than previously thought (Kuo, Reference Kuo2007; Lin et al., Reference Lin, Gfoehler and Pandy2014).
A study in Borhani et al. (Reference Borhani, McGregor and Bull2013) on pelvic kinematics in gait discovered that the mean of maximum pelvic rotation from thirty participants is up to 6°. Other studies, (Bruijn et al., Reference Bruijn, Meijer, Van Dieen, Kingma and Lamoth2008; Liang et al., Reference Liang, Wu, Meijer, Lin, Lv, Lin, Prins, Hu, Van Dieën and Bruijn2014) indicated that the maximum pelvic rotations in normal walks with speed between 3–4 km/h are around 6° and 10°, respectively.
Usually, the pelvic rotation is measured using vision systems that locate markers attached to the waist (Zhang et al., Reference Zhang, Huang, Wang, Xu, Ma, Liu and Yu2013; Borhani et al., Reference Borhani, McGregor and Bull2013). In recent approaches, inertial sensors have been used to estimate the pelvis kinematics as an alternative to vision systems (Floor-Westerdijk et al., Reference Floor-Westerdijk, Schepers, Veltink, van Asseldonk and Buurke2012; Bugane et al., Reference Bugane, Benedetti, D'Angeli and Leardini2014). An inertial sensor has been placed at the sacrum as opposed to the markers and the results show that the devices are a reliable alternative.
In Zhang et al. (Reference Zhang, Huang, Wang, Xu, Ma, Liu and Yu2013), it is noted that the rotation angle is periodic when a person is walking quickly in a straight line. Another conclusion drawn is that the trajectory of the waist joint is like a sinusoidal signal. In Pavčič et al. (Reference Pavčič, Matjaèiæ and Olenšek2014), it is reported that during turning, the pelvis and torso orientations should follow the direction of the turn. From these, we can conclude that the pelvic rotation angle is sinusoidal when walking in a straight line, but the angle follows the direction of turn when turning.
Unlike self-resetting techniques used to reduce error accumulation in distance estimation such as in Akeila et al. (Reference Akeila, Salcic and Swain2014), most foot-mounted inertial navigation systems rely on zero-velocity update, or ZUPT, to reduce third-order polynomial error to a linear error. Since pelvic rotation angle and the ZUPT state can be determined through the gait cycle, this work has found an interesting relationship between the two parameters.
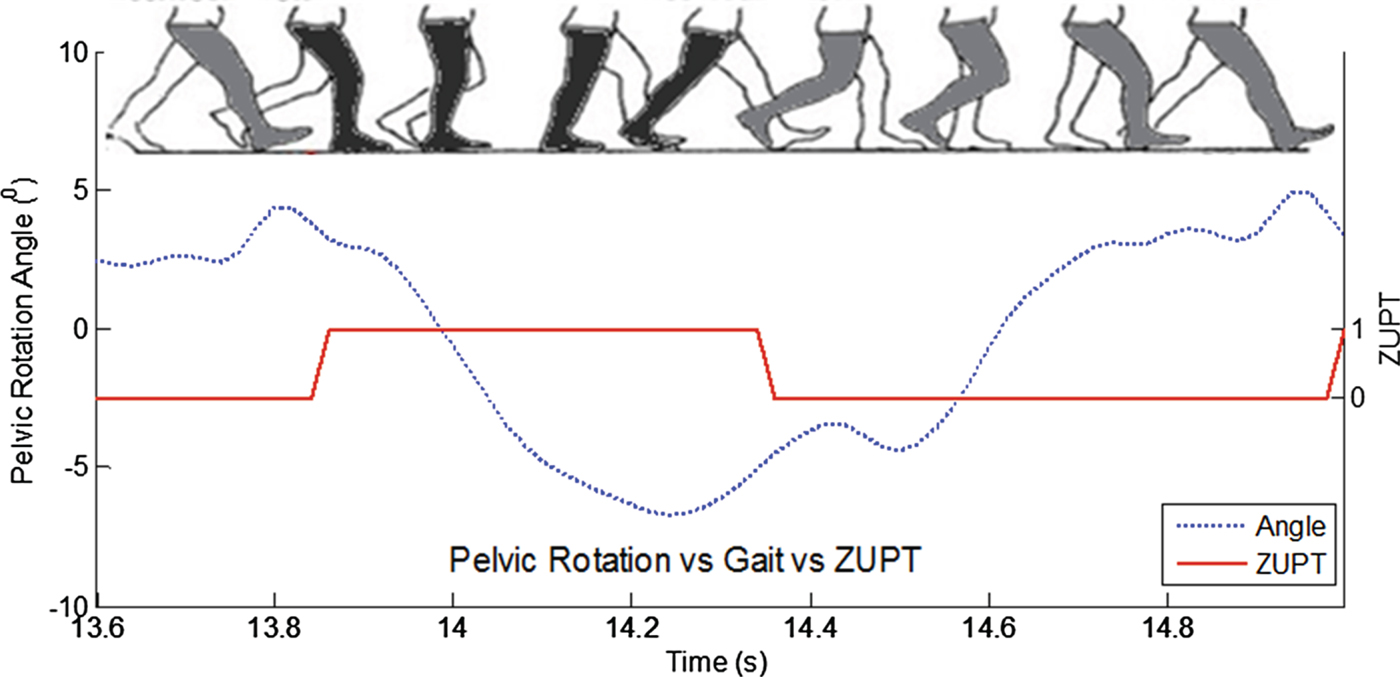
Trials were done with an INS node attached to the right side of the waist of a healthy pedestrian to measure the yaw angle (pelvic rotation). Another INS node was attached to the right foot to compute the ZUPT. The setup and technique to compute the ZUPT are described in Muhammad et al. (Reference Muhammad, Salcic and Wang2015). The pedestrian was asked to walk along a corridor that consisted of a straight path and sharp corners. The computed pelvic rotation and ZUPT are plotted together as shown in Figure 1. The plot indicates a complete gait cycle from the right foot during a straight walk. The dashed curve represents the pelvic rotation as measured by the INS and the solid curve represents the ZUPT. As observed, the polarity of the pelvic rotation angle changes from positive to negative in the stance phase and vice-versa in the swing phase.
The pelvic rotation angle vs ZUPT during a straight walk.

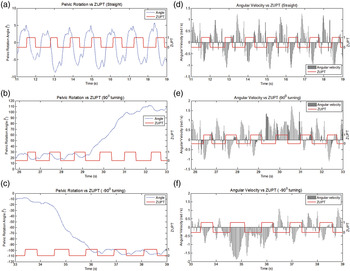
The angular velocity recorded for the straight walk is plotted together with the ZUPT signal as shown in Figure 2 (right column). In the straight walk, the angular velocities spread oppositely in the stance and swing phases. The results of the integral of the angular velocity that produce the angles of pelvic rotation are shown in the left column.
The pelvic rotation vs ZUPT during straight walk (a), left turn (b) and right turn (c). The angular velocity vs ZUPT measured during straight walk (d), left turn (e) and right turn (f).

When the pedestrian turned to the left, the angular velocities spread consistently to the positive side (Figure 2(c), t = 29 s to 31 s). On the other hand, when the pedestrian turns to the right, the angular velocities stay to the negative side (Figure 2(f), t = 34·2 s and 36·1 s).
Another important component to establish the relationship is the ZUPT. Our developed technique to detect the ZUPT is based on a subtractive clustering algorithm (Muhammad et al., Reference Muhammad, Salcic and Wang2014). The algorithm clusters all stationary vertical accelerations measured from the foot-mounted INS as stance periods. This technique has been compared with other ZUPT algorithms and achieves an outstanding accuracy.
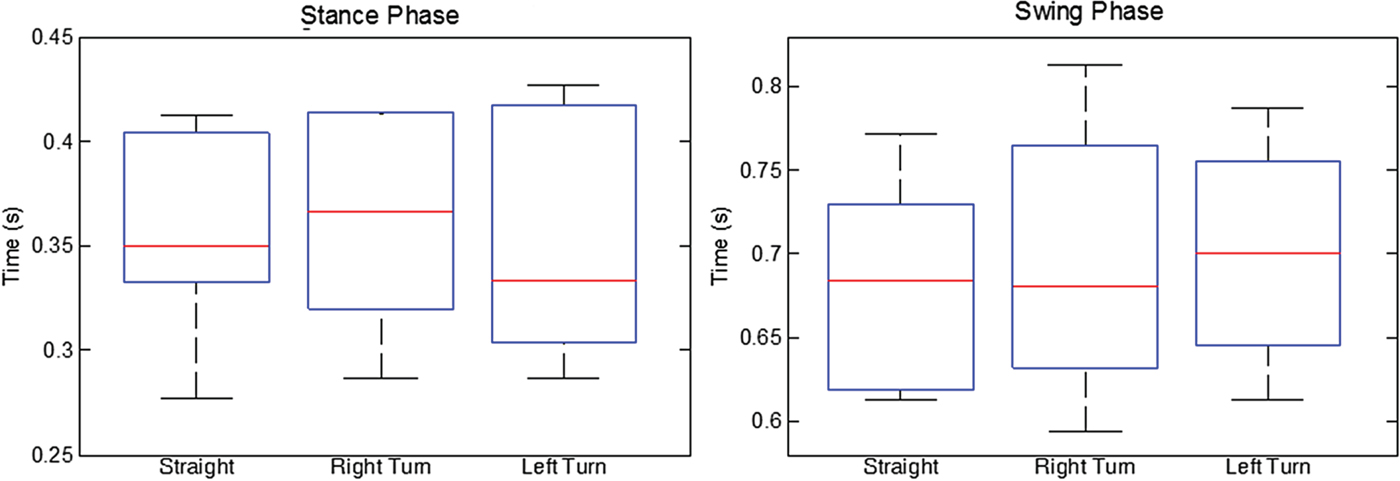
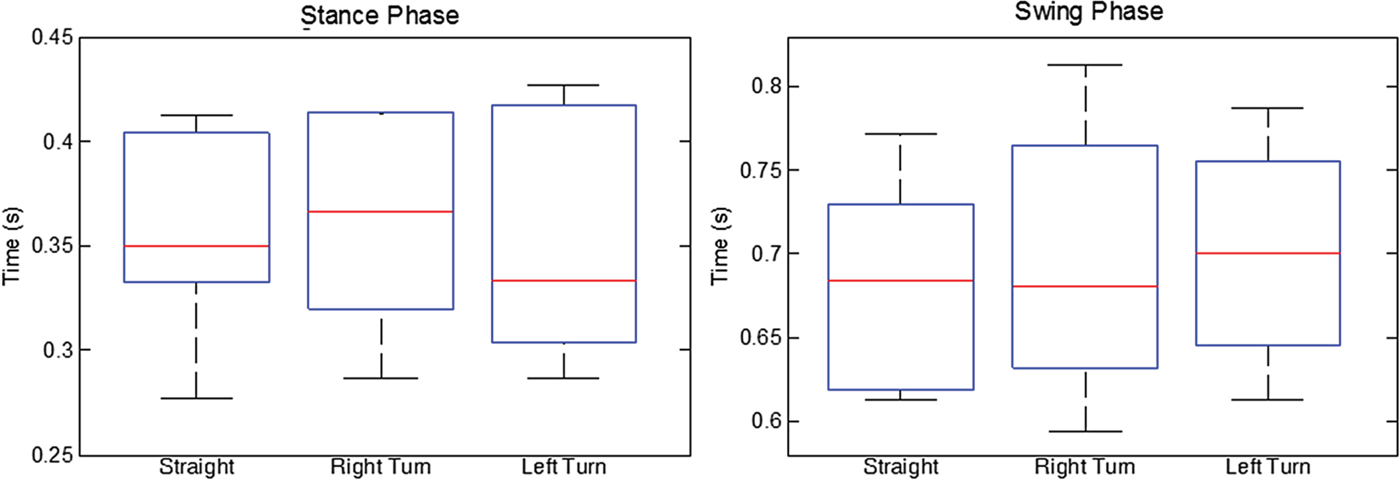
The characteristics of the detected stance and swing phases have been analysed and the distributions of average time of swing and stance phases are depicted in Figure 3. The data is collected from nine healthy pedestrians who walked 20 steps in a straight path. The average time of stance phases and swing phases of all pedestrians are recorded based on the computed ZUPT. Meanwhile, three steps are recorded at every right or left (90° directional change) turn. The study presented in Ilyas et al. (Reference Ilyas, Cho, Baeg and Park2016) reported that three steps are sufficient to execute direction change. Herewith, the average time is computed from the three steps that comprise three swing and three stance phases.
(Left) Distribution of average time of stance phase. The medians are 0·35 s, 0·37 s and 0·33 s for straight, right turn and left turn, respectively. (Right) Distribution of average time of swing phase. The medians are 0·68 s, 0·68 s and 0·70 s for straight, right turn and left turn, respectively.
3. PELVIC ROTATION-ZUPT RELATIONSHIP ANALYSIS
To determine whether there is a significant association between the pelvic rotation and ZUPT, the data gathered from nine pedestrians was analysed. An association test called Pearson's chi-square (or simply the chi-square) is used to test whether the two variables were independent of each other (Schumacker and Tomek, Reference Schumacker and Tomek2013; McHugh, Reference McHugh2013). The test will determine which of the following hypotheses holds true:
Null hypothesis: The walking direction and polarity of the sum of angular velocity are independent.
Alternative hypothesis: The walking direction and polarity of the sum of angular velocity are dependent.
If the null hypothesis is accepted from the test result, then there is no concrete relationship between pelvic rotation and walking direction. On the other hand, if the null hypothesis is rejected, then the relationship is established. The significant level or cut-off value to test whether to accept or reject the null hypothesis is set as 0·05, widely used in most chi-square test literature (Schumacker and Tomek, Reference Schumacker and Tomek2013; Michael, Reference Michael2001). The significant level is the probability of failing to accept the null hypothesis when it is indeed true (Type I error).
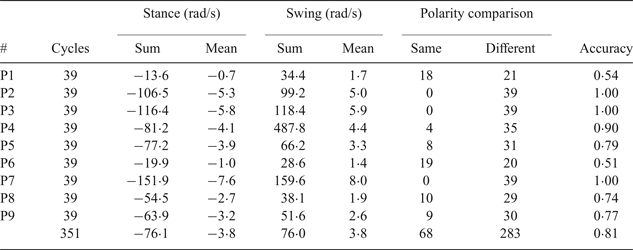
Table 1 summarises the polarity comparison for a straight path. Two consecutive gait phases, swing phase to stance phase or vice versa, is called a cycle. Therefore, for 20 steps walking in a straight path, there will be 39 cycles. For every cycle, the polarity of the summation of the angular velocities for each gait phase was determined. Polarities for consecutive gait phases were categorised as having same polarities (both positive or both negative) or different polarities (positive and negative) and the occurrence of each case was counted. Technically, the occurrence can be formulated using the XNOR logic as follows:
 $$state = \displaystyle{{{sum}_{p1}}\over{abs({sum}_{p1})}}{\ast}\displaystyle{{{sum}_{p2}}\over{abs({sum}_{p2})}} +\displaystyle{{\overline{{sum}_{p1}}}\over{abs({sum}_{p1})}}{\ast}\displaystyle{{\overline{{sum}_{p2}}}\over{abs({sum}_{p2})}}$$
where state produces −1 (different) or 1 (same), sum p1 is the sum of angular velocities in the first gait phase and sum p2 is the sum of angular velocities in the second phase. The table also shows the sums and means of the angular velocities.
Analysis of the pelvic rotation's angular velocities for straight path.

The average accuracy of getting different polarities is about 81%. The means of pelvic rotation angles in stance and swing phases are close to each other for each of the pedestrians, thereby confirming the first findings that the rotation angle is periodic when walking in a straight path.
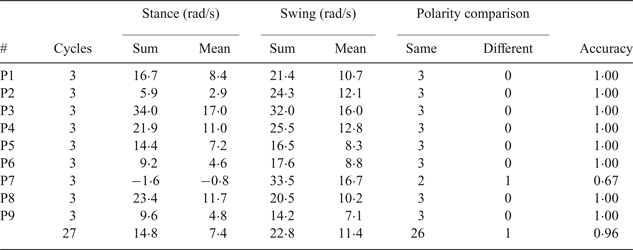
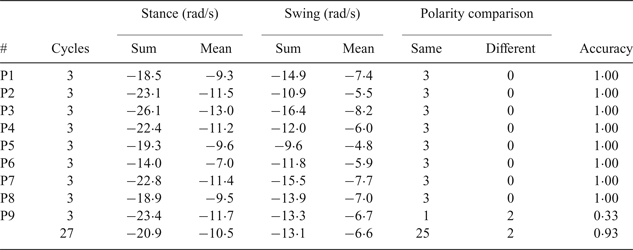
Table 2 and Table 3 summarise the counts of polarity comparison for the pedestrians when they turned to the left and right, respectively. The numbers of cycles are set to three. In-house analysis indicates that three cycles have the best accuracy. The average accuracies of getting the same polarity are 96% and 93% for left turn and right turn, respectively.
Analysis of the pelvic rotation's angular velocities for left turn.

Analysis of the pelvic rotation's angular velocities for right turn.

In Table 2, the mean for the swing phase is larger than the mean for the stance phase, which is due to the fact that the right foot makes a longer step when the person turns to the left as compared with the left foot. This causes the pelvis to rotate more in the swing phase. Similarly, in Table 3, the mean for the stance phase is larger than the mean for the swing phase because the left foot makes a longer step when the person turns to the right as compared to the right foot. Thus, the right pelvic rotation is smaller during the swing phase.
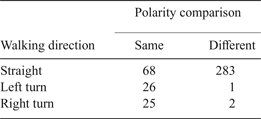
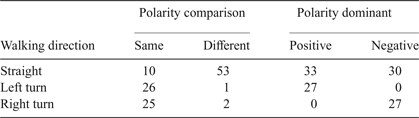
By identifying the relationship between the pelvic rotation and walking directions based on the underlying hypotheses, Table 4 has been prepared. The number of counts for the same and different polarities were cross-tabulated against the walking directions. The four assumptions to apply chi-square analysis as described in Michael (Reference Michael2001) are met: 1) the sample is not biased, 2) independent observations where sampling of one observation does not affect the choice of the second observation, 3) no categories overlap and include all observations and 4) large expected frequency.
Joint frequency distribution between polarity comparison and walking direction.

The first step in computing the chi-square is to compute the expected frequency for each cell in Table 4 by using the following equation:
 $$E_{ij}=\displaystyle{{T_{i} \times T_{j}}\over{N}}$$
where E ij is the expected frequency for the cell in the ith row and the jth column, T i is the total number of counts in the ith row, T j is the total number of counts in the jth column and N is the total number of counts in the table.
The next step is to calculate the chi-square using the following equation:
 $${X}^{2}_{ij} = \displaystyle{{O_{ij} - E_{ij}}\over{E_{ij}}}$$
where
 ${X}^{{2}}_{ij}$
, E
ij
and O
ij
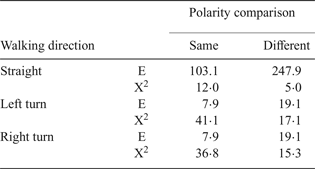
are the chi-square, expected frequency and observed frequency for the cell in the ith row and the jth column, respectively. The calculated expected frequency and chi-square for each cell are shown in Table 5. In the fourth assumption, the cell expected requirements of the chi-square could be verified by checking the expected frequency in each cell. To meet the requirement, 80% (0·8*6 cells ≈ 5 cells) of the cells must have an expected value of five or more. This table meets the requirement that all the cells have an expected frequency of more than five.
The calculated expected frequency and chi-square.

The sum of the calculated chi-square is 127·2 and the number of Degrees of Freedom (DoF) is two. The P-value is obtained from executing the MATLAB function chi2cdf by inputting the sum of chi-square and degree of freedom. The result shows the P-value is smaller than 0·00001. As the P-value of the chi-square table is less than 0·05, the null hypothesis is rejected and the alternate hypothesis is accepted. Lastly, the strength of the relationship between polarity and walking direction is measured using Cramer's V formula:
 $$\hbox{V}= \sqrt{\displaystyle{{X^2}\over{\hbox{N}\times \min (\hbox{r}-1,\hbox{c}-1)}}}$$
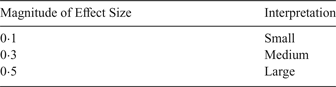
where r is the total number of rows, c is the total number of columns and N is the total number of counts. The calculation gives Cramer's V equal to 0·56 which should be viewed as a large effect by following the guidelines shown in Table 6.
Effect size for Cramer's V based on Cohen's guidelines (Cohen, Reference Cohen1988) of one DoF.

The large effect implies that the polarity comparison is a significant factor in determining in which direction a pedestrian walked, i.e. there is a strong relationship between the pelvic rotation and ZUPT that can be used to classify the walking direction.
4. PROPOSED METHOD
4.1. Turn Detection Algorithm
The classification of walking directions is based on the naïve Bayes method using the information of joint frequency distribution as shown in Table 4. However, the single attribute referred to so far, polarity comparison, is insufficient to classify a left or right turn. Therefore, another attribute, polarity dominant, is introduced. Polarity dominant classifies a cycle as positive if the sum of angular velocities in the cycle is positive and as a negative if the sum is negative.
The total counts for each attribute from all the pedestrians are presented in Table 7. The values presented are the total counts from all the pedestrians for each of the attributes. Note that the total count for straight walk has been changed from 351 (39 cycles × 9 pedestrians) to 63 (7 cycles × 9 pedestrians). The reason is the previous total counts caused bias to the detection algorithm, which inclines to misclassify turns as straights.
The Distribution of Counts in Different Attributes to Represent Varying Walking Direction.

The turn detector algorithm needs to classify the three cycles into one of the three classes: cj = {straight, left, right}. The input will be based on two attributes: a1 = {same, different} and a2 = {positive, negative}. The parameters of the attributes are determined as follows:
 $$\matrix{ {a_1} \hfill & { = \left\{ {\matrix{ {same} & {count\,of\,same > counts\,of\,different} \cr {different} & {otherwise} \cr } } \right.} \hfill \cr } $$
 $$\matrix{ {a_2} \hfill & { = \left\{ {\matrix{ {positive} & {counts\,of\,positive > counts\,of\,negative} \cr {negative} & {otherwise} \cr } } \right.} \hfill \cr } $$
The general notation of the posterior probability of naïve Bayes can be written as:
 $$P\lpar c_{j}\vert a_{1}, a_{2} \rpar = \displaystyle{{P(a_{1} \vert c_{j}) \cdot P(a_{1} \vert c_{j}) \cdot P(c_{j})}\over{P(a_{1}) \cdot P(a_{2})}}$$
The objective function in the naïve Bayes classifier is to maximize the posterior probability
 $\hbox{P}\lpar \hbox{c}_{\rm j}\vert \hbox{a}_{1}\comma \; \hbox{a}_{2}\rpar $
to determine the corresponding class.
 $$predicted\,class = \arg \max P \lpar c_{j} \vert a_{1}, a_{2} \rpar $$
In Equation (8), the predicted class will be obtained by calculating all the possible posterior probability and set the one with the highest probability as the class for the three cycles. The pseudocode of the turn detector algorithm is shown as follows:
Pseudocode of PZTD Algorithm
1. initialize PZTD variables
2. for i from 2 to length of ZUPT
3. if diff (ZUPTi, ZUPTi−1)equals 1
4. sum sw equals sum of gyr sw
5. elseif diff (ZUPTi, ZUPTi−1) equals −1
6. sumst equals sum of gyrst
7. end if
8. if sumsw AND sumst are non-Zero
9. state = XNOR(sumsw, sumst)
10. if state = 1 then countsame + 1
11. else countdiff + 1
12. end if
13. if (sumst + sumsw ) > 0 then countpos + 1
14. else countneg + 1
15. end if
16. vec_state increments with value of state
17. end if
18. if size(vec_state) equals 3
19. a1 equals to same or different (Equation (5))
20. a2 equals to positive or negative (Equation (6))
21. vec_PZTDi = max(p(straight, left, right∣a1, a2))
22. decrement vec_state by removing 1st index
23. end if
24. end for
where vec, countsame, countdiff, countpos and countneg represent vector, counts of same, different, positive and negative, respectively. The subscripts sw and st represent swing and stance, respectively. Meanwhile, max(p(straight, left, right) | a1, a2) is a short form for the operation stated in Equation (8). The predicted class will depend on the maximum probability between specific classes and attributes.
The probabilities for all classes such as p(straight | same, positive), p(right | same, positive) and p(left | same, positive) will be computed. The result will be set to either 0 (if straight has the maximum probability), 1 (if left turn has the maximum probability) or −1 (if right turn has the maximum probability). The result is stored in the PZTD vector.
4.2. Heading Correction
The yaw angle from the waist can be used to update the heading of the pedestrian. It is the result of the integral of the angular velocity of the gyroscope attached to the waist. Usually, the obtained yaw angle from the waist is contaminated with noise and drift, due to body vibration and the sensor's casing movement, due to loosening attachment, in addition to sensor misalignment.
However, by utilising PZTD, the yaw angle can be filtered to the extent sufficient to provide accurate heading information. The filtering is done in two stages. In the first stage, the angular velocity of the waist was integrated if the PZTD is discretely non-zero (true). The yaw angle is also denoted as heading angle at time k and was computed as follows:
 $$heading_k = \left\{ \matrix{ heading_{k - 1} + \int \omega _{waist}dt,\hfill & PZTD(k)! = 0 \hfill\cr heading_{k - 1}, \hfill & otherwise\hfill } \right.$$
In stage 2, the heading angle was subtracted from the bias which had been computed using Equation (11). “Round” is a MATLAB function that will round a value towards the nearest integer. Of note, Equation (11) was used only when the PZTD vector at time k equals zero. Bias has an initial value of zero.
 $${filteredheading}_{{k}} = {heading}_{k} - {bias}_{k{-1}}$$
 $${bias}_{k} = {filteredheading}_{k} - round \left(\displaystyle{{filteredheading_{k}-{bias}_{k{-1}}}\over{\pi {/2}}} \right)\!\cdot \pi {/2}$$
By applying Equation (11), the drift in the heading angle as the result of accumulation of bias over time was removed. Since no turn should be detected when PZTD equals zero (walking straight), the bias at the time can be measured and compensated. Thus, the bias will not accumulate and has very small drift due to un-filtered noise.
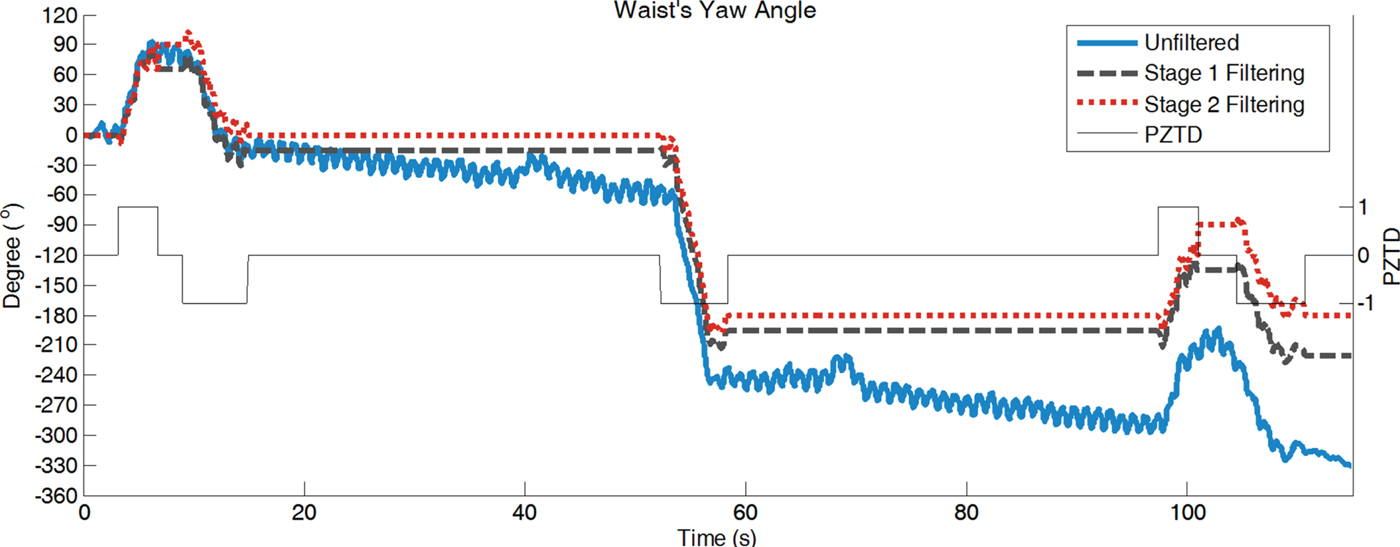
As depicted in Figure 4, the un-filtered angles (original) stay between −220° to −265° when t = 58 s to 97 s, a period of walking straight, though the angles are supposed to be −180°. The deviation from the actual angle is due to the inherited drift. The figure also shows the turns detected by the PZTD algorithm.
Waist's yaw angles in three representations (no filtering or original, stage 1 filtering and stage 2 filtering).

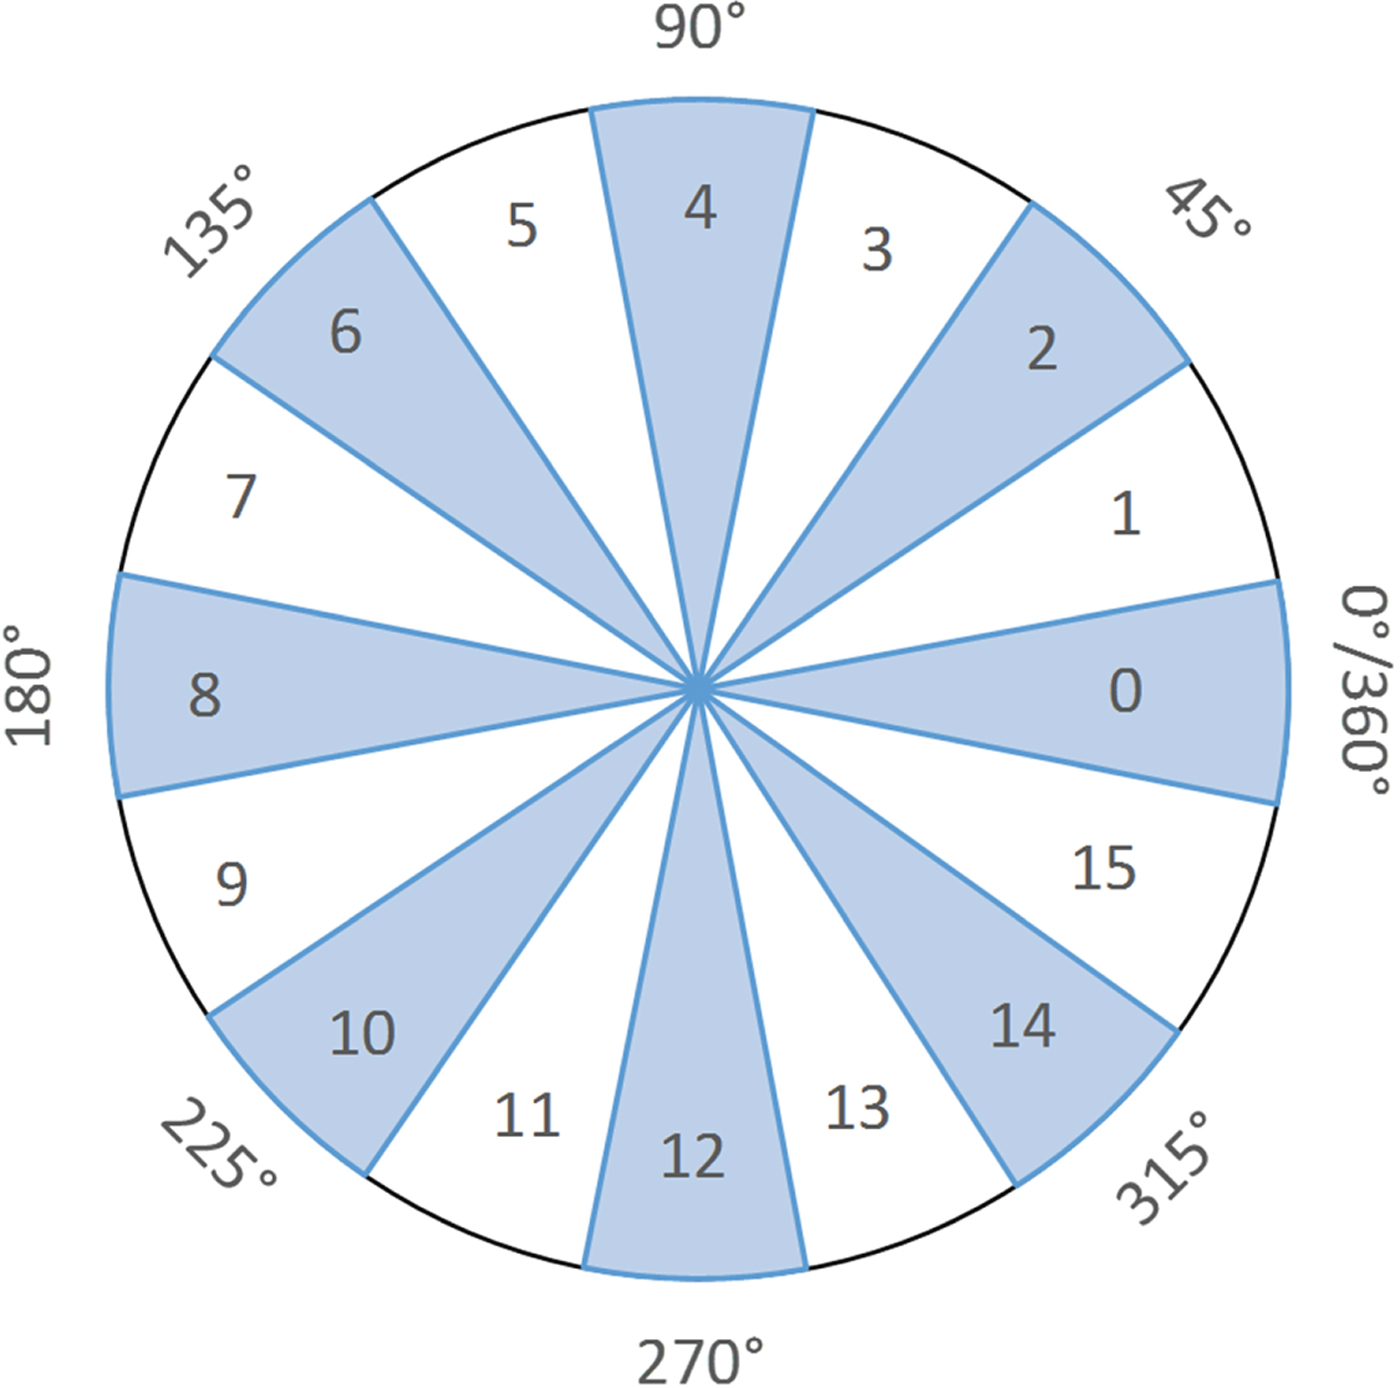
The quality of the filtering processes is enhanced by suspending the bias correction if a straight walk along non-dominant directions is detected. The last motion type, walking along non-dominant directions, can be determined by using the computed heading from Stage 1. At first, let a circle be divided into 16 sectors that comprises both dominant and non-dominant directions as shown in Figure 5.
The even numbered sectors represent the dominant directions and the odd numbered sector represent the non-dominant directions.

If the walk is straight and belongs to the even numbered sectors, then it is a walk along a Dominant Direction (DD), and a straight walk in the odd numbered sectors will be determined as a walk along a Non-Dominant Direction (NDD). The classification is formulated using the general formulae as follows:
 $$w=rem \left(round \left(\displaystyle{{{heading}_{k}}\over{22.5}} \right)\!, 2 \right)$$
 $$class\;of\;straight\;walk = \left\{ {\matrix{ {{\rm DD},} \hfill & {w = 0} \hfill \cr {{\rm NDD},} \hfill & {otherwise} \hfill \cr } } \right.$$
where “rem” is a MATLAB function that returns the remainder after the division (in this case it is two). Therefore, Equation (10) is revised as follows:
 $$filteredheading_k = \left\{ {\matrix{ {heading_k - bias_{k - 1},} \hfill & {DD} \hfill \cr {heading_k,} \hfill & {NDD} \hfill \cr } } \right.$$
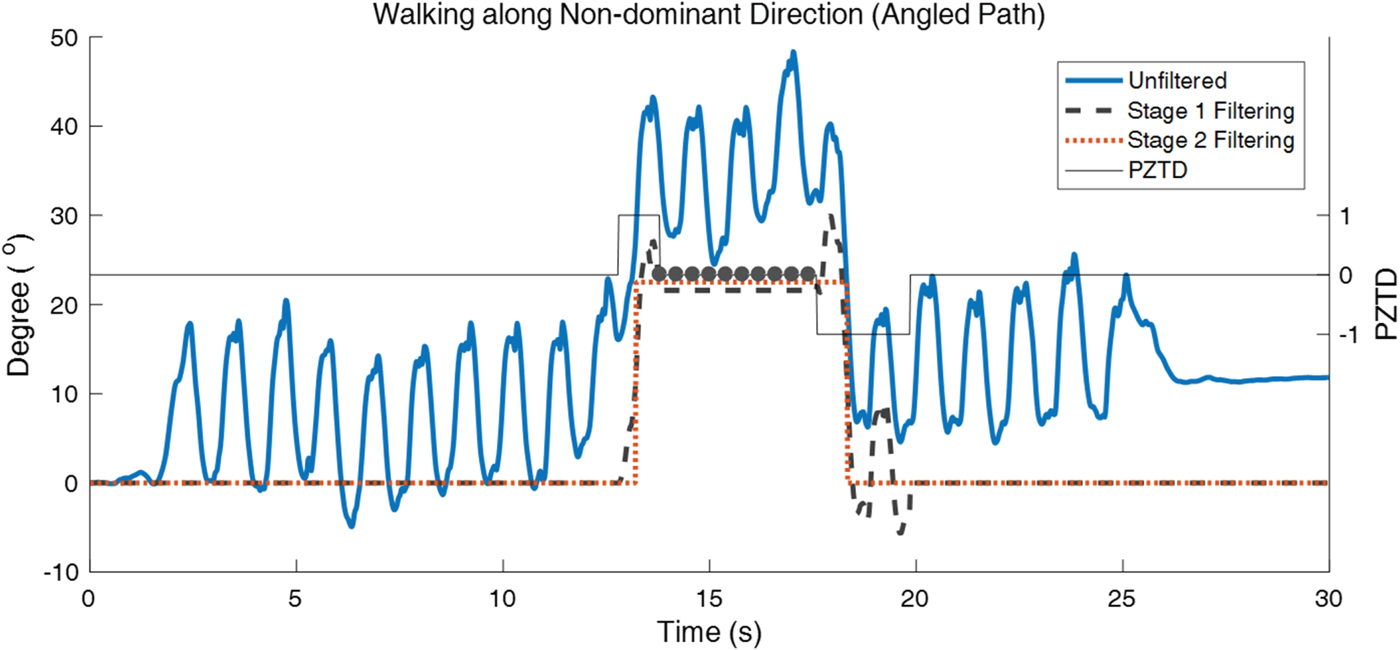
In an experiment, a pedestrian walked in a straight path along a dominant direction before entering an angled path, 22° off the straight path. The headings, before and after the filtering processes, are shown in Figure 6. The filtering successfully identifies the walk along the angled path (t = 13 s to 18·5 s) and suspends the bias correction until the pedestrian walked in the dominant direction again. Other experiments indicate that identification of non-dominant directions works for angles bigger than 20°. However, it partially works for angles between 10° to 20° and fails for angles smaller than 10°. The reason is the proposed turn detection method is not able to differentiate between pelvic rotation of a person, which can be around 10° for a normal walk (Liang et al., Reference Liang, Wu, Meijer, Lin, Lv, Lin, Prins, Hu, Van Dieën and Bruijn2014), and the actual turn to change the direction of walk.
The filtering processes reject the bias correction when a pedestrian walked along a non-dominant direction. The dots denote the detected non-dominant directions.

5. RESULTS AND DISCUSSION
In the first experiment, the proposed turn detection algorithm is compared with the state of the art methods. The second experiment compares the headings, before and after filtering processes are applied.
5.1. Comparison of turn detection methods
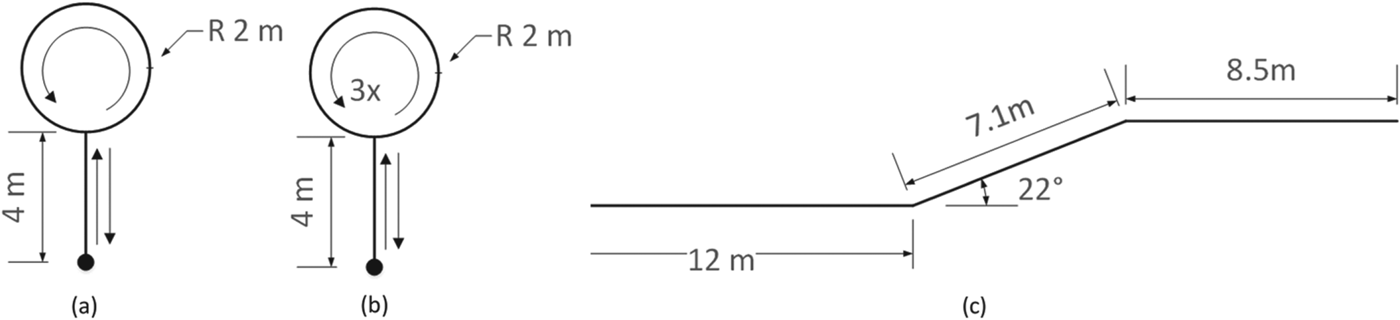
The turn detection methods are applied to three walking tests as shown in Figure 7. The first test required the pedestrian to walk along a curved path and back to the initial point. The second test is like the first but the pedestrian had to walk around a circular path three times. This test simulates a situation where the pedestrian walked for more than 30 s along non-dominant directions. Lastly, the pedestrian had to walk along an angled path. In all tests, the pedestrian would walk in the dominant directions from the starting point.
(a) Line segments and circular path, (b) line segments and circular path that repeated three times and (c) line segments with angled path. The dot represents the starting and ending (except (c)) points.

The methods to determine the straight and non-straight paths in iHDE and AHDE are compared. For non-straight paths, PZTD represents the paths by indicating the directions the pedestrian turns to. The comparison between INS devices, Preon and XSens MTw Awinda, has also been established. Preon, manufactured by Virtenio GmbH, uses ADXL345 accelerometers and ITG-3200 gyroscopes. A node of Preon and a node of XSens are paired side by side, and two pairs have been used simultaneously in the experiments; first mounted on the foot and then attached to the right side of the waist. From the datasheet, the more expensive XSens MTw has a better bias stability than Preon; 10°/hr for the gyros. Meanwhile, from the Allan variance plots, Preon's gyros have an average (Root Mean Square - RMS) bias stability of 24°/hr.
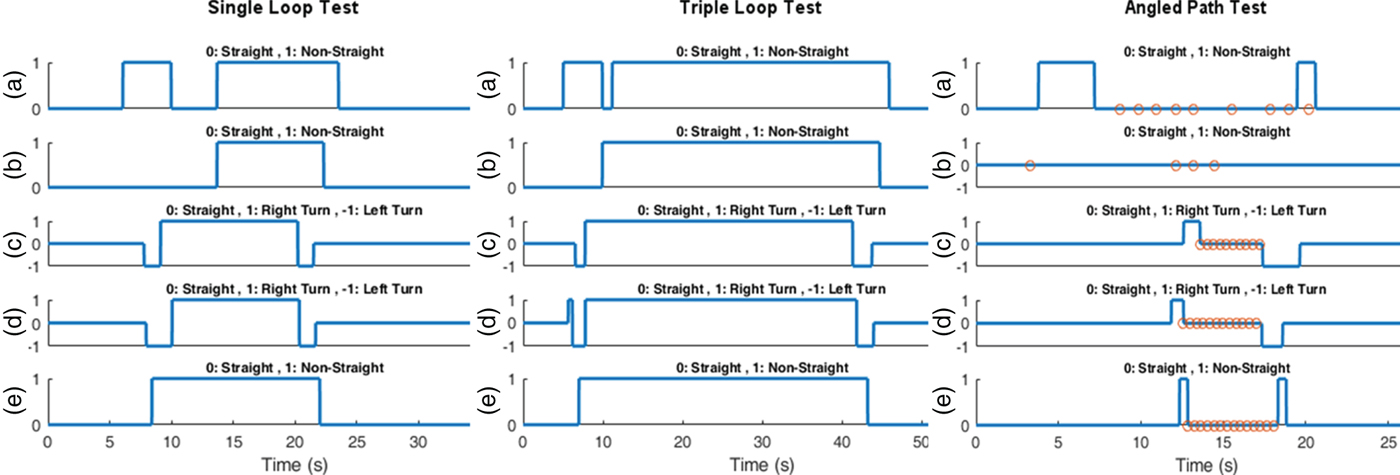
From Figure 8, it is obvious that the detection of non-straight walk when using iHDE and AHDE lags the ground truth. The reason is those methods require five to six pedestrian steps to determine the type of walk. The detection algorithms are severely affected when the change of walking direction happened over a short distance. For instance, AHDE is not able to detect the walk along the angled path as shown in Figure 8 (right).
The performance of straight and non-straight paths detection by (a) iHDE, (b) AHDE, and (c) PZTD using Preon. (d) is PZTD method using XSens MTw. Meanwhile, (e) is the ground truth. The circle markers in right-most figure represent the detected non-dominant directions.

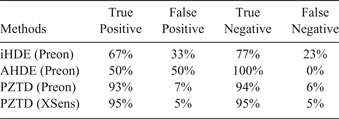
Meanwhile, the PZTD algorithm requires only three cycles of gait (two stance phases and one swing phase, or two swing phases and one stance phase) to detect the change of walking direction immediately. The proposed method also successfully detects the walk along the non-dominant directions, marked by the circles (Figure 8 (right)). The performance of all the methods from the tests is summarised in Table 8. The PZTD performs better than other methods and scores above 90% correct predictions. The detection performance between Preon and XSens is comparable and indicates that the proposed method works well for low-cost INS.
Comparison of accuracy between detection methods as well as INS devices.

5.2. Performance of filtering method
In the first test, a healthy male pedestrian walked normally in an anti-clockwise manner, following a rectangular shape (5·5 m × 2·8 m) 20 times. The waist's yaw angle that represents the heading angle was computed using two methods and compared. First, the trapezoid method was used to calculate heading angle from the angular velocity denoted as UH (Un-filtered Heading). In the second method, PZTD and heading correction were applied to acquire the Filtered Heading angle denoted as FH. Both methods were compared with the ground truth where the direction error is restricted by map matching.
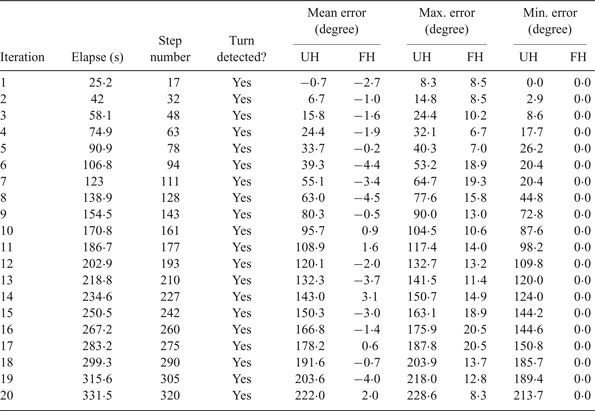
Table 9 lists the estimated heading error of UH and FH over 20 iterations of walking in a rectangular shape. The PZTD successfully detects all the turns in each of the iterations. The UH recorded a linear mean error growth, about 11° per iteration, which causes an accumulated mean error of about 222° after 20 iterations. As expected, FH performs better by achieving 2·2° in average mean error. The bias compensation in the filtering process minimises the drift in the heading angles. Thereby, zero minimum errors are attainable in all the iterations. Still, errors existed because bias compensation is not active when PZTD equals other than zero. The highest maximum error for FH is 9·0% of UH.
Comparative analysis of heading estimation error.

Another round of tests by the same pedestrian but in a clockwise direction indicates similar error performance. The mean error grows linearly at 13° per iteration for UH. Meanwhile, FH achieves 1·6° in average of the mean errors. Again, the highest maximum error for FH is 9·2% that of UH. Also, PZTD detects all the turns successfully.
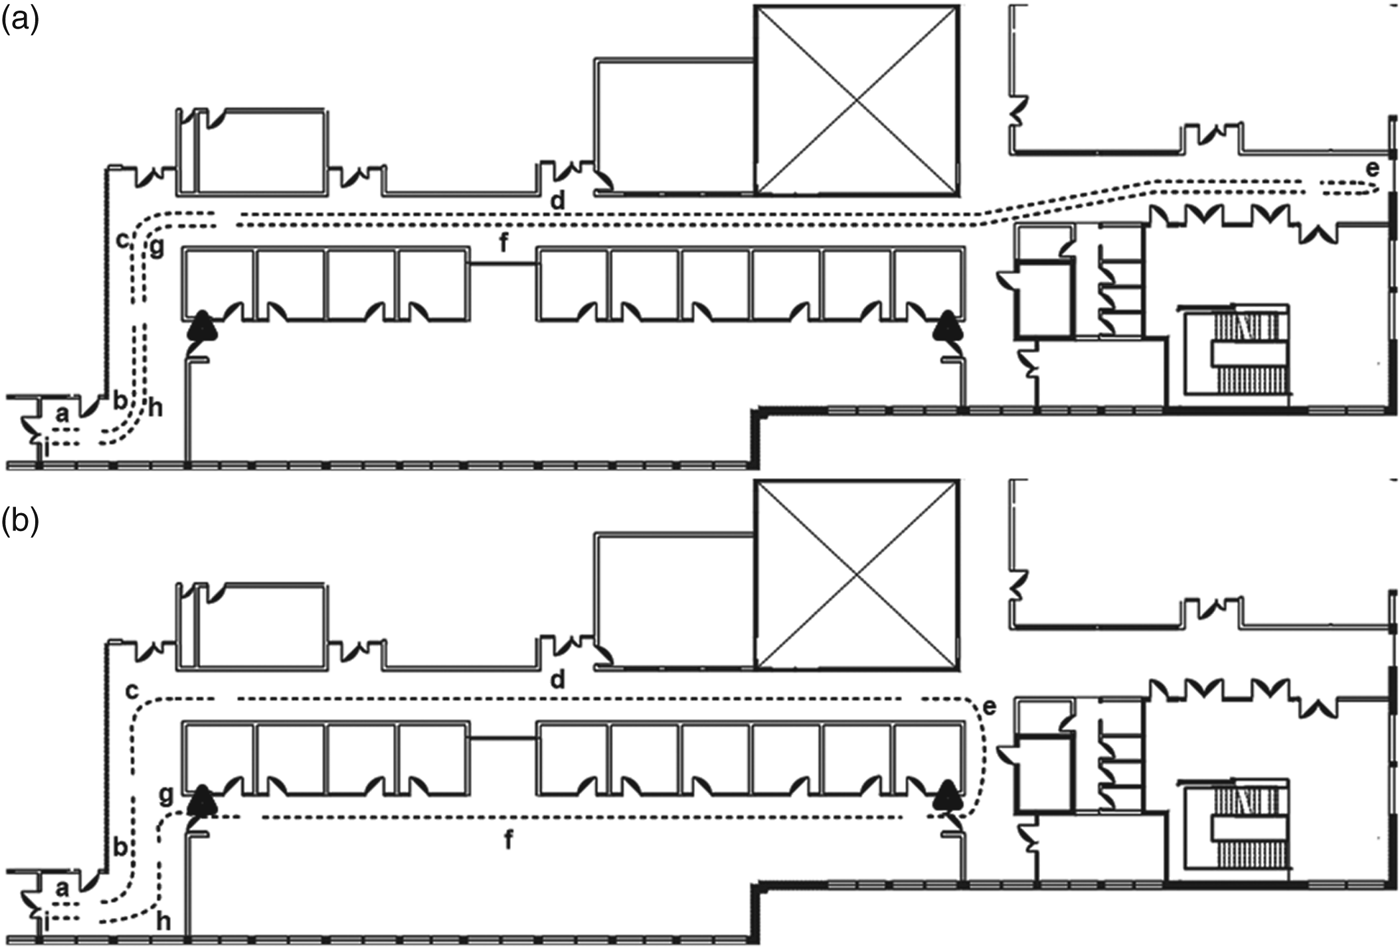
In the next tests, another two healthy male pedestrians were asked to walk along two tracks. In the first track, the first pedestrian would make a 180° turn at the end of the corridor and walk back to the initial position. Meanwhile, for the second track, another pedestrian had to turn around at the end of the long corridor and had to pass through two access doors on the way back. The tracks are labelled with checkpoints as shown in Figure 9. The actual distances are 150·3 m and 111·4 m for Track 1 and Track 2, respectively.
(a) The path for the first track. (b) The path for the second track. The triangles represent the access door where pedestrians need to swipe an access card to enter and press a button to exit. The paths are labelled with checkpoints (from a to i).

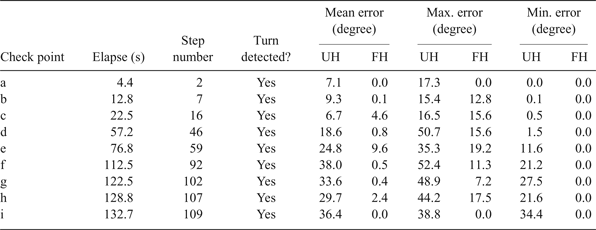
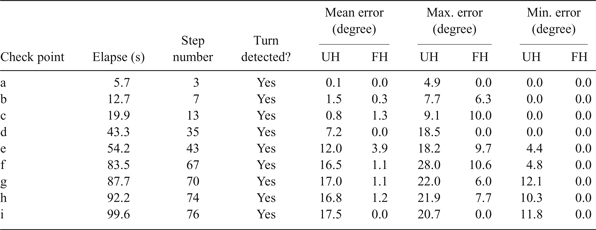
The results are tabulated in Table 10 and Table 11 for Track 1 and Track 2 respectively. Again, the PZTD detects all the turns without any failure in both tracks. The mean errors for UH gradually increased on both tracks. Meanwhile, FH achieved 2·0° and 1·0° average mean errors for Track 1 and Track 2, respectively.
Heading estimation error for Track 1.

Heading estimation error for Track 2.

Besides manufacturing defects and random walk error, the mean error can also have a contribution from the body movement during the walk such as shakes due to heels striking the ground. The sliding friction between the sensor's casing and body could also create noise in the angular velocity. These are the probable reasons for the differences in mean errors for UH. Interestingly, despite those problems, the mean errors for FH are very low compared to UH.
The second track was designed to challenge the algorithm as the pedestrians needed to turn their body to swipe the access card which could be detected as making a turn. Even though the turns of the body are detected when swiping the access card, the displacement of the body is virtually zero as the pedestrian was in the stance phase (checkpoints e and g). A similar situation is discussed in Tian et al. (Reference Tian, Salcic, Wang and Pan2015) where the access reader was used to reset a position in their handheld tracking system.
6. CONCLUSION
In this paper, we have established the relationship between pelvic rotation and ZUPT to determine walking direction using a low-cost INS. A novel Pelvic rotation-ZUPT Turn Detector (PZTD) is proposed. The PZTD does not require any threshold to determine whether a turn is made or not. If a turn is made, PZTD can determine the direction of the turn and detection is made with fewer pedestrian steps than in other state of the art methods. The experimental results indicate that the PZTD achieves more than 90% detection accuracy and performs better than state of the art methods even though a low-cost INS is used. The information from the PZTD is integrated in the filtering algorithm for heading correction. The filtering process can determine if a straight walk is following the dominant directions or otherwise. Afterwards, heading correction is performed on the heading angle derived from the waist mounted INS. The four sets of experiments indicate that the filtered angles have lower mean errors compared to the un-filtered angles and have very small drift.
The combination of PZTD and the heading angle filtering methods provides an affordable heading correction solution that is a strong alternative to those that use expensive industrial-grade INS, as well as to those using compass-based heading correction. The proposed heading correction solution could enhance pedestrian tracking performance as well as being used in other applications such as human activity recognition and rehabilitation.