


Introduction
Yersinia enterocolitica is an enteric pathogen, which may cause acute gastrointestinal disease in humans. Y. enterocolitica is widely distributed in aquatic and animal reservoirs, with swine serving as a major reservoir for human pathogenic strains. In the gastrointestinal tract, Y. enterocolitica can cause acute enteritis, enterocolitis, mesenteric lymphadenitis and terminal ileitis [Reference Bottone1].
Bacteria of the genus Yersinia are a common cause of gastroenteritis in most of the European Union/European Economic Area (EU/EEA) countries [2]. Y. enterocolitica is the most common Yersinia species reported in human cases (more than 96% of all confirmed cases in 2011, similar tendency was seen in previous years). Despite the fact that numbers of reported cases have decreased in the period 2008–2012, yersiniosis is still the third most commonly reported bacterial zoonosis in humans and a frequently reported gastrointestinal disease in Europe [2].
Surveillance of yersiniosis is important because it helps to monitor incidence trends, to identify groups with increased risks and to indicate possible outbreaks [Reference Ternhag3]. According to the European Centre for Disease Control and Prevention (ECDC) epidemiological report, 6548 confirmed cases of yersiniosis were reported by EU/EEA countries, in 2012. In the same year, the annual number of episodes of clinical gastroenteritis caused by Yersinia in Denmark is estimated to be 271 [2]. However, not all the countries in Europe are reporting cases of disease – the Netherlands stopped Yersinia surveillance in 1996 [Reference Van Pelt4].
Disease surveillance and notification systems are affected by under-reporting which can lead to underestimation of incidence of disease, and the related burden of morbidity and mortality. In particular, surveillance systems tend to miss cases at two different levels of the surveillance pyramid: at the community level, where not all people suffering from disease seek healthcare, and at the healthcare level – under-reporting symptomatic cases that have sought medical assistance [Reference Gibbons5].
Serological methods are important as an additional source of information for infectious disease epidemiology [Reference Bottone and Sheehan6–Reference Marks7]. Infection with a pathogenic organism usually results in the appearance of antibodies that can be detected in a blood sample. Therefore, serum antibody concentrations are important to study the occurrence of infections at the population level [Reference Teunis8]. Furthermore, determination of specific antibodies can be important in the final diagnosis of sequelae like reactive arthritis [Reference Granfors9–Reference Schiellerup11]. A large community-based study was performed to establish the extent to which patients with gastroenteritis in the population sought medical advice and had a stool culture performed. It was shown that the ratio between cases and the numbers who visited their general practitioner varied from 1 to 2.1 for Salmonella, Shigella and Campylobacter species, whereas it reached 11.7 for Yersinia, indicating that for every case presenting to GP there were around 12 additional Yersinia infection cases in the community [Reference Wheeler12].
The present paper describes a longitudinal study of the serum antibody response to infection with Y. enterocolitica, to provide essential information on the kinetics of serum antibodies. These allow the use of cross-sectional serum antibody measurements as biomarkers, to estimate seroconversion rates (or seroincidences) [Reference Wheeler12]. Such seroincidence estimates include asymptomatic seroconversions, thereby avoiding under-reporting mentioned above, and allows the comparison of infection pressures among countries, independent of their healthcare and surveillance systems. As far as authors know, there are no published seroepidemiological studies into Y. enterocolitica.
Methods and materials
Study population
Data from 94 patients with acute enteritis caused by Yersinia infection were used. Participants were recruited from the Danish Registry of Bacterial Enteropathogens (DRBE) after a stool culture had confirmed bacterial gastroenteritis caused by Yersinia. The Statens Serum Institut (SSI) in Copenhagen performs ongoing surveillance of infectious diseases in Denmark, and information on patient identity, referring doctor and results of cultures is stored in the database.
The follow-up period for the longitudinal study was 36 months. Study started on 7 January 2002 and the last sample was taken on 15 December 2004. There were 38 (40.4%) males and 56 (59.6%) females participating in the study. The median age was 43 years. All patients were asked to deliver a blood sample 1 month after the onset of diarrhoea, and subsequently provide samples at 3, 6 and 36 months. Seventy-seven patients delivered the first blood sample, 39 (51%) delivered the second blood sample, 60 (80%) delivered the third sample and 44 (57%) delivered the fourth sample.
We joined the serology database with additional data from a related study [Reference Schiellerup11] where all patients from the Yersinia study, who were more than 18 years old (and gave informed consent to participate), were included and filled in a questionnaire. This added self-reported information about the severity of symptoms of gastrointestinal infection (GI) and severity of joint pain (JP). Based on given information, patients were divided into three severity groups (mild, moderate or severe) for GI and JP separately. Also, severity of JP was examined by asking participants to provide an overall evaluation about their JP on the visual analogue scale (VAS) varying from 0 (‘no pain’) to 100 (‘worst imaginable pain’).
The Ethical Scientific Committee for Copenhagen approved the study (KF 01–300/00). The study was evaluated by the General Practitioners Research Council who encouraged members of the Danish Society for General Practitioners to participate in the study.
Serum samples
An indirect enzyme-linked immunosorbent assay (ELISA) method was developed for the determination of the concentration of antibodies against Y. enterocolitica O:3 in human sera. The ELISA procedure was performed in microtitre wells (Nunc-Immuno™ plates PolySorp™ F96, Sigma-Aldrich St Louis, MO, USA) and the analysis itself was automatised at a BioMek® 2000 robot (BeckmanCoulter Inc., Atlanta, GA, USA). Antigen (Yersinia O:3 BN50, Danish Institute for Food and Veterinary Research, Lyngby, DK) diluted 1 in 1000 in 100 µl ‘coating-buffer’ (carbonate-buffer at pH 9.60 containing 2 ml phenol red per litre) per well was used for an overnight coating at 4 °C. After a wash (‘wash-buffer’, i.e. phosphate-buffered saline (PBS) at pH 7.4 containing 1 ml Tween®20 per litre, was added at 250 µl per well and subsequently evacuated, four successive cycles were used), the wells were blocked by incubation with 250 µl ‘wash-buffer’ per well for 30 min at room temperature. The wells were subsequently washed and 100 µl of serum diluted 400 times in ‘dilution-buffer’ (PBS at pH 7.4 containing 1 ml Tween®20 per litre and 2 ml phenol red per litre) was added per well in duplicates and incubated in room temperature for 30 min. After a wash, 100 µl of dilutions made in “dilution-buffer” of horseradish peroxidase conjugated rabbit anti - human either IgG, IgM or IgA [Dako, cat.no. P0214, P0215 and P0216] was added per well (anti-IgG diluted 2500 times, anti-IgM diluted 1000 times and anti-IgA diluted 500 times) and incubated at 30 minutes at room temperature. One hundred microlitres of 1 M H2SO4 was added per well, and the optical density at 630 nm was finally determined. Each serum was analysed for the presence of IgG-, IgM- and IgA-anti LPS antibodies.
Clinical validation of the test including sensitivity and specificity has been published [Reference Dalby13]. Day-to-day variations were minimised by including a dilution series of a standard and a positive (X 1) and a negative control (X 0) at each analysis and expressing antibody levels (X) as a fraction of the range between positive and negative controls.
 $Y = \displaystyle{{X-X_0} \over {X_1-X_0}}.$ In order to avoid measurement errors, all tests were performed in duplicates and only accepted if the coefficient of variation was below 5%.
Model analyses
A mathematical within-host model was used to describe the interaction between pathogen and immune system and the waning of immunity after clearing of the pathogen. Upon infection with a certain dose (initial inoculum), numbers of bacteria in the host start increasing exponentially. At the same time, circulating antigen stimulates antibody-producing cells to generate new antibodies that inactivate (possibly indirectly) invading bacteria. Within a brief period, pathogen growth is stopped, and numbers of bacteria start to decline to zero. As soon as all bacteria have been killed off, antibody growth stops and a period of waning immunity begins, with antibody levels slowly declining towards zero. At the time of infection, serum antibody levels in the host are at (non-zero) baseline, indicating immunity due to antibodies remaining from the seroresponse to a previous infection.
The within-host model of bacterial infection may be fitted to serological data in a mixed (two-level) model Bayesian statistical framework. This allows incorporating the variation in seroresponses among individual patients, a prominent and common property of longitudinal serological data. Here, each individual has their own seroresponse curve, while the variation among patients is modelled by assigning all model parameters a (joint) probability distribution, representing the variation among the members of the sampled population.
A detailed description of the model, including its mathematical properties and details of the statistical framework and fitting procedures, has been published [Reference Graaf14]. As in the cited paper, the model was run in JAGS [Reference Plummer15], from the statistical platform ‘R’ [16], using the library rjags [Reference Plummer17]. Results show either parameter estimates for individual patients (Figs 3–5) or predicted characteristics, calculated using ‘group’-level parameter samples (Figs 1 and 2 and Tables 1 and 2). While analysing follow-up data of decaying antibody levels, there is always a possibility that patients are re-infected during their follow-up period. Including such data would lead to incorrect estimates of peak antibody levels and decay rates. In order to avoid such events of reinfection, we defined a likely re-infection as a more than twofold increase (relative to the previous measurement), unless the second antibody level was 0.05 (AU) or smaller. Data from subjects where such an increase occurred in any antibody type (IgG, IgM, IgA) were deleted, from the point where the increase occurred.
Time course (in days) of the antibody level y. The model output is shown as predicted median and 95% range. Also shown are observed antibody levels of 94 patients (multiple observations of each individual connected).

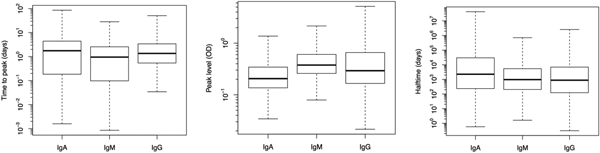
Box plots of predicted response characteristics – time to peak, peak time and half time – of antibody groups. Box plot shows minimum and maximum values in sample, lower quartile, median and upper quartile.

Estimated individual peak antibody levels of 94 patients for gender (dots – males, triangles – females) and age. Median and 95% range are shown.

Box plots with different antibodies peak time levels for different severity groups of gastrointestinal infection (GI). Box plot shows minimum and maximum values in sample, lower quartile, median and upper quartile. There were no significant associations found.

Box plots with different antibody levels for different joint pain (JP) groups. Box plot shows minimum and maximum values in sample, lower quartile, median and upper quartile. There was no significant association found.

Estimates of the seroresponse characteristics for different antibodies (IgG, IgM, IgA)

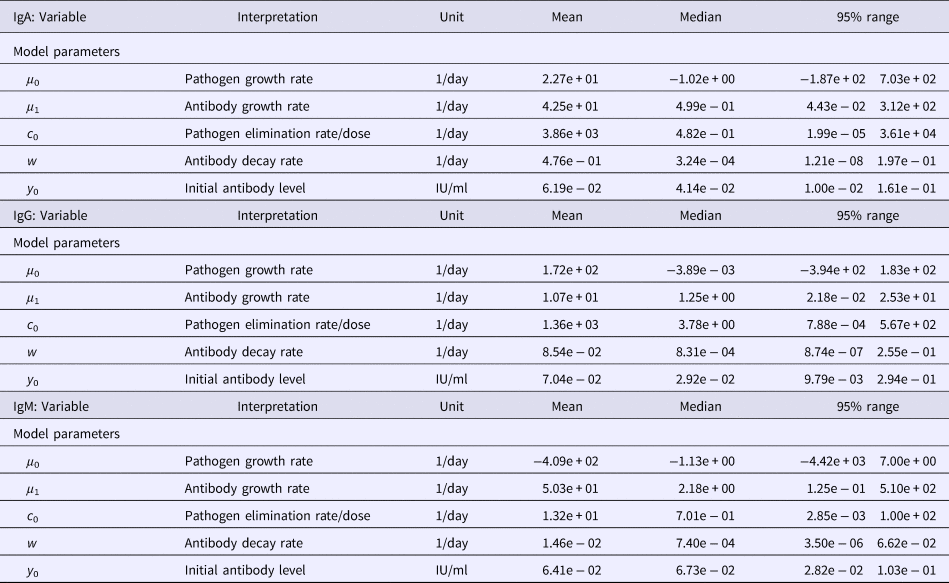
Estimates of the model parameters and y 0 for different antibodies (IgG, IgM, IgA)
All additional calculations and tabulations were done using ‘R’ [16].
Results
Among the serum samples from 94 patients with a culture-proven Y. enterocolitica O:3 infection, a total of 220 sera were analysed by the ELISA method to determine the antibody levels. Observed antibody (IgG, IgM, IgA) decay profiles of all patients are presented in Fig. 1 together with the time course of quantiles (2.5, 0.5, 0.975) of predicted antibody levels. All three antibodies reached peak levels shortly after infection (symptom onset) and then decayed slowly, so that the median levels decreased only little during the observation period (approximately 3 years). Estimated maximum peak antibody levels were highest in IgG, and somewhat lower in IgM and IgA, though the estimated median and mean peak levels did not differ much (Table 1). However, the seroresponse curves of all antibodies showed large individual variation between patients, and some individuals had high values all over the follow-up period, while others remained at low levels (Fig. 1).
Figure 2 illustrates the population estimates of predicted response characteristics – time to peak, peak antibody level and half-time of antibody decay, for all three antibodies.
Figure 3 shows the estimates of individual serum antibody peak levels by age, for male and female patients. There is no apparent pattern of variation over age, nor any notable difference between genders.
Table 1 summarises the estimates of the seroresponse characteristics – duration of infection (in days), peak antibody level (OD units) and half-time of antibody decay (in days). The mean, median and 95% ranges are given. Estimated half-times were very long for all antibodies, and their posterior distributions were highly skewed (as indicated by the means>>medians). This may reflect difficulties in estimating antibody decay because antibody levels tend to decrease little over the observation period.
Somewhat surprisingly, IgA appeared to have the most persistent antibody response, followed by IgG with only slightly shorter half-time and IgM with almost two times shorter duration than IgA. Note, however, the high uncertainty in these estimates (95% ranges). Median peak levels of all three antibodies were similar.
Additional data on severity of symptoms were available from a previously published study [Reference Schiellerup11]. Using these data, we have checked possible relations between peak antibody levels and severity (mild, moderate, severe) of gastrointestinal symptoms. Results are shown in Fig. 4. No significant association could be established between peak antibody levels and severity of symptoms (Kruskal–Wallis rank-sum test: data not shown). As estimates of time to peak and half-time of antibody decay were much more uncertain than peak-level estimates, only the latter was considered here. We also tested whether peak antibody levels showed a relation with severity of JP (mild, moderate, severe). Although the peak antibody levels of patients with most severe JPs seemed highest, particularly in IgM and IgA antibodies, there was no significant effect found after testing (data not shown, see Fig. 5).
Discussion
A group of 94 patients with confirmed Y. enterocolitica infection were followed up for around 3 years and blood samples were tested for the presence of specific Yersinia antibodies (IgG, IgM, IgA). In observing the antibody decay profiles, considerable individual variation can be seen. Similar studies of Salmonella and Campylobacter [Reference Strid18, Reference Strid19] showed a similar degree of individual variation.
Within the study population, no association was found between seroresponse characteristics and age or gender. A previous study of antibody responses to Campylobacter infection showed that IgM was highest among the youngest patients – in 10–25 years age group (P = 0.0001) [Reference Strid19]. Young age dependency was also found for IgM response after the infection by Salmonella serotype Enteritidis [Reference Strid18]. The present study did not include small children, but a similar association may exist in Yersinia infection. This may have clinical relevance because the highest incidence of laboratory-confirmed cases of Yersinia spp. infection in the Netherlands was found among the youngest children (0–4 years) and decreased with increasing age [Reference Van Pelt4]. Epidemiological data from Denmark show that before 2008, the majority of persons contracting Yersinia enteritis were between 1 and 4 years of age, but since then, the distribution has changed dramatically with the dominating group between 45 and 54 years of age (unpublished data).
We were unable to establish a relation between strength of the seroresponse (peak antibody levels) and severity of symptoms, neither for gastroenteric illness, nor for JPs.
There can be a potential bias affecting the results between peak time levels of different antibodies and severity groups for GI and JP. First, it is possible that the participants cannot remember information or remember incorrectly in self-reported questions and it can cause recall bias – in questions about JP or GI. Second, it is possible that persons with severe symptoms are less likely to forget the intensity of pain compared with those who had mild symptoms, which can misrepresent the strength of association. Third, it cannot be excluded that bias may also have occurred in later evaluation of severity groups based on questionnaires. As stated in a previous study [Reference Schiellerup11], from which we used additional data to check the relation with GI and JP, there are no generally accepted standards existing to classify gastroenteritis and JP into mild, moderate or severe. An arbitrary set of criteria was developed by those authors and applied to the study population.
The present results quantify the seroresponse to infection with Y. enterocolitica, including variation in seroresponse characteristics among individual subjects. The predicted characteristics – time to peak, peak level and antibody decay rates – may be used in biomarker studies of seroconversion rates. Given the seroresponse of a population, a cross-sectional sample of observed serum antibody levels may be interpreted as a ‘snapshot’ observation of decaying antibody levels, with higher levels indicating more frequent (more recent) infection [Reference Teunis8, Reference Graaf14]. Such studies have been demonstrated to provide useful information about the infection pressure of enteric (and other) pathogens, including asymptomatic (or mildly symptomatic, not notified) infections [Reference Simonsen20, Reference Ang21]. Population data on Yersinia seroprevalence have not been conducted, to date. Yet, they are relevant when studying burden of disease on uniform material and avoiding bias from culturing methodology.
The estimated seroresponse characteristics in this study have considerable uncertainty, due to the limited size of the study with 94 patients and the small number of samples per person (79 with a first sample, 37 with a second sample, 52 with a third sample and 37 with a fourth sample). The difficulties in estimating antibody decay profiles also may be taken as an indication of the follow-up period that is short compared to the persistence of the antibodies detected in this study (fourth sample taken between 353 and 1053 days post-symptom onset while the order of magnitude of the estimated half-time is thousands of days).
Author ORCIDs
P.F.M. Teunis, 0000-0003-1904-6044.
Acknowledgements
The authors thank Peter Schiellerup for collecting the samples and Serological Laboratory for their contribution.



 Open access

