

INTRODUCTION
CNS reactive astrogliosis that follows brain injury usually contributes to secondary neuronal death (Kim et al., Reference Kim, Kim, Park, Lee, Kim and Yu2006; Cui et al., Reference Cui, Yin and Benowitz2009), to interference of connections repair or restoration (Johnson, Reference Johnson1993; Nieto-Sampedro, Reference Nieto-Sampedro1999; Lanosa and Colombo, Reference Lanosa and Colombo2008), and to elimination/disorganization of the primate cortical interlaminar astroglial palisade (Colombo et al., Reference Colombo, Yáñez and Lipina1997). Thus, astroglial events could involve positive or negative conditions for regenerative processes suggesting that secondary neuronal death and axonal regeneration may be modulated by strategies aimed at modifying glial reactivity.
Among other features, reactive astrocytes show hypertrophy of the nucleus, soma and cellular processes, increase in GFAP and vimentin expression, cell proliferation and migration (Ridet et al., Reference Ridet, Malhotra, Privat and Gage1997; Lanosa et al., Reference Lanosa, Yañez, Alzugaray and Colombo2012). In addition, it has been shown that astroglial reactivity decreases synaptogenesis and the number of presynaptic terminals (Emirandetti et al., Reference Emirandetti, Graciele Zanon, Sabha and de Oliveira2006). In this context, it is worth mentioning that the protein ezrin, which belongs to the actin-binding ERM protein family, participates in changes in cell shape and mobility, and is expressed in peripheral astrocytic processes (PAPs) involved in mechanisms of synapse regulation (Derouiche and Frotscher, Reference Derouiche and Frotscher2001). It was reported that ezrin expression increases in reactive astrocytes (Emirandetti et al., Reference Emirandetti, Graciele Zanon, Sabha and de Oliveira2006). Post-injury increase of excitatory amino acid concentration up to excitotoxic levels, and the subsequent increase of intracellular Ca2+ concentrations, would be part of the events associated with secondary neuronal death (Tator and Fehlings, Reference Tator and Fehlings1991). Therefore, in the context of an injury, astroglial glutamate transporters EAAT1 would have a key role, since astrocytes could reduce the cytotoxic effect of glutamate through its uptake from the extracellular medium (Beschorner et al., Reference Beschorner, Dietz, Schauer, Mittelbronn, Schluesener and Trautmann2007).
Neurorehabilitation strategies are based on the concept of functional compensation, i.e. the reorganization of surviving neural circuits to perform a function which was previously attributed to the damaged circuits (Robertson and Murre, Reference Robertson and Murre1999). In this sense, favorable effects of environmental enrichment (EE) exposure on repair and neurorehabilitation processes subsequent to brain damage have been observed in rodent and primate models (Will et al., Reference Will, Rosenzweig, Bennett, Hebert and Morimoto1977; Black et al., Reference Black, Sirevaag and Greenough1987; Johansson, Reference Johansson1996; Grossman et al., Reference Grossman, Churchill, McKinney, Kodish, Otte and Greenough2003; Xerri and Zennou-Azogui, Reference Xerri and Zennou-Azogui2003; Farah et al., Reference Farah, Illes, Cook-Deegan, Gardner, Kandel and King2004; Fisher et al., Reference Fisher, Petzinger, Nixon, Hogg, Bremner and Mwshul2004; Winocur et al., Reference Winocur, Moscovitch, Fogel, Rosenbaum and Sekeres2005). In this regard, it is important to note that although EE exposure and cognitive training – in a specific task – have been defined as non-identical concepts, neuroplasticity events are involved in both conditions. Furthermore, it has been reported that training in specific cognitive activities previous to MPTP (1-methyl-4-phenyl-1,2,3,6-tetrahydropyridine) treatment interferes with the cognitive deficit subsequent to the administration of this neurotoxin in non-human primates (Lipina and Colombo, Reference Lipina and Colombo2007). At the cellular level, effects of EE exposure have been identified on several processes, e.g. decrease in apoptotic cells and injury volume; increase in nerve growth factors expression, dendritic spine density; neuronal survival; gliogenesis, synaptogenesis, neurogenesis (Johansson, Reference Johansson1996; Johansson and Belichenko, Reference Johansson and Belichenko2002; Komitova et al., Reference Komitova, Perfilieva, Mattsson, Eriksson and Johansson2002; Xerri and Zennou-Azogui, Reference Xerri and Zennou-Azogui2003; Weiloch and Nikolich, Reference Weiloch and Nikolich2006; Lippert-Gruener et al., Reference Lippert-Gruener, Maegele, Garbe and Angelov2007). Most research studies on regeneration or repair strategies in animal models exposed to EE conditions following brain injury have been focused on the analysis of neuronal plasticity events. Therefore, current evidence suggests that exposure to EE conditions after an injury produces certain beneficial effects on regenerative and plastic processes in the neuronal component of the neuropil. In the present study, EE was considered as a possible preventive/protective factor that may impact on astrocyte reactivity.
OBJECTIVE
The aim of the present study was to test the hypothesis that the exposure to an EE condition prior to a cerebral cortex injury may impact on astrocyte reactivity. Thus, in this case, EE condition was considered in the context of a possible preventive/protective factor. For this purpose, this work focused on immunolabeling analysis of those specific astroglial components in the perilesional cortex, which are essential to astrocyte participation in neuropil reorganization, after performing a cortical stab wound in the visual cerebral cortex of adult rats exposed to EE conditions during postnatal development.
METHODS
Ethics
In all cases, the use of animals was in agreement with the NIH Guide for the Care and Use of Laboratory Animals (1985), and the principles adopted by the American Physiological Society, and those presented in the guidelines for the use of animals in neuroscience research of the Society for Neuroscience (1992). In addition, all the procedures performed in this study were approved by CEMIC Institutional Ethics Committee.
Animals
A total of 21 Sprague–Dawley male rats were used. Females were not used in order to avoid possible variations according to the estrous cycle. Animals were weaned at 21 days of age (35–49 g) and fed with balanced solid food and water ad libitum. They were then placed in cages under an automatically controlled light/dark (12 h/12 h) cycle.
Experimental design
Animals were distributed at random among the experimental groups. The study focused on the EE paradigm (Grossman et al., Reference Grossman, Churchill, Bates, Kleim and Greenough2002), and the age of the animals used was also in accord with it. The cortical area subject to study was the visual cortex, where other authors have demonstrated changes in neuronal plasticity following EE exposure. Rats had been exposed to EE condition only before injury was performed in order to undoubtedly differentiate protection (i.e. short-term effects after injury) from repair effects.
EE condition consisted of 8–10 rats per cage (dimensions: 60 × 53 × 35 cm) which included several levels, tunnels and obstacles of varying size. Object position was changed twice a week, as well as drinking and food sources. The non-enriched or standard condition (SC) consisted of 2–3 rats per cage (dimensions: 30 × 18 × 15 cm), whose food and drinking sources were fixed, and no other object was included. Twenty-one-day-old animals (at weaning; P21) were distributed at random to EE or SC condition and exposed to them for a 30-day period, followed by a surgical stab-wound injury (I) or a ‘sham’ (Sh) procedure at the age of 51–54 postnatal days (P51). All animals stayed in SC for a 7-day additional period. Hence, the experimental groups were defined as SCSh (n = 3), EESh (n = 5), SCI (n = 6), EEI (n = 7), according to the factor-level combination of ‘injury condition’ and ‘environmental condition’.
Surgical procedures
Stab wound procedures were performed on the visual cortex, as described by other authors (Amat et al., Reference Amat, Ishiguro, Nakamura and Norton1996; Hampton et al., Reference Hampton, Rhodes, Zhao, Franklin and Fawcett2004), after the 30-day period of exposition to either EE or SC (i.e. at P51). Animals were intraperitoneally anesthetized with a mixture (10:1) of ketamine (60 mg kg−1) and xylazine (6 mg kg−1). Lidocaine was used as a local anesthesia. Once the skull was immobilized on a stereotaxic frame, a craniotomy was performed over the required area of the right hemisphere by using the atlas of Paxinos and Watson (Reference Paxinos and Watson1982) as reference. The craniotomy was placed at (−3, −10) from bregma, and (+2, +5) from the midline. The stab wound was performed with a scalpel (#11) located at (−4 bregma, +3 lateral). Then, the scalpel was lowered down 1 mm from the cortical surface and moved to (−7) bregma, in order to produce a linear longitudinal lesion. The skin was closed with interrupted sutures and 10% iodinepovidone was used as an antiseptic. The animals received an intramuscular injection of antibiotic (gentamicin) at the end of the surgery, and were placed in individual cages for 24 h up to their satisfactory recovery. Identical procedures were applied to ‘sham’ animals, except for stab-wound injury.
Bromodeoxyuridine (BrdU) administration
Procedures were aimed at BrdU labeling all possible cycling cells, even in the last day of the experiments: four intraperitoneal injections of BrdU (diluted in a sterile solution of 0.9% NaCl) were applied to experimental animals at a dose of 50 mg kg of body weight. BrdU was administered every 2 days starting 24 h after surgery. On the 7th day, the last injection was administered 2 h before animal perfusion.
Tissue fixation. Brain sectioning and selection
The post-surgery experimental period lasted 7 days, since this time period represents the acute phase of glial reactive events, and a peak of astrogliosis/astrocytosis was reported by several authors to be occurring at this time point (e.g. Hampton et al., Reference Hampton, Rhodes, Zhao, Franklin and Fawcett2004). Animals were anesthetized with sodium pentobarbital, and perfused with saline solution containing heparin, followed by 4% paraformaldehyde (pH 7.2). The brains and intestines (control of BrdU incorporation) were postfixed by immersion for an additional 2-h period, and then embedded in sucrose for their freezing and storage at −70°C.
Forty-meter serial coronal sections of the visual cortex were obtained with a cryostat. In order to reduce variability, sections were only selected from the longitudinal central portion of the wound between (−5) and (−6) from bregma, and the remaining anterior and posterior 1-mm portions were excluded. A systematic sampling scheme was used to select brain sections from each animal (Howard and Reed, Reference Howard and Reed2005), resulting in one section every 200 µm, with a total of 3–4 sections of each animal for each immunolabel (see supplementary Fig. S1 online).
Immunofluorescence procedures
Immunofluorescence was applied on free-floating sections using current procedures (Schutte et al., Reference Schutte, Reynders, Bosman and Blijham1987; Campana et al., Reference Campana, Coustan-Smith and Janossy1988; Colombo et al., Reference Colombo, Härtig, Lipina and Bons1998, Reference Colombo, Schleicher and Zilles1999, Reference Colombo, Fuchs, Härtig, Marotte and Puissant2000). The following antibodies were used: anti-GFAP (Cy3-conjugated mouse monoclonal, Clone GA-5, 1/1000, Sigma-Aldrich, USA); anti-vimentin (Cy3-conjugated mouse monoclonal, 1/500, Sigma-Aldrich, USA); anti-EAAT1 (polyclonal goat, 1/200, Santa Cruz Bt.), and then revealed with FITC-conjugated anti-goat IgG secondary antibody (1/200, Sigma-Aldrich, USA); anti-ezrin (mouse monoclonal, 1/200, Santa Cruz Bt.), and then revealed with Alexafluor 488-conjugated anti-mouse IgG secondary antibody (1/400, Invitrogen); anti-BrdU (mouse monoclonal, 1/200, Roche), and then revealed with TRITC-conjugated anti-mouse IgG secondary antibody (1/200, Sigma-Aldrich, USA); anti-Ki-67 (polyclonal rabbit, 1/100, Millipore), and then revealed with Alexafluor 635-conjugated anti-rabbit IgG secondary antibody (1/200, Invitrogen).
Immunohistochemistry procedures
For complementary analysis, GFAP-IR (immunoreactive) astrocytes were detected using anti-GFAP antibody (mouse monoclonal, Clone GA-5, 1/2000, Biogenex), followed by the biotin-conjugated anti-mouse IgG secondary antibody (1/200, Sigma-Aldrich, USA) and the streptavidin–peroxidase–diaminobenzidine reaction. Hematoxylin was used as nuclear counterstaining. Following dehydration, the sections were mounted in anhydrous medium.
Analysis of nuclear markers
Both BrdU and Ki-67 immunolabelings were analyzed in Hoechst counterstaining slices in order to verify the nuclear location of the markers at the scar tissue and the perilesional cortex in confocal images captured in the confocal technical service of Leloir Institute (Buenos Aires, Argentina; model: Carl Zeiss LSM 510 META, 20 × , NA: 0.8).
Analysis of GFAP-, vimentin-, EAAT1- and Ezrin immunolabeling
The analysis was performed on the perilesional cortex, since it had been reported that a lesion produces changes in the adjacent non-damaged cortex (Johansson, Reference Johansson2000), suggesting tissue reorganization, which would be a component of compensatory reactions. Immunofluorescence was observed under a light microscope equipped with epifluorescence (Carl Zeiss Axiovert 35M, Germany), and images were digitized with a CCD camera (ProgRes STAR, Jenoptik, Germany). Digital image analysis was performed using the ImageJ program (version 1.43u). The choice and implementation of the following analysis procedures were partially based on former studies from other authors (Geiger et al., Reference Geiger, Stoldt, Schlote and Derouiche2000; Emirandetti et al., Reference Emirandetti, Graciele Zanon, Sabha and de Oliveira2006; Miguel-Hidalgo et al., Reference Miguel-Hidalgo, Waltzer, Whittom, Austin, Rajkowska and Stockmeier2010). For all markers under study, images were captured using a 20 × , NA 0.5 objective. Images from two 360 × 270 µm fields were captured: Field 1 was next to the wound edge and on perilesional cortical tissue, and field 2 was adjacent to the first one and further away from the wound. Images of these two fields were captured from both the medial and the lateral sides of the wound, and from topographically equivalent sites of the contralateral non-injured hemisphere (left) (see supplementary Fig. S2 online). The analyzed fields contained cortical layers II–IV, which were included within the wound depth in most brain sections (see supplementary Fig. S2B,C online). Layer I was excluded from the analysis to avoid the intense non-specific autofluorescence of the meninges, and deeper V and VI layers were also excluded, since they were not always contained in the wound. In addition, it has been proposed that mostly layers II–IV are involved in the cortical plasticity and reorganization events (Hess, Reference Hess2004), and that there is an increase in astrocytes–synapses contacts in these cortical layers after exposing rats to EE conditions (Jones and Greenough, Reference Jones and Greenough1996).
In each field belonging to the perilesional cortex, the area covered by each specific marker in the total area (% immunoreactive area, i.e. IR area) was analyzed, as well as the % IR area according to distance from the lesion in 60-μm stripes of fields from the damaged hemisphere (right) (six stripes in both fields 1 and 2, i.e. 12 stripes in total). In both types of analysis (% total IR area or in stripes), the procedure consisted in setting a threshold in the image to be analyzed in order to define the IR label, compared to a negative control (obtained in immunolabeling procedures by avoiding the primary antibody). Each round of staining included a negative control, and a ‘background’ image (i.e. that one belonging to the negative control) has been subtracted to each image belonging to sections from a round of staining. Then, the threshold applied was the same for all images belonging to the same round of marker. The % IR area was automatically obtained from the resultant binary images (see supplementary Fig. S3 online). The same method was applied for each marker.
Both the image capturing and analysis were performed without knowledge about what EE condition was the experimental group from. In case of injury condition, it was impossible to perform a blind analysis, because lesion was easily detectable during the process of image capturing and analysis.
Quantification of GFAP-IR astrocytes
Quantification of GFAP-IR astrocytes was also performed in F1 and F2 of perilesional cortex – and in analog zones in sham animals and intact hemisphere (left) – on three brain slices from each animal (3 animals per experimental group), and processed for immunohistochemistry and nuclear hematoxylin counterstaining. For this purpose, each F1 and F2 cortical field was subdivided into four subfields at 400× magnification under a light microscope (Leica DMLB). The number of astrocytes in either F1 or F2, from medial and lateral sides of the injured (right)- and the intact (left) hemisphere, was expressed as the number of GFAP-IR cells per field.
Statistical analysis
Since normality and homocedasticity assumptions were verified by Kolmogorov–Smirnov and Levene tests, respectively, a univariate, multifactorial ANOVA with crossed fixed factors was conducted. Analysis for each immunolabel was separately performed. The analyzed quantitative variables were % IR area (area covered by immunolabel over the whole analyzed area, i.e. area of field 1 or 2, as appropriate), and #GFAP-IR cells/field. In the cases where no effects were found on the intact contralateral hemisphere (left), variable values in the injured hemisphere (right) were standardized according to the former, in order to control possible differences between animals and sections in each experimental group. The new variable Δ% IR area consisted of % IR area (right–left) − Xmin (Xmin was the least negative value in the data group for the experimental group), with a term that implies a linear transformation of the variable, so that there were only positive values. Since it is a linear transformation, data distribution did not change. Five factors were included in the ANOVA model: environment (enriched, EE; standard condition, SC), injury (injury, I; Sham, Sh), hemisphere (right; left), side (medial to injury, M; lateral to injury, L or equivalent zones in the intact hemisphere) and field (field 1; field 2). In case of no significant interaction among factors and no significant differences among groups regarding a factor (e.g. ‘side’), their main effects were analyzed, and the values were averaged without discriminating this factor. In the case of significant interaction among factors, multiple comparisons were made among their different levels by using Tukey's test. This test, in turn, allowed identifying post hoc significant differences. Values of the variable % IR area obtained from the right hemisphere (injured and non-injured of the intact animals) were included in the regression analysis to assess the relationship between the dependent variable, % IR area (or the standardized one) and the independent variable, distance (μm) from the wound, which was defined by the stripes. Given the large number of data in all cases, scatter plots showed the mean ± 2 SEM (standard error of the mean) of the dependent variable for each distance value. In each case, we looked for the regression curve that best fits the data of each immunolabel according to the adjusted determination coefficient R 2. In those cases where it was necessary to adjust data to a linear function, an appropriate transformation was introduced to the independent variable, given by its inverse 1/distance. The differences between regression coefficients and between intercepts of every experimental group were evaluated by comparing their respective confidence intervals at 95%. In all the analysis, the probability of Type I error remained at 0.05. In the figures, different letters placed over the bar plot indicate significant differences. Intercooler Stata (version 8.0) or SPSS (version 12.0) statistical programs were used to perform the above-mentioned statistical analysis.
RESULTS
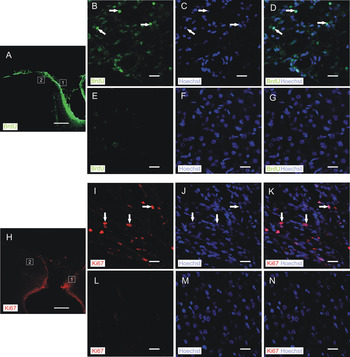
Both BrdU and Ki-67 labelings were restricted to cell nuclei located within the scar area of the wound, and were not found in the perilesional cortical area of interest for this study (Fig. 1). Scarce labeled nuclei were detected farther away from the perilesional zone, and were associated with cortical blood vessels (data not shown).
Neither BrdU- nor Ki-67 immunolabeled nuclei were found at the perilesional cortex. Confocal images of BrdU and Ki-67 immunolabelings, and Hoechst as a nuclear stain, are shown. Both immunolabelings were restricted to nuclei (arrows) within the scar tissue at the wound (representative samples of analyzed fields are, respectively, shown as inset #1 in (A), panels (B–D); and inset #1 in (H), panels (I–K), and no immunolabeled nuclei were found at the perilesional cortex, which was the region investigated in this study (representative samples of analyzed fields are, respectively, shown as inset #2 in (A), panels (E–G); and inset #2 in (H), panels (L–N). Scale bars: (A) and (H): 400 µm; (B–G), (I–N): 20 µm.

Reactive astrocytes: GFAP
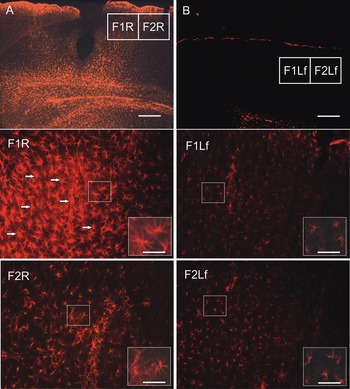
Typical reactive hypertrophic astrocytes with enlarged GFAP-IR processes were found in the right hemisphere of injured animals, but neither in the contralateral hemisphere (left) nor in intact animals (Fig. 2).
Typical reactive hypertrophic astrocytes with enlarged GFAP-IR processes were found in the perilesional cortex of the right hemisphere of injured animals. GFAP-IR astroglia in the right (R) injured- (A) and in the left (Lf) intact hemisphere (B). Scale bar: 400 µm. Bottom panels are the analyzed fields specified in (A) and (B). Scale bars: 100 µm; insets: 50 µm. Note typical reactive astrocytes with hypertrophic soma and processes (arrows) in the injured right hemisphere (especially in F1), but not in the left hemisphere or in intact animals.

Neither interaction among ‘side’ factor and the others (P ≥ 0.179), nor significant differences among groups (P = 0.759) were detected, suggesting no differences in GFAP-IR between medial and lateral sides of the wound.
Double or triple highly significant interactions were found among ‘environment’, ‘injury’, ‘field’ and ‘hemisphere’ factors (P < 0.01, in all cases).
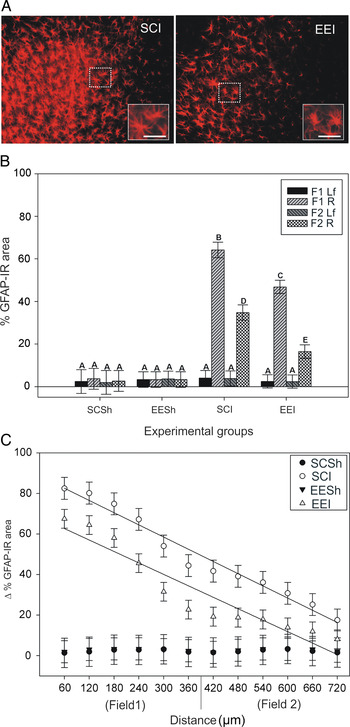
No effect of enrichment in the basal GFAP-IR was detected either in both hemispheres of intact animals (P = 1.000), or in the contralateral hemisphere of injured animals exposed to EE conditions (P = 1.000) (Fig. 3B).
Analysis of GFAP-IR astroglial reactivity in the perilesional cortex. (A) Right injured hemisphere from a representative SCI and EEI animal, corresponding to field 1 (close to the stab wound). Scale bars: 100 µm. Note that area of labeling in EEI is lower than in SCI. (B) % IR area in the experimental groups according to ‘environment’ condition (enriched, EE; standard, SC) and injury condition in the right hemisphere (R) (injured, I; sham, Sh), in sampling fields (F1 and F2). Left hemisphere is Lf. Values are shown as mean ± 2SEM (N SCSh = 3, N EESh = 5, N SCI = 6, N EEI = 7). Different letters indicate significant differences (Tukey's test, P < 0.05, see text for further description). (C) Simple linear regression curves in injured groups, of Δ% GFAP-IR area (mean ± 2SEM) according to the distance (μm) from wound (stripes) (P < 0.01). See also Table 1. Regression was not significant in sham groups.

Simple linear regression for Δ% GFAP-IR area = y0 + a × distance (see also Fig. 3C).

Values of regression coefficient (a), intercept (y0), the adjusted determination coefficient (R 2adjusted) and their confidence intervals (CI) obtained at 95% are shown.
aP < 0.05.
The lesion induced an increase in GFAP-IR in the injured hemisphere (right) in animals previously exposed to EE and also in those that were not exposed (SC pre-injury) (highly significant differences were detected in all comparisons, P < 0.01) (Fig. 3B). Comparison between field 1 (close to the lesion) and field 2 (contiguous to it, and further from the injury) showed highly significant differences (P < 0.01) in both environmental conditions, as a greater % GFAP-IR area was detected in the field closest to the wound (field 1) (Fig. 3B).
Exposure to EE conditions prior to injury produced a significantly lower postlesional reactive astroglial GFAP-IR-response in both fields belonged to the perilesional cortex(P < 0.01) (Fig. 3A,B).
Similar results were obtained for the standardized Δ% GFAP-IR area (i.e. values of the injured hemisphere standardized according to those of the contralateral intact hemisphere; see Methodology) (data not shown). In injured animals, simple linear regression tests were very significant in both environmental conditions (P < 0.01, in both cases), and data were adjusted to a linear function between the variables Δ% GFAP-IR area and distance (μm) (Fig. 3C; Table 1). Regression analysis applied to data obtained from sham animals was not significant in any of the two environmental conditions (P = 0.821, SCSh; P = 0.959, EESh). In injured groups, the negative regression coefficients indicate a reverse relationship between the variables, i.e. the larger the distance from wound (farther stripes), the lower the Δ% GFAP-IR area (Table 1). The differences between regression coefficients of SCI and EEI curves were not significant (P ≥ 0.05), suggesting that changes in GFAP-IR according to the distance from the injury were similar in both cases (Fig. 3C). However, significant differences between the confidence intervals belonging to the intercepts of both linear curves were detected (P < 0.05; Table 1), suggesting that exposure to EE conditions prior to injury produces a significantly lower postlesional reactive astroglial GFAP-IR-response in both fields (as it is also shown in Fig. 3A,B).
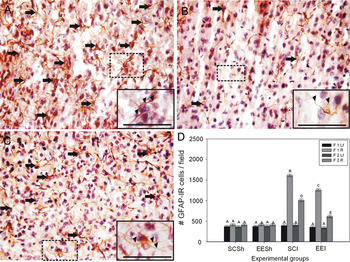
As significant differences between groups were observed in % GFAP-IR area according to environmental conditions, complementary quantification of GFAP-IR astrocytes was also performed in F1 and F2 of perilesional cortex. Results were similar to those obtained as a percentage of the GFAP-IR area, showing that although the signs of astrogliosis were apparently identical in all injured groups, the number of GFAP-IR astrocytes per field (astrocytosis) in the perilesional cortex was significantly lower in the EEI group (Fig. 4).
Analysis of astroglial reactivity by quantification of GFAP-IR astrocytes in the perilesional cortex. A representative subfield of F1 (close to the stab wound) is showed from the right hemisphere of an SCI animal (A), an SCSh animal (B) and an EEI animal (C). Note an increase in the number of GFAP-IR astrocytes (arrows) (i.e. astrocytosis) in both injured animals (SCI and EEI), and that astroglial processes (arrowheads) in them are thicker than those in the sham animal suggesting astrogliosis. Scale bars: 100 µm; insets: 60 µm. (D) Quantification of GFAP-IR astrocytes per field (i.e. F1 and F2) in the experimental groups in the right (R)- and left (Lf) hemisphere. Note that astrocytosis in EEI is lower than in SCI. Values are shown as mean ± 2SEM (N = 3 animals per group). Different letters indicate significant differences (Tukey's test, P < 0.05).

Reactive astrocytes II: vimentin
No interaction was detected among ‘side’ factor and the other factors (P ≥ 0.502), and no significant differences were detected among groups (P = 0.781), thus suggesting no differences in % vimentin-IR area between medial and lateral sides of the wound.
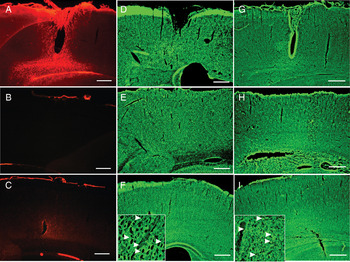
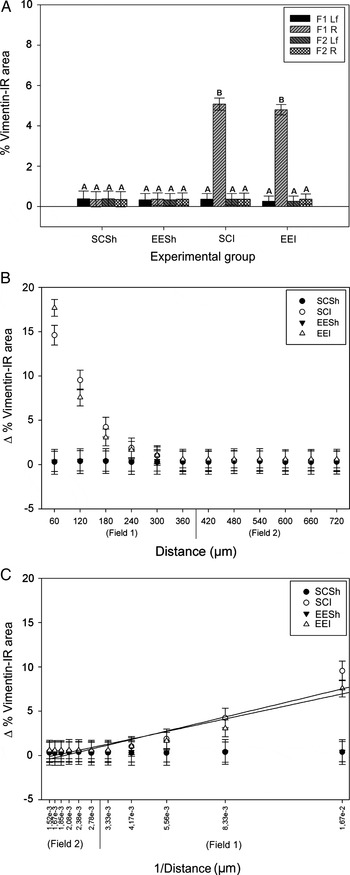
The lesion induced the local expression of vimentin-IR cells, but it was not found in the contralateral hemisphere or in intact animals (P < 0.01). Basal levels in intact animals and contralateral non-injured hemispheres did not differ among them (P ≥ 0.899) (Figs 5A–C and 6A). In this case, the environmental factor showed no interaction with any of the other factors, and differences among groups were not significant (P = 0.343). Hence, no effect of enrichment on baseline or on the vimentin-IR glial reaction induced by the cortical stab wound was found (Fig. 6A). In injured animals, very significant differences in vimentin-IR were detected between fields 1 and 2 in the injured hemisphere (P < 0.01), with levels in field 2 not exceeding baseline levels (P = 0.997), and vimentin-IR increase being restricted to field 1 (close to the wound) (Fig. 6A). Similar results were obtained for the standardized variable Δ% vimentin-IR area (data not shown). Simple linear regression tests for variables Δ% vimentin-IR area and distance (μm), were not significant for sham animals in both environmental conditions (P = 0.821, SCSh; P = 0.959, EESh). In injured animals, linear regression was significant in both conditions (P < 0.05; data not shown). However, the adjusted R 2 values suggest that the relationship between variables would be better explained by a first-order reciprocal function (Fig. 6B). There is a reverse relationship between the variables, i.e. the larger the distance from the wound (farther stripes), the lower the Δ% vimentin-IR area, which tends to a constant value of y0 (baseline). Data were adjusted to a linear function (see Methodology), and no significant differences were detected between regression coefficients of SCI and EEI (P ≥ 0.05), or between constants y0 (P ≥ 0.05) suggesting that changes in vimentin-IR regarding distance from the wound are similar in the perilesional cortex of both experimental groups (Fig. 6C; Table 2).
Vimentin- (A–C), EAAT1- (D–F) and ezrin-IR (G–I), in injured- (A,D,G) and contralateral hemisphere (B,E,H), and in sham animals (C,F,I).Arrowheads: either PAPs- or glutamate transporter aggregations, respectively. Scale bars: 400 µm; insets, 100 µm.

Analysis of vimentin-IR cellular reactivity in the perilesional cortex. (A) % IR area in the experimental groups according to ‘environment’ condition (enriched, EE; standard, SC) and the injury condition in the right hemisphere (R) (injured, I; Sham, Sh), in sampling fields (F1 and F2). Left hemisphere is Lf. Values are shown as mean ± 2SEM (N SCSh = 3, N EESh = 5, N SCI = 6, N EEI = 7). Different letters indicate significant differences (Tukey's test, P < 0.05, see text for further description). (B) Scatterplot of Δ% vimentin-IR area as a function of distance (μm) from wound (stripes) resulted in a reciprocal relationship between these variables: Δ% vimentin-IR area = y0 + a × 1/distance. (C) Simple linear regression curves in injured groups, from transformed data shown in (B), i.e. distance #= 1/distance (transformed variable) was very significant (P < 0.01). First stripe points were avoided in this graph in order to discern the x-axis values, but were included in regression analysis. See also Table 2. Regression was not significant in sham groups.

Simple linear regression for Δ% vimentin-IR are a = y0 + a × distance # (distance # transformed variable: 1/distance) (see also Fig. 6C).

Values of regression coefficient (a), intercept (y0), the adjusted determination coefficient (R 2adjusted) and their confidence intervals (CI) obtained at 95% are shown.
Astroglial glutamate transporters: EAAT1
Immunolabeling of astroglial glutamate transporter EAAT1 was uniform, regardless of injury or environmental conditions (Fig. 5D–F).
Results suggested no interactions between any of the factors (P ≥ 0.141), and no significant differences among groups, according to factor ‘side’ (P = 0.865) and ‘field’ (P = 0.188).
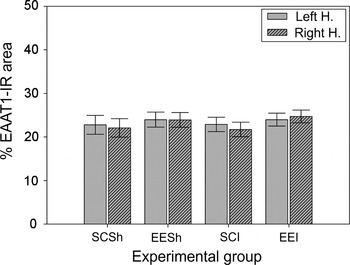
No significant differences were detected among experimental groups regarding injury (P = 0.835) and environmental conditions (P = 0.404), suggesting no effect on the % EAAT1-IR area (Fig. 7). Similar results were obtained from the standardized variable (i.e. Δ% EAAT1-IR area; data not shown). Simple linear regression tests for the variables Δ% EAAT1-IR area and distance (μm) were not significant in any of the cases of injured and sham animals (P ≥ 0.338), and no other relationship between them was detected (data not shown).
Analysis of EAAT1-IR glutamate transporters in the perilesional cortex, as % IR area in the experimental groups according to ‘environment’ condition (enriched, EE; standard, SC) and the injury condition in the right hemisphere (injured, I; Sham, Sh). Values from the left hemisphere are also shown. Values are shown as mean ± 2SEM. No significant differences were detected in any case (see text for further description).

Synaptic peripheral astroglial processes (PAPs): ezrin
Ezrin immunolabeling showed a typical distribution pattern in all experimental groups (Fig. 5G–I). There was no interaction between ‘side’ factor and the other factors (P ≥ 0.336), and no significant differences among groups according to this factor (P = 0.582), thus suggesting no differences between medial and lateral sides regarding ezrin-IR. In addition, there was no interaction between ‘field’ factor and the other factors (P ≥ 0.129), and no significant differences among groups according to this factor (P = 0.102).
Among ‘environment’, ‘injury’ and ‘hemisphere’ factors, double and triple significant interactions were detected (environment*injury, P < 0.01; environment*injury*hemisphere, P < 0.05).
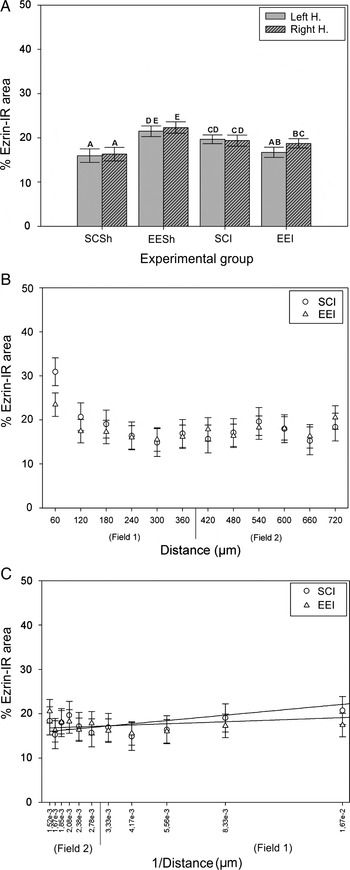
Environmental effects on basal ezrin-IR were found in both hemispheres, and very significant differences were detected between the % ezrin-IR area of intact animals exposed to EE (EESh) and that of intact animals not exposed to this condition (SCSh, P < 0.01, Fig. 8A). In animals placed in SCs, injury induced an increase in the % ezrin-IR area in both hemispheres (P < 0.05, for both hemispheres; Fig. 8A).
Immunolabeling analysis of PAPs in the perilesional cortex. (A) % Ezrin-IR area in the experimental groups according to ‘environment’ condition (enriched, EE; standard, SC), and the injury condition in the right hemisphere (injured, I; Sham, Sh). Values from the left hemisphere are also shown. Values are shown as mean ± 2SEM (N SCSh = 3, N EESh = 5, N SCI = 6, N EEI = 7). Different letters indicate significant differences (Tukey's test, P < 0.05, see text for further description). (B) Scatterplot of Δ% ezrin-IR area as function of distance (μm) from wound (stripes), in injured groups, resulted in a reciprocal relationship between these variables: Δ% ezrin-IR area = y0 + a × 1/distance. (C) Simple linear regression curves in injured groups, from transformed data shown in (B), i.e. distance #= 1/distance (transformed variable), were very significant (P < 0.01). First stripe points were avoided in this graph in order to discern the x-axis values, but were included in regression analysis. See also Table 3. Regression was not significant in sham groups (not shown).

Simple linear regression for Δ% ezrin-IR are a = y0 + a × distance # (distance # transformed variable: 1/distance) (see also Fig. 8C).

Values of regression coefficient (a), intercept (y0), the adjusted determination coefficient (R 2adjusted) and their confidence intervals (CI) obtained at 95% are shown.
aP < 0.05.
In the injured group exposed to EE condition (EEI), there was no effect of the lesion on the contralateral hemisphere (P ≥ 0.225, compared with the SCSh group). In the injured hemisphere of the EEI group, immunolabeling was similar to that found in the injured group placed in standard conditions (SCI, P = 0.163), and levels were significantly lower than those detected in intact animals exposed to enrichment (EESh, P < 0.01; Fig. 8A). This means that the injury significantly decreased the % ezrin-IR area when comparing with that found after EE exposure in the intact group (EESh). Effects of both the injury and the enrichment were detected in the contralateral (left) hemisphere (i.e. environment*injury*hemisphere factors had a significant interaction: P < 0.05). Therefore, data standardizations between left and right hemispheres (Δ% ezrin-IR area) were not made in this case because effects would be hidden. Simple linear regression tests were not significant in any of the experimental groups (P ≥ 0.10). However, in injured animals (SCI and EEI), the relationship between variables % ezrin-IR area and distance (from wound) would be explained by a reciprocal function of first order (Fig. 8B). For a better visualization of the curves, data from sham animals were not shown in this case. An inverse relationship was found between the variables, i.e. the larger the distance from wound (farther stripes), the lower the % ezrin-IR area, which leads to the y0 constant value (data not shown). Data were adjusted to a linear function, and simple linear regression tests of the transformed variable were significant (P < 0.05; Fig. 8C; Table 3). Regression coefficient of EEI resulted lower than that of SCI (P < 0.05), suggesting that the mean change (decrease) in % ezrin-IR area per each unit increase of distance (stripe) from wound in EEI group is lower than that in the SCI group. No significant differences were detected between the constant y0 confidence intervals (Table 3).
CONCLUSIONS
• Both BrdU incorporation and endogenous Ki-67 labeling were restricted to the scar tissue and were not found in the perilesional cortex of any group.
• The GFAP-IR postlesional astrocytosis in the perilesional cortex was significantly lower in the animal group exposed to EE than in the animal group not exposed to EE during postnatal development.
• EE effect on ‘basal’ ezrin-IR (sham rats) was found in both hemispheres, and was significantly higher than on injured rats.
• No EE effects were found on either % EAAT1- or vimentin-IR area.
DISCUSSION
Neuronal death secondary to injury, and the cellular and molecular events that cause it, also contribute to produce an environment unfavorable for axonal growth in the injured and surrounding area, regarding the glial scar and the glial reactivity itself as obstacles to new connections or to the repair of damaged ones (Johnson, Reference Johnson1993; Bähr et al., Reference Bähr and Bonhoeffer1994; Fawcett and Asher, Reference Fawcett and Asher1999; Lanosa and Colombo, Reference Lanosa and Colombo2008). Since the glial scar consists mainly of astrocytes (Lindsay, Reference Lindsay, Fedoroff and Vernadakis1986) that display positive and negative aspects in terms of restoration processes of the neuropil, secondary neuronal death and axonal regeneration may be controlled with strategies aimed at regulating glial reactivity. In this sense, EE paradigm may provide the possibility to develop strategies to promote neural tissue regeneration or protection. This study showed that exposure to EE conditions prior to a stab wound in the visual cortex of rats modulates essential components of postlesional astroglial reaction in the perilesional cortex, such as those found in astroglial cytoskeletal proteins: GFAP – a specific component of intermediate filaments, and ezrin – a component of PAPs involved in the synapse regulation (Derouiche and Frotscher, Reference Derouiche and Frotscher2001). Both components are extremely important for astroglial function in normal and pathological conditions. Since it has been reported that a lesion produces dynamic changes in the adjacent non-damaged cortex (Johansson, Reference Johansson2000) suggesting tissue reorganization, the analysis was performed on the perilesional cortex, which would provide more adequate grounds than the scar site for the analysis of EE effects.
The stab wound applied to the visual cortex of rats induced a typical astroglial GFAP-IR-reaction, characterized by hypertrophy of the soma and cellular processes, and an increase in the number of astrocytes IR to GFAP in the perilesional cortex (i.e. astrocytosis; see Figs 2 and 4). These would be pre-existing astrocytes, since no BrdU- or endogenous Ki-67-IR nuclei were found in the analyzed perilesional cortex, but rather they were restricted to the scar. Only few labeled nuclei were detected farther away from the perilesional zone, and were associated with cortical blood vessels. Therefore, no signs of proliferation were found in those perilesional ‘reactive’ GFAP-IR areas that expanded up to ~500 µm from the wound edge. Accordingly, evidence from several researchers suggests that there are rather few proliferating astrocytes at the lesion site, and that the increase in reactive astrocytes would be mainly due to the migration of nearby cells, or the acquisition of postlesional GFAP-IR in resident cells, e.g. by increased GFAP expression or increased GFAP epitopes availability for their detection with a specific antibody (Miyake et al., Reference Miyake, Hattori, Fukuda, Kitamura and Fijita1988; Eng and Ghirnikar, Reference Eng and Ghirnikar1994; Amat et al., Reference Amat, Ishiguro, Nakamura and Norton1996).
Vimentin-IR glial reaction was circumscribed to the edges of the wound (~150 µm), as it generally occurs (Schiffer et al., Reference Schiffer, Giordana, Migheli, Giaccone, Pezzotta and Mauro1986; Calvo et al., Reference Calvo, Carbonell and Boya1991; Wang et al., Reference Wang, Bekar, Furber and Walz2004), with no overlap with proliferation markers present at the scar site. No effects of EE were detected on vimentin-IR glia. For this reason, no complementary vimentin-IR cells quantification was carried out. In fact, other authors have already described it at the site of injury and the perilesional zone (e.g. Hampton et al., Reference Hampton, Rhodes, Zhao, Franklin and Fawcett2004).
Interestingly, although the signs of astrogliosis were rather similar in all injured groups, postlesional reactive GFAP-IR astrocytosis was significantly lower in the group of animals exposed to EE during postnatal development (i.e. from 21 days of age until young adulthood; see photographs in Figs 3A and 4). Since hypertrophic GFAP-IR astrocytes occurring after a cortical injury generally express proteoglycans that inhibit neurite initiation, adhesion, growth and guidance (Bovolenta et al., Reference Bovolenta, Wandosell and Nieto-Sampedro1993, Reference Bovolenta, Fernaud-Espinosa, Méndez-Otero and Nieto-Sampedro1997; Nieto-Sampedro, Reference Nieto-Sampedro1999), a dynamic equilibrium appears to exist between astroglial events that are positive and negative for regeneration. Thus, functional repair and/or protection of the CNS neuropil may include promoting processes that modulate astroglia reactivity. In this context, present results suggest that pre-injury EE exposure would be relevant as a possible strategy for protection. Yet, further analysis regarding neuronal aspects would be required. Although EE exposure did not affect GFAP-IR baseline in sham animals, changes in the % ezrin-IR area were detected in this group, which clearly reveals an increase in this astroglial protein involved in the tripartite synapse. There is a general consensus among researchers studying this protein, that astrocytes specifically express ezrin. For example, Grönholm et al. (Reference Grönholm, Teesalu, Tyynelä, Piltti, Böhling and Wartiovaara2005) reported that in brain tissue and cell cultures, merlin – another ERM protein – was predominantly found in neurons while ezrin was specifically expressed in astrocytes. Moreover, ezrin-IR specificity for astrocytes and ependymal glia in the normal brain was reported also by other groups (Geiger et al., Reference Geiger, Stoldt, Schlote and Derouiche2000; Derouiche and Frotscher, Reference Derouiche and Frotscher2001; Derouiche et al., Reference Derouiche, Anlauf, Aumann, Mühlstädt and Lavialle2002; Emirandetti et al., Reference Emirandetti, Graciele Zanon, Sabha and de Oliveira2006; Lavialle et al., Reference Lavialle, Aumann, Anlauf, Pröls, Arpin and Derouiche2011). In addition, it is worth mentioning that no overlapping visualization between GFAP and ezrin proteins occurs (Derouiche and Frotscher, Reference Derouiche and Frotscher2001). Therefore, we assumed that the ezrin-IR in our study is related to astroglial cells. In addition, visualization of these PAPs is only possible under ultrastructural procedures (i.e. electronic microscopy, Derouiche et al., Reference Derouiche, Anlauf, Aumann, Mühlstädt and Lavialle2002). Thus, this labeling is impossible to be quantified as ‘individual cells’. For this reason, we based our conclusions in the analysis of the % ezrin-IR area.
In the present study, this component of the ‘astroglial plasticity’ would be modulated by the exposure of animals to EE conditions, which also may induce changes in neuronal components of the cortical neuropil, as reported by authors mentioned above. We speculate that the increase in % ezrin-IR area in the visual cortex of rats exposed to EE may have been driven by the new synapses formation or enhancement of astroglial involvement in the existing ones (Jones and Greenough, Reference Jones and Greenough1996) – or both – which remains to be elucidated.
The injury also induced an increase of ezrin-IR, which is in accord with a previous work of Emirandetti et al. (Reference Emirandetti, Graciele Zanon, Sabha and de Oliveira2006), who reported that ezrin expression increased in reactive astrocytes. However, it should be noted that in the injured group exposed to EE (EEI), the lesion significantly decreased the ezrin-IR, which would be expected to be induced by the EE condition. This result becomes evident when comparing the labeling area from this group with that from sham animals exposed to EE (EESh), suggesting that the effect of the injury ‘interfered’ with the effect of EE on the ezrin-IR, when both treatments were applied together in the experimental group (i.e. EEI group; the interaction between environment*injury factors was significant). As levels surpassing the baseline found in sham animals, this decrease should not be associated with tissue loss due to cortical injury. Alternatively, the observed effect would be related to the lower postlesional reactive GFAP-IR-astrocytosis found in the group of animals exposed to EE during postnatal development. This means that while increased synapse formation in EE conditions may in part be responsible for the increase of ezrin-IR, astroglial reactivity may encompass more complex phenomena regarding cellular interactions and cytokines' functions (e.g. Raivich et al., Reference Raivich, Bohatschek, Kloss, Werner, Jones and Kreutzberg1999).
The increase in postlesional concentration of excitatory aminoacids up to excitotoxic levels and the subsequent increase in intracellular Ca2+ concentrations are some of the events leading to secondary neuronal death (Tator and Fehlings, Reference Tator and Fehlings1991). The role of the astroglial glutamate transporter EAAT1 in a postlesional context would be important, since astrocytes could balance the glutamate cytotoxic effect through its uptake from the extracellular medium (Beschorner et al., Reference Beschorner, Dietz, Schauer, Mittelbronn, Schluesener and Trautmann2007). However, no effects of EE or injury on EAAT1-IR were found in the experimental times used in this study. Perhaps, changes in this astroglial component would occur at the transporter functional level or over longer time periods after cortical damage.
In conclusion, this study analyzed astroglial events associated with reactive and perisynaptic changes subsequent to injury, when preceded by a period of EE. While astrogliosis was present in all injured groups, GFAP-IR postlesional astrocytosis in the perilesional cortex was significantly lower in the animal group exposed to EE during postnatal development, suggesting a possible positive impact of this condition on postlesional reorganization processes, since it led to minimize the astroglial reactive response. This GFAP-IR reaction seems to correspond to existing astroglia, since there was no evidence of proliferation (BrdU incorporation or endogenous Ki-67 labeling) in the perilesional cortex. Furthermore, increase in ezrin-IR area in the visual cortex of rats exposed to EE condition may have been driven by astroglial plasticity events (e.g. the formation of new synapses or enhancement of astroglial involvement in the existing ones). The injury ‘interfered’ with the effect of EE on ezrin-IR, when both treatments were applied together.
These results suggest that exposure to EE conditions prior to injury could modulate postlesional reactive astroglial components in the rat cerebral cortex.
ACKNOWLEDGEMENTS
The authors are grateful to Sebastian Lipina, Ph.D., for his suggestions about environmental enrichment condition design. Administrative and technical support by Beatriz Stuto (CONICET) and Cristina Juarez (CONICET) is also gratefully acknowledged. The authors are also grateful to Mss. Valeria Melia for the English proofreading of the manuscript, and to Mr. Maximiliano Neme and Mr. Diego Alvarez (Leloir Institute, Buenos Aires, Argentina) for their most valuable collaboration in capturing confocal images of Fig. 1. Support was provided by FONCYT (PICT 0694/2006), Fundación Conectar.
Statement of interest
None.
Supplementary material
The supplementary material referred to in this article can be found online at journals.cambridge.org/ngb.