Implications
This study reports on a genomic dissection and prediction of feed efficiency traits (FETs) using a longitudinal model in F2 chickens. Results show that two genomic regions are significantly associated with feed intake (FI), and provide important insights into single nucleotide polymorphism (SNP) effects as well as into the candidate genes involved in the genetic architecture of FI.
The estimated breeding value (EBV) predictions obtained using pedigree-based best linear unbiased prediction (ABLUP) were compared with those based on genomic best linear unbiased prediction (GBLUP) using leave-one-out cross-validation. The results of this comparison show that genomic prediction founded on a genome-based estimate of breeding values (GEBVs) using longitudinal random regression model is a valuable approach for predicting FETs, and leads to enhanced genetic gain.
Introduction
Because the cost of feed makes up a major portion of total poultry production expenses, feed efficiency is a very important component of the selection goals of breeding programs. Improving feed efficiency has a major impact on cost reduction, as well as upon the environmental impacts of poultry production (Hume et al., Reference Hume, Whitelaw and Archibald2011). Genetic improvements in residual feed intake (RFI) provide one key to improving prediction of feed efficiency because this trait is moderately heritable and, ideally, independent of production traits (Kennedy et al., Reference Kennedy, Van de Werf and Meuwissen1993; Emamgholi Begli et al., Reference Emamgholi Begli, Vaez Torshizi, Masoudi and Ehsani2016).
Advances in DNA chip technology in recent years have enabled a number of genome-wide association (GWA) studies as well as prediction of breeding values using high-density SNP markers. The purpose of poultry GWA studies is to identify genes related to important traits and thus improve the accuracy of EBV and increase our knowledge of the biological mechanisms that underlie selection response (Guo et al., Reference Guo, Jorjani and Carlborg2012).
To date, a number of studies have been carried out to detect quantitative trait loci (QTLs) and the candidate genes that influence FETs at specific chicken ages (Van Kaam et al., Reference Van Kaam, Groenen, Bovenhuis, Veenendaal, Vereijken and Van Arendonk1999; De Koning et al., Reference De Koning, Haley, Windsor, Hocking, Griffin, Morris, Vincent and Burt2004). In addition, longitudinal models that describe trajectories of FI, RFI and growth provide further insights into the genetic basis of variation in feed efficiency and the dynamics of genetic variation as birds age. Indeed, both GWA and genomic or genome-wide selection (GS) studies are promising breeding tools for inferring the underlying genetic architecture and increasing rates of genetic gain (Zhang et al., Reference Zhang, Zhang and Ding2011). With this in mind, there are several advantages to the longitudinal analysis of genetic data, including the ability to account for age, time-dependent environmental effects, heterogeneity of marker effects over time (i.e. age), and to model a variety of age trajectory curves (Kerner et al., Reference Kerner, North and Fallin2009; Howard et al., Reference Howard, Jiao, Tiezzi, Huang, Gray and Maltecca2015). In addition, longitudinal data analysis is advantageous for detecting the genes that affect trajectories, rather than simply differences in phenotypic values (Kerner et al., Reference Kerner, North and Fallin2009).
Although several studies to date have shown that the accuracy of genomic prediction is high in cattle (Lund et al., Reference Lund, de Roos, de Vries, Druet, Ducrocq, Fritz, Guillaume, Guldbrandtsen, Liu, Reents, Schrooten, Seefried and Su2011; Saatchi et al., Reference Saatchi, McClure, McKay, Rolf, Kim, Decker, Taxis, Chapple, Ramey, Northcutt, Bauck, Woodward, Dekkers, Fernando, Schnabel, Garrick and Taylor2011), sheep (Daetwyler et al., Reference Daetwyler, Swan, van der Werf and Hayes2012), pig (Lillehammer et al., Reference Lillehammer, Meuwissen and Sonesson2011) and chickens (Liu et al., Reference Liu, Qu, Luo, Shu, Wang, Lund and Su2014), these have all been based on calculations at single time-points. A longitudinal analysis will prove more informative if there is substantial variability over time or if the effects of SNPs change over time (Diggle et al., Reference Diggle, Heagery, Liang and Zeger2002). Kang et al. (Reference Kang, Zhou, Mrode, Zhang and Liu2016) have found that a single-step random regression test-day model showed advantages compared with GBLUP and indicated better persistency of accuracy over generations. Also, a study by Wolc et al. (Reference Wolc, Arango, Settar, Fulton, O’Sullivan, Preisinger, Fernando, Garrick and Dekkers2013) used real layer chickens data, and reported that random regression reduced animal model based on genomic information can improve substantially the accuracy of selection for trajectory traits.
For chickens, there is lack of investigation about longitudinal genomic model on FI and RFI. Therefore, the objectives of this research were to perform a GWA study on weekly FI and RFI using random regression coefficients to describe the random curves of these variables in F2 chickens, and to evaluate the accuracy of EBVs generated by pedigree and genomic predictions using a genome-based estimate of breeding values (GEBV).
Material and methods
Experimental design and data collection
The birds used for this research were derived from a two-generation inter-cross between a fast-growing broiler male Arian line (AA) and Iranian indigenous fowl (NN). Thus, F1 birds were generated from the mating of AA♂×NN ♀ and NN ♂×AA ♀ birds; each F1 male resulting from a reciprocal cross was then mated to between four and eight females from other families, resulting in a total of 312 chickens in the F2 generation. These birds were genotyped using the Illumina Chicken 60K SNP (see the ‘Acknowledgements’section), with all SNP typing carried out at Genoskan A/S, Tjele, Denmark. Marker quality control was achieved by deleting SNPs with a call rate <95%, a minor allele frequency <5%, and a Hardy–Weinberg equilibrium test P-value<1×10⁻⁶. As a result of these procedures, we retained 43 188 SNPs, while a few missing genotypes were imputed using the Beagle software (Browning and Browning, Reference Browning and Browning2009).
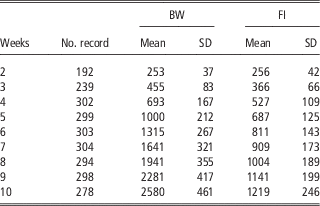
All birds were caged together for the 1st week of their lives, before being housed individually from the 2nd to the 10th weeks. We recorded weekly FI and BW of all birds from 2 to 10 weeks of age. Means and SD of the FI and BW traits used for RFI estimation are presented in Table 1.
Descriptive statistics of phenotypic data for the F2 chicken population

BW, body weight; FI, feed intake.
Statistical analyses
Mixed model with single marker effects
We analysed the association between SNPs and phenotypes using a spline regression model, run separately for each marker. Thus, variance and covariance components for FI and RFI were calculated using the spline regression model outlined by Emamgholi Begli et al. (Reference Emamgholi Begli, Vaez Torshizi, Masoudi and Ehsani2016), with a general model for FI defined as follows:
 $$\eqalignno{ y_{{ijkl}} \,{\equals}\,&{\rm Sex}_{j} {\plus}{\rm Hatch}_{k} {\plus}{\rm Week}_{l} {\plus}\mathop{\sum}\nolimits_{s\,{\equals}\,1}^q {b_{{1s}} \left( {m_{i} \varphi \left( {l,s} \right)} \right)} \cr&{\plus}\mathop{\sum}\nolimits_{s\,{\equals}\,1}^q {\alpha _{{is}} \varphi \left( {l,s} \right)} {\plus}\mathop{\sum}\nolimits_{s\,{\equals}\,1}^q {\gamma _{{is}} \varphi } \left( {l,s} \right){\plus}e_{{ijkl}} $$
Similarly, the model for RFI was as follows:
 $$\eqalignno{ y_{{ijkl}} \,{\equals}\,&{\rm Sex}_{j} {\plus}{\rm Hatch}_{k} {\plus}{\rm Week}_{l} {\plus}b_{2} \left( {mbw_{{ijkl}} } \right){\plus}b_{3} \left( {wg_{{ijkl}} } \right)\cr&{\plus}\mathop{\sum}\nolimits_{s\,{\equals}\,1}^q {b_{{1s}} } \left( {m_{i} \varphi \left( {l,s} \right)} \right) {\plus}\mathop{\sum}\nolimits_{s\,{\equals}\,1}^q {\alpha _{{is}} \varphi \left( {l,s} \right)} \cr &{\plus}\mathop{\sum}\nolimits_{s\,{\equals}\,1}^q {\gamma _{{is}} \varphi \left( {l, s} \right)} {\plus}e_{{ijkl}} $$
In these expressions, y
ijkl
denotes the FI record of the ith chicken of sex j, born in hatch class k, and measured in week l. Each model was run for each marker separately, with sex, hatch, and week as fixed effects. Indeed, of these, hatch is considered to be a fixed contemporary group effect adjusting for common environment and influencing a group of birds hatched on the same date and managed in the same contemporary group. The mbw
ijkl
and wg
ijkl
denote metabolic BW (BW0.75) and BW gain per week (g), whereas φ(1,s) denotes the sth coefficient of the β-spline function evaluated at week l, m
i
is the value of the SNP (0, 1, 2) for each individual i, and α
is
, and γ
is
are random regression coefficients for additive direct and permanent environmental effects of the ith chicken given each spline parameter, respectively. Similarly, b
1s
, b
2
and b
3
denote the regression coefficients of SNP for the sth coefficient of the β-spline, metabolic BW, and BW gain, respectively, while the assumptions made in relation to vectors α, γ and e are that they conform to a normal distribution such that
 $E\, ( \alpha )\,{\equals}$
$E\,( \gamma )\,{\equals}\, E( e )\,\,{\equals}\,\,0,{\rm Var}\, ( \alpha )\,{\equals}\,{\mib{G}} _{0} \,\otimes\,{\mib{A}} ,{\rm Var}\,( \gamma )\,{\equals}\,{\mib{P}} \,\otimes\,{\mib{I}} ,{\rm and}$
${\rm Var}\, ( e )\,{\equals}\,{\mib{R}} $
, with zero covariances between a and γ.
G
0 and
P
denote the matrices of variance and covariance between the random regression coefficients for additive genetic and permanent environmental effects on chickens, respectively, while
A
denotes the additive genetic relationship matrix, and
R
denotes a diagonal matrix comprising residual variances assumed to be different in each measurement week.
We fitted random regression for FI using a three-knot linear spline. Knots were located at 2, 6 and 10 weeks of age for the FI trait based on preliminary results of multiple trait analysis, while a quadratic spline model for the RFI trait was created containing four knots placed at 2, 5, 7 and 10 weeks of age. The SNP effect on weekly FI and RFI was obtained as the β-spline function for the lth week. The variance due to a single SNP
 $$\left( {\sigma _{i}^{2} } \right)$$
was estimated as
 $$2p_{i} \left( {1{\minus}p_{i} } \right)u_{i}^{2} $$
, where, p
i
is the frequency of the ith SNP marker effect and u
i
is the ith allele substitution effects of the SNP. This estimate was carried out in DMU software.
The genome-wide significance threshold was set at P=(0.05/N), N denotes the number of SNP loci included in the analysis, and a false discovery rate of 0.05 was also applied (Benjamini and Hochberg, Reference Benjamini and Hochberg1995).
Genomic prediction
Estimated breeding values/GEBVs were determined on the basis of ABLUP and GBLUP (Meuwissen et al., Reference Meuwissen, Hayes and Goddard2001) using the DMUAI module in the DMU software package (Madsen and Jensen, Reference Madsen and Jensen2013). Of these, ABLUP applies a numerator relationship matrix ( A ) that is based on pedigree information, while the genomic relationship matrix ( G ) and its inverse used in GEBV predictions were obtained using the G-matrix software package (Su and Madsen, Reference Su and Madsen2012). The genomic relationship matrix was defined as G = MM ’/Σ2p i q i . In this expression, p i and q i refer to the frequencies of alleles 1 (A1) and 2 (A2) at locus i, respectively, whereas M refers to the matrix n×m (i.e. n=number of animals and m=number of marker loci) for a specified SNP genotype coefficient at each locus. The coefficients for the ith column in the M matrix were 0 to 2p i for genotype A1A1, 1 to 2p i for genotype A1A2, and 2 to 2p i for genotype A2A2. The resultant model for the FI trait was as follows:
 $$\eqalignno{ y_{{ijkl}} \,{\equals}\,&{\rm Sex}_{j} {\plus}{\rm Hatch}_{k} {\plus}{\rm Week}_{l} {\plus}\mathop{\sum}\nolimits_{s\,{\equals}\,1}^q {\alpha _{{is}} \varphi } \left( {l,s} \right)\cr&{\plus}\mathop{\sum}\nolimits_{s\,{\equals}\,1}^q {\gamma _{{is}} \varphi } \left( {l,s} \right){\plus}e_{{ijkl}} $$
For the RFI trait, the resultant model was as follows:
 $$\eqalignno{ y_{{ijkl}} \,{\equals}\,&{\rm Sex}_{j} {\plus}{\rm Hatch}_{k} {\plus}{\rm Week}_{l} {\plus}b_{2} \left( {mbw_{{ijkl}} } \right)\cr &{\plus}b_{3} \left( {wg_{{ijkl}} } \right){\plus}\mathop{\sum}\nolimits_{s\,{\equals}\,1}^q {\alpha _{{is}} \varphi } \left( {l,s} \right) \cr & {\plus}\mathop{\sum}\nolimits_{s\,{\equals}\,1}^q {\gamma _{{is}} \varphi } \left( {l, s} \right){\plus}e_{{ijkl}} $$
The components of these equations are the same as explained above. Approximately 15% of the chickens were randomly assigned to a validation panel in which predictions would be made, whereas the remaining 85% were used as the training panel to train the model used for prediction. Thus, the accuracy of expected pedigree (EBV) and GEBV for each weekly age were calculated as a correlation between EBV and GEBV from cross validations and phenotypes corrected for the fixed effects of sex, hatch and age. Correlations between EBVs and GEBVs with corrected phenotypes were then divided by the square root of heritability, estimated by using the pedigree of all animals recorded between the 2nd and 10th week. Finally, regression of adjusted phenotypic values on GEBV and EBV was used to test for potential bias. Standard errors of accuracy and bias of prediction were computed by considering the results of replicates available in each situation.
Results
We used chickens with both FI trait phenotypes and genotypes as the basis for an association analysis, applying a single SNP regression approach on spline coefficients. The final SNP set contains 43 133 SNPs for GWA analysis. The results of this analysis (Table 2) demonstrated that two significant SNPs, RS15990764 and RS15990798, were detected on q 2 (the second segment) for the FI trait, and that these SNPs also were associated with the 5th week. The significant SNPs explained 1.95% (SE=0.03) of the phenotypic variance.
QTL regions determined for FI trajectory parameters

q 2, regression coefficient is the second part (q 2); MAF, minor allele frequency; FDR, false discovery rate.
The most significant of these SNPs, RS15990764, was also detected for the 6th week FI (P<1.19E−07) located on the SNCAIP gene, which encodes a protein containing several protein-protein interaction domains, including ankyrin-like repeats, a coiled-coil domain and an ATP/GTP-binding motif (www.ncbi.nlm.nih.gov/gene).
Accuracy and bias of genomic selection
Feed intake
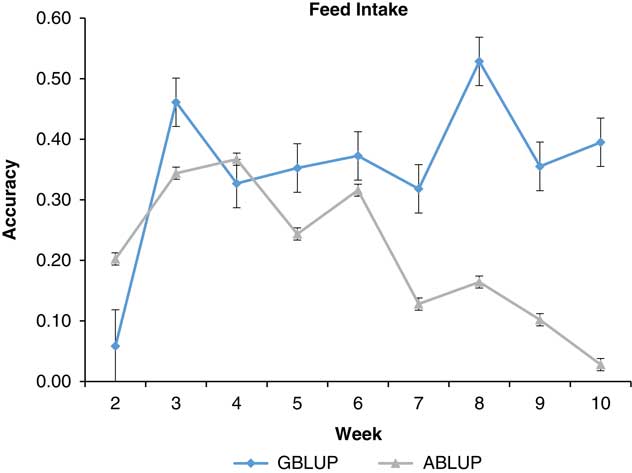
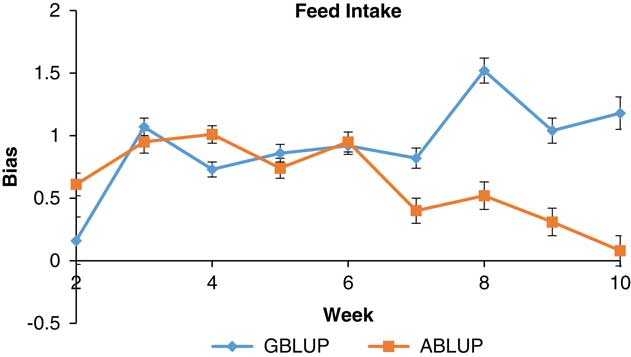
Correlations between EBV, GEBV and the corrected phenotypes for the validation individuals are shown in Figure 1 as a function of test week. These results show that the accuracy of GEBV in the 2nd week was low compared with other weeks. Bias evaluations of ABLUP and GBLUP for FI traits are plotted in Figure 2; these results also show that the regression coefficient for the 2nd week was low, while correlations between cross-validation genomic and corrected phenotypic values were between 0.06 (0.01) and 0.46 (0.01). The highest accuracies for GEBV and EBV were 0.46 (0.01) during week 3 and 0.37 (0.06) during week 4, respectively, while in general, GEBV accuracies for the FI trait were higher than those for EBV accuracies obtained using ABLUP between the 3rd and 10th weeks (Figure 1).
(colour online) Correlation between estimated breeding values (EBVs) and phenotypes for feed intake in the F2 chicken population. These predictions were based on a random regression model that utilized pedigree-based best linear unbiased prediction (ABLUP) and genomic best linear unbiased prediction (GBLUP) relationship matrices.

(colour online) Evaluation of bias in the pedigree-based best linear unbiased prediction (ABLUP) and genomic best linear unbiased prediction (GBLUP) relationship matrices for the feed intake trait in the F2 chicken population. A value of 1.0 indicates the absence of bias.

Residual feed intake
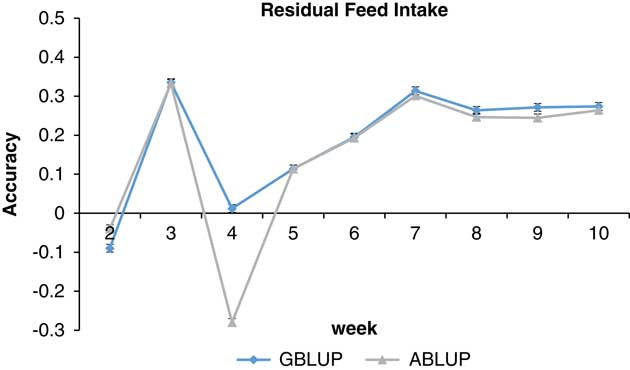
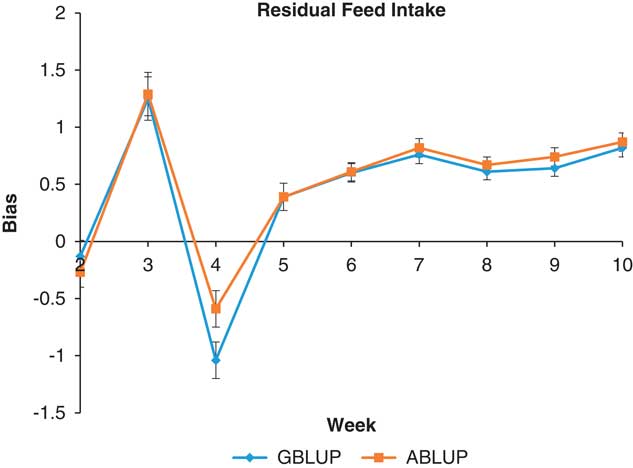
Accuracies and regression coefficients (bias) for the RFI trait are presented in Figures 3 and 4, respectively. Correlation between cross-validation prediction and corrected phenotypic values was low in the 2nd week, similar to estimates for FI, while on the basis of genomic data, correlations between cross-validation genomic prediction and corrected phenotypic values were between −0.09 (0.01) and 0.33 (0.01) for the RFI trait between the 2nd and 10th weeks (Figure 3). Prediction accuracies based on ABLUP were lower than those based on GBLUP, with the exception of the 2nd week, whereas regression coefficients (Figure 4) ranged from −1.04 (0.16) to 1.25 (0.19) for ABLUP and from −0.59 (0.16) to 1.29 (0.19) for GBLUP. At the same time, predictions based on GBLUP appear to be slightly less biased than those based on ABLUP, although the increase in accuracy of genomic methods over ABLUP was not uniform either across time or traits, while GBLUP accuracies were more stable for both traits.
(colour online) Correlation between estimated breeding values (EBVs) and phenotypes for residual feed intake in the F2 chicken population. These predictions were based on a random regression model that utilized ABLUP and genomic best linear unbiased prediction (GBLUP) relationship matrices.

(colour online) Evaluation of bias in the pedigree-based best linear unbiased prediction (ABLUP) and genomic best linear unbiased prediction (GBLUP) relationship matrices for the residual feed intake trait in the F2 chicken population. A value of 1.0 indicates the absence of bias.

Discussion
To our knowledge, this is the first GWA study to investigate the common genetic variants of FETs that employs longitudinal data from 2- to 10-week-old chickens. The purpose of this study was to identify the causal mutations for chicken FI and RFI traits in order to accelerate genetic improvements. We also investigated the possibility of using genomic selection for FI and RFI via a longitudinal random regression spline model. Our analysis of longitudinal data enables a clearer understanding of the trajectory of studied traits as well as the potential interactions not considered at particular points in time (Smith et al., Reference Smith, Chen, Kähönen, Kettunen, Lehtimäki, Peltonen, Raitakari, Salem, Schork, Shaw, Srinivasan, Topol, Viikari, Berenson and Murray2010). Results show that genomic information analysed using random regression models can aid in the identification of genomic regions associated with curve shapes and can be utilized to increase power to detect associations in GWA studies (Howard et al., Reference Howard, Jiao, Tiezzi, Huang, Gray and Maltecca2015; Sitlani et al., Reference Sitlani, Rice, Lumley, McKnight, Cupples, Avery, Noordam, Stricker, Whitsel and Psaty2015).
Genome-wide association studies
Feed intake
The discovery of variants associated with SNPs on the basis of age interaction effects provides an opportunity to measure FI at selected times and reduce testing costs. In addition, determining time-dependent variation will allow for the enhanced prediction of future outcomes. Our results demonstrate that two significant SNPs for FI were found on the SNCAIP gene, and that this region were significantly associated with spline coefficients (q 2) at 5 and 6 weeks of age (Table 2). Indeed, because these SNPs are located close to each other (i.e. Z: 81 077 636 and Z: 81 100 766), this region is likely to contain a single QTL for this trait. Synucleins are a protein family expressed in neural tissue as well as in certain human tumours and include α-,β-, and γ-forms. Although mutations in α-synuclein are associated with Parkinson’s and Alzheimer’s diseases in humans (George, Reference George2001), these proteins have not been functionally characterized in chickens. However, we know that synphilin-1 is a protein encoded by the SNCAIP gene (Engelender et al., Reference Engelender, Kaminsky, Guo, Sharp, Amaravi, Kleiderlein, Margolis, Troncoso, Lanahan, Worley, Dawson, Dawson and Ross1999) that has been shown to interact with α-synuclein. Because the results of several studies have suggested that synphilin-1 plays a novel role in the control of BW and FI in both flies and mice (Li et al., Reference Li, Tamashiro, Liu, Bello, Wang, Aja, Bi, Ladenheim, Ross, Moran and Smith2012; Liu et al., Reference Liu, Li, Yang, Ma, Moran and Smith2012), this protein is likely to be involved in controlling the latter in poultry.
The results of this study also show that the effects of gene(s) on FI in chickens may not be consistent across different ages. Indeed, because significant SNPs were found within just 2 weeks of the test period, we expect that different metabolic pathways are responsible for FI at different times. Because in a previous study, Howard et al. (Reference Howard, Jiao, Tiezzi, Huang, Gray and Maltecca2015) showed that detection regions across regression coefficients can aid in the characterization of genetic antagonisms between the regions of trait trajectories over time, the effects of specific genes on FETs may be inconsistent over time, as highlighted in this research.
Residual feed intake
The results of our GWA study demonstrate that no SNP is significantly associated with RFI in F2 chickens. These results indicate that RFI is influenced by a number of genes that exert small effects and limit the detection power of this research. Similar results for the RFI have previously been reported in cattle and pigs (Onteru et al., Reference Onteru, Gorbach, Young, Garrick, Dekkers and Rothschild2013; Santana et al., Reference Santana, Utsunomiya, Neves, Gomes, Garcia, Fukumasu, Silva, Oliveira Junior, Alexandre, Leme, Brassaloti, Coutinho, Lopes, Meirelles, Eler and Ferraz2014); because the research reported here was undertaken on an F2 population comprising a small sample size of animals, only genes with relatively large effects were possible to be detected (Button et al., Reference Button, Ioannidis, Mokrysz, Nosek, Flint, Robinson and Munafò2013).
Genomic predictions
We focused on assessing the statistical accuracy of a random regression model for FI and RFI in this study. We investigated genomic predictions for F2 chickens. The results of this research demonstrate that gains from genomic prediction were relatively small in the early weeks but increased over time (Figure 1). This effect is probably due to the smaller volume of data available for the earlier weeks. Accuracies in genomic evaluation depend on contributions and the number of phenotypes and genotypes (Lourenco et al., Reference Lourenco, Fragomeni, Tsuruta, Aguilar, Zumbach, Hawken, Legarra and Misztal2015). Using pedigree-based data, the correlation values for FI decrease over time (from 0.20 to 0.03).
Our results show that use of GBLUP increased prediction accuracies for the RFI in the period between the 4th and 10th weeks of age. However, this increase in accuracy when using genomic rather than pedigree data was not uniform over time, as the accuracy of use of GEBV for RFI was lower than for FI during the early weeks. This result may be related to the low heritability of RFI during the early weeks of life compared with FI (Emamgholi Begli et al., Reference Emamgholi Begli, Vaez Torshizi, Masoudi and Ehsani2016). Positive associations between heritability and accuracy were also reported by Luan et al. (Reference Luan, Woolliams, Lien, Kent, Svendsen and Meuwissen2009). They demonstrated higher accuracy combined with lower bias for production traits when comparing high with low heritability for health traits in cattle. Their results also indicated that more data points are necessary to achieve higher degrees of accuracy in the case of low heritability traits (Luan et al., Reference Luan, Woolliams, Lien, Kent, Svendsen and Meuwissen2009), whereas Hayes et al. (Reference Hayes, Visscher and Goddard2009) showed that low heritability traits pose a problem for selection by both phenotypic and genomic information, and thus require larger training populations to obtain high degrees of accuracies.
In general, the GEBV accuracies for almost all the traits in this study were higher than those for EBV obtained with ABLUP. As a result, it seems to be the case that genomic selection is more accurate than phenotypic, especially for low heritability traits in juvenile animals (Calus et al., Reference Calus, Meuwissen, de Roos and Veerkamp2008). Genomic prediction utilizes information on both the linkage disequilibrium between markers and QTLs as well as additive genetic relationships (Habier et al., Reference Habier, Fernando and Dekkers2007). Because long-range linkage disequilibrium is expected in an F2 population, accuracy of genomic predictions is likely to increase (Liu et al., Reference Liu, Qu, Luo, Shu, Wang, Lund and Su2014). In addition, to achieve enhanced results in terms of the accuracy of breeding values estimated via genomics over generations, it has been suggested that crossbred populations should be used because these have lower linkage disequilibrium levels and a smaller haploblock size (Fu et al., Reference Fu, Dekkers, Lee and Abasht2015). Because broiler phenotypic records are collected before birds reach reproductive age, it is possible to utilize phenotypic, genomic and pedigree information in individual selection. This will lead to considerably higher prediction accuracies than those presented here, based just on pedigree or genomic information.
Although the number of records utilized in this study was small, our prediction accuracies were high (Figures 1 and 2). This result is corroborated by the earlier work of Liu et al. (Reference Liu, Qu, Luo, Shu, Wang, Lund and Su2014), who reported that high prediction accuracies might be related to the small effective F2 population size. Because chickens share large chromosome segments when effective population size is small (Liu et al., Reference Liu, Qu, Luo, Shu, Wang, Lund and Su2014), the results of this study demonstrate that genomic selection using a longitudinal model can lead to substantial improvements in accuracy compared with traditional selection.
The increase in accuracy of incorporating random regression and genomic information animal model used for predicting values was also observed in the study of Wolc et al. (Reference Wolc, Arango, Settar, Fulton, O’Sullivan, Preisinger, Fernando, Garrick and Dekkers2013). Similar results were found by Kang et al. (Reference Kang, Zhou, Mrode, Zhang and Liu2016) who reported that pedigree-bases random regression test-day model had the worst accuracy (0.05±0.02) in the cross-validation compared with GBLUP model (0.14±0.01). Koivula et al. (Reference Koivula, Stranden, Poso, Aamand and Mantysaari2015) also observed a considerably higher validation reliabilities and validation regression coefficients in test-day single-step GBLUP than the test-day model without genomic information. Regression analysis is a useful approach to identify individual variability in patterns of feed efficiency and can be used to describe the curve shapes for FI and RFI.
Conclusions
We report on a series of GWA and GS studies for FI and RFI traits in F2 chickens that utilized β-spline random regression models. A single SNP regression approach was applied to spline coefficients and weekly FI and RFI to demonstrate that two genomic regions are significantly associated with the former trait. Our results provide valuable new insights into the effects of SNPs and candidate genes involved in the genetic architecture of the FI trait in F2 chickens.
We compared predictions of EBVs obtained using ABLUP to those based on genomic BLUP. The results of this study demonstrate that genomic prediction based on a GEBV longitudinal random regression model is valuable in the case of both FI and RFI and leads to increased genetic gain. In addition, our use of genomic information as part of a longitudinal model provides genetic data for each regression coefficient and helps in the detection of genes that affect FI and RFI growth trajectories.
Acknowledgements
The authors gratefully acknowledge the Tarbiat Modares University, Tehran, Iran for financial supporting (grant no D82/1049), Staff of Arian Line Breeding Center and West Azarbayjan Native Fowls breeding Center for providing parents of F1 chickens. The authors would like to thank Dr Just Jensen for financial support through GenSAP grant no 0603-00519B from the Danish Innovation Fund for the bird’s genotyping. Access to the developed 60K SNP Illumina chicken array was kindly provided by the USDA Chicken GWMAS Consortium, Cobb Vantress, and Hendrix Genetics. Genotyping of the birds was supported by Aarhus University, Denmark.