Introduction
Globally, thirty-nine per cent of plants are threatened with extinction and require conservation actions (Nic Lughadha et al., Reference Nic Lughadha, Bachman, Leão, Forest, Halley, Moat, Acedo, Bacon, Brewer, Gâteblé, Gonçalves, Govaerts, Hollingsworth, Krisai-Greilhuber, Lirio, Moore, Negrão, Onana, Rajaovelona and Walker2020). Monitoring threatened species is a critical part of their conservation (Lavery et al., Reference Lavery, Lindenmayer, Blanchard, Carey, Cook, Copley, Macgregor, Melzer, Nano, Prentice, Scheele, Sinclair, Southwell, Stuart, Wilson and Woinarski2021; Yang et al., Reference Yang, Cai, Liu, Chen, Gratzfeld and Sun2020). Data on their population size, structure and trends is fundamental for effective conservation and management (He & Gaston, Reference He and Gaston2000). Despite the need for accurate information on population size, this data is lacking for most threatened plants (Krening et al., Reference Krening, Dawson, Holsinger and Willoughby2021).
The high species richness and high rates of habitat loss make obtaining estimates of population size a critical yet daunting task in the tropics (Heywood, Reference Heywood2017). Few tropical countries have the resources available to conduct exhaustive surveys on all endangered plant species, so some form of sampling is required. Quadrat counts are one of the common approaches used for estimating plant populations (Shen et al., Reference Shen, Wang and He2020). This involves sampling a subset of the population and extrapolating the data to obtain an estimate of the total population. Extrapolating the data can be done using the inclusion probability for sample units from design-based methods or geostatistics. The inclusion of auxiliary data is thought to decrease the variance of the estimator in design-based methods and is essential for geostatistical analysis (McConville et al., Reference McConville, Moisen and Frescino2020; Ver Hoef & Jansen, Reference Ver Hoef and Jansen2015).
In this study, we use two design-based methods (Horvitz-Thompson estimators and generalised regression estimators) and one geostatistical technique (spatial linear models) to investigate the variability in estimates of population size of Semecarpus calcicola Kochummen in Pulau Mantanani Besar, Sabah, Malaysia. Semecarpus calcicola is a narrow-range endemic tree species restricted to Pulau Mantanani, particularly the 26.5 ha northern headland of Pulau Mantanani Besar (Kochummen, Reference Kochummen, Soepadmo, Wong and Saw1996). Due to its restricted distribution and potential threats from land use change and natural disasters, the species was listed on the IUCN Red List of Threatened Species as Vulnerable D2 (Damit et al., Reference Damit, Khoo, Maryani, Maycock, Nilus, Pereira, Sugau and Hoo2019). The rarity of S. calcicola fast became the focal conservation species within Malaysia, focusing on the reproductive and regeneration dynamics (Chua et al., Reference Chua, Sang, Pereira, Khoo and Maycock2023).
The habitat of Semecarpus calcicola, Pulau Mantanani Besar, is continuously threatened by land-use change due to the surge in tourism development and the increases in local Bajau tribe populations (Jaafar et al., Reference Jaafar, Paijo, Mohamad and Ismail2016). Due to the increases in local communities within the island, part of the land has been converted into plantations; in some cases, cattle are also introduced to the island, threatening the plant communities due to cattle grazing.
Plant community survey on Pulau Mantanani failed to identify any S. calcicola individuals, which poses a difficulty in accessing these species’ population dynamics (Yuta et al., Reference Yuta, Gisil, Charles and Liew2025). No information was available on the population size and structure for the species. The aims of the study were to assess the population structure and estimate population size as a precursor to a reassessment of the Red List status of this species. We will use the mentioned geostatistical analysis to estimate the population size of Semecarpus calcicola based on a ground survey done on the 26.5 ha known population area. The generalised regression estimators and spatial linear models incorporated elevation derived from a digital elevation model of the study site as auxiliary data.
Materials and methods
This study was conducted on Pulau Mantanani Besar (PMB) (6.7183 N, 116.3442 E), 30 km off from the nearest Sabah mainland Kota Belud district in August 2020. PMB is the largest of three islands within the Pulau Mantanani group of islands and covers a total of 201 ha (Figure 1). PMB elevation ranges from 0 m to the highest of 64 m, with most of the land lying flat except for the northern headland. Land tenure and ownership of the island remains unclear; however, part of the land is under private ownership (BIMP-EAGA, 2017). Due to the tourism nature of the island, multiple resorts were developed on the island, resulting in disturbed vegetation, mainly within the lowland landscapes.
Map of the study location, where the focus of the study was within the headlamp of Pulau Mantanani Besar within the Sabah state of Malaysia. The location of the study plots was also presented in the figure.

A total of 84% of the total land areas of PMB are forested, encompassing four different forest landscapes, including dominant forest within the central area, a combination of planted forest and disturbed forest around the coastal and community area dominated by Buchanania arborescens (Blume) Blume, coastal forest dominated by Casuarina equisetifolia L, and lastly limestone forest on the northern headland where S. calcicola population is located (Yuta et al., Reference Yuta, Gisil, Charles and Liew2025). The bulk of the island is composed of carbonate sand deposits, with a northern headland formed from bioclastic limestone with minor intercalation of calcareous siliciclastic (Idris & Kok, Reference Idris and Kok1990).
To determine the population size and structure, we installed twenty-six 400 m2 plots at randomly selected coordinates from a 20 m sampling grid overlaid over the northern headland. Sampling was restricted to a 26.5-ha area that covered the limestone headland and adjacent sand deposits, as this is the recorded habitat of Semecarpus calcicola (Kochummen, Reference Kochummen, Soepadmo, Wong and Saw1996). All individuals of Semecarpus calcicola within the plots were enumerated and examined for signs of flowering or fruiting. The diameter at breast height (dbh) and height were measured for individuals greater than 2 m tall. For individuals less than 2 m tall, we measured height, except for new recruits, which were only counted. New recruits were defined as individual that still had the seed attached. These were either directly counted or estimated using 5 randomly placed 1 m2 quadrats taken in each plot. Individuals were classified as either new recruits, seedling (< 1.2 m height), saplings (≥ 1.2 m and < 3 m height), poles (≥ 3 m height and < 5 cm dbh), immature trees (≥ 5 cm and < 9.5 cm dbh) or mature trees (≥ 9.5 cm dbh) based on Soehartono & Newton (Reference Soehartono and Newton2001) and our observation of minimum flowering diameter.
The conservation status of S. calcicola was re-evaluated using the IUCN Red List Categories and Criteria: Version 16, by estimating its Extent of Occurrence (EOO) and Area of Occupancy (AOO) (IUCN Standards and Petitions Committee, 2019). EOO is defined as ‘the area contained within the shortest continuous imaginary boundary that can be drawn to encompass all the known, inferred, or projected sites of present occurrence of a taxon’, while AOO refers to ‘the area occupied by a taxon within its extent of occurrence, excluding cases of vagrancy’, based on a standard 2 × 2 km grid. Both EOO and AOO were calculated and mapped using the Geospatial Conservation Assessment Tool, based on GPS coordinates collected during ground surveys.
We obtained elevational data for the study area from a digital elevation model (DEM) generated from Google Earth Pro following the procedure of Ibrahim et al. (Reference Ibrahim, Al-Mashaqbah, Koch and Datta2020). Six thousand five hundred elevation points were extracted from Google Earth, and a 20 m DEM was developed using the kriging interpolation methods in QGIS version 3.18.1-Zürich (QGIS Development Team, 2021).
We used generalised linear models (GLMs) to investigate the relationship between elevation and number of individuals for each size class. The count data was not normally distributed, with many plots containing zero seedlings. We fitted GLMs with a Poisson distribution to the count data using R version 4.0.2 (R Core Team, 2020). The models were tested for overdispersion using the ‘dispersiontest’ function from the package AER version 1.2-9 (Kleiber & Zeileis, Reference Kleiber and Zeileis2008). To account for overdispersion and excessive zeros in the data, we fitted negative binomial GLMs, negative binomial zero-inflated GLMs and hurdle models with negative binomial distributions. The negative binomial GLMs were fitted using the function ‘glm.nb’ from the MASS package version 7.3.51.6 (Ripley et al., Reference Ripley, Venables, Bates, Hornik, Gebhardt and Firth1998), the zero-inflated model using the function ‘zeroinfl’ from the package pscl version 1.5.5 (Jackman, Reference Jackman2020) and the hurdle models using the function ‘hurdle’ from the same package. All analyses were carried out using RStudio version 1.3.1056 (R Core Team, 2020). Model selection was done using Akaike’s Information Criterion (AIC). Delta AIC (∆AIC) for each model was calculated by subtracting its AIC value from the lowest AIC value model. The most parsimonious model with the lowest AIC value was selected (Table S1). However, models within 2 units of ∆AIC are considered equivalent in terms of best fit (Burnham & Anderson, Reference Burnham and Anderson2002).
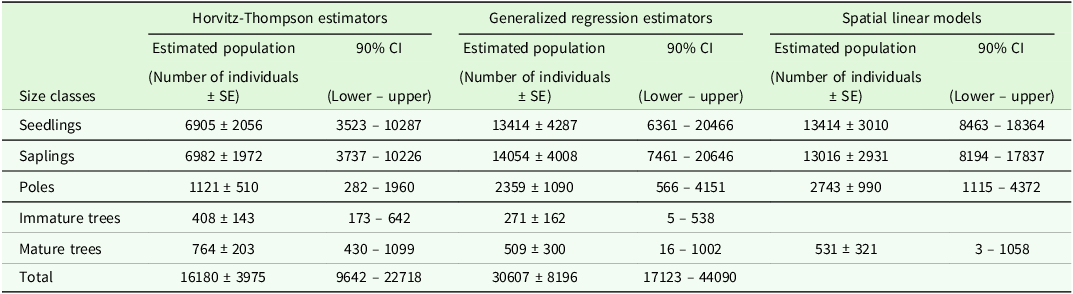
We estimated the population size for each size class within the 26.5-ha study area using Horvitz–Thompson estimators, generalised regression estimators and spatial linear models. The Horvitz–Thompson estimators and generalised regression estimator were determined using the R package MASE version 0.1.3 (McConville et al., Reference McConville, Tang, Zhu, Cheung and Li2021). The Horvitz–Thompson estimators were determined from the number of individuals in the plots and then extrapolated to the study area using the inclusion probability to obtain estimates of population size for each size class. The generalised regression estimators were fitted to a data frame containing the number of individuals and the elevation of each plot. These were then projected over a data frame containing the elevation data for the entire study area, and estimates of population sizes for each size class were determined. For both estimators, bootstrap standard errors were computed from 5000 bootstrap samples following McConville et al. (Reference McConville, Moisen and Frescino2020). Spatial linear models were fitted to a data frame containing the number of individuals and elevation data following Higham et al. (Reference Higham, Ver Hoef and Frank2021b). The spatial linear models were fitted using the R package SPTOTALS version 1.0.0 (Higham et al., Reference Higham, Ver Hoef and Bryce2021a), and an estimate of population size for each size class was determined.
Results
The density of mature individuals was 29 trees per hectare over the 26.5 ha surveyed area (Table S2). Mature individuals were more common in the higher elevation plots, indicated by the positive coefficient in Table S1. A similar pattern was found for immature trees. In contrast, pole seedlings and saplings were more common in the lower elevation plots, with densities declining with elevation (Table S1). Overall, sapling densities were slightly higher than seedling densities (Table S2). Many seedlings showed signs of slashing damage. New recruits were found in only 35% of the plots, and densities were highly variable. Most of the new recruits showed signs of herbivory. Using a 2 x 2 km grid, the extent of occurrence for S. calcicola is 4 km2, whereas the area of occupancy is 4 km2. Due to the single-site occurrence and the absence of a broader distribution pattern, the EOO is at 4 km2. Following IUCN mapping standards, EOO cannot be less than AOO. If EOO is less than AOO, it should be changed to make it equal to AOO to ensure consistency with the definition of AOO as an area within the EOO. Therefore, we report EOO = 4 km2 (equal to AOO at the required 2 × 2 km scale) as a conservative minimum (IUCN Standards and Petitions Committee, 2019).
The estimated total number of mature individuals in the study area ranged from 509 to 764 (Figure 2). The estimated population size varied among the techniques and size classes (Table 1). Estimates for the smaller size classes were lower using the Horvitz–Thompson estimator than with generalised regression estimators and the spatial linear models. In contrast, the Horvitz–Thompson estimator predicted more immature and mature trees than the other techniques (Table 1).
Estimated number of mature individuals from the three estimation procedures. The horizontal lines indicate the population threshold for endangered (EN) and critically endangered (CR) under criteria C: Small populations and decline (IUCN Standards and Petitions Committee, 2019).

Estimate population size for each size class within the 26.5 ha study area

Discussion
The need for robust methods to estimate populations of endangered trees is crucial for plant conservation (Bernardo et al., Reference Bernardo, Vitt, Goad, Masi and Knight2019). In Sabah, of the 278 tree species that are endemic to the state, 70% were assessed as threatened, and 27 species are currently not known from protected areas (Damit et al., Reference Damit, Tsen, Pereira, Sugau, Nilus, Khoo, Mustapeng, Majapun and Maycock2022). Developing cost-effective methods to monitor S. calcicola’s population trends of these threatened species are an essential component of their conservation. While extrapolation from plot-based sampling is a standard technique to estimate population size, in this study, we found considerable variations in the estimates among the three techniques used to extrapolate the data (Figure 1, Table 1). However, all estimates of the number of mature S. calcicola individuals fell within the Endangered category under Criteria C of the IUCN Red List of Threatened Species categories and criteria (IUCN Standards and Petitions Committee, 2019). These findings suggest the need to reassess this species.
The extremely limited geographic range of S. calcicola shows the species at high risk of extinction. As a likely narrowly endemic species, it may depend on specialised habitat conditions not found elsewhere. These ecological constraints, coupled with the species’ restricted distribution, support its assessment as Critically Endangered under IUCN Red List Criterion B, although it is currently categorised as Endangered at the state level.
The distribution patterns of adults and juveniles varied (Table S2). Seedlings, saplings and poles were more abundant in lower elevation plots, while mature and immature trees were more abundant at higher elevations. This may be a consequence of natural factors or past human disturbances. A previous study showed that the flat land had been actively converted to accommodate resort development (Jaafar et al., Reference Jaafar, Paijo, Mohamad and Ismail2016). Our field observation aligns with previous findings where the island’s flat land next to the headland had a mixture of degraded forest and coconut plantation. Yuta et al. (Reference Yuta, Gisil, Charles and Liew2025) did not record any S. calcicola individuals within the headland area; however, our sampling plots found a few individuals on the lower elevation, and the number of individuals increases slightly with elevation.
Previous work on a Semecarpus species found in the peat swamps of Kalimantan showed that the distribution of juveniles was independent of the distribution of mature individuals (Simbolon, Reference Simbolon2009). This lack of aggregation of juveniles and adults may be a consequence of effective dispersal of Semecarpus seeds or reduced seedling survival due to negative density dependence factors (Janzen, Reference Janzen1970; Connell, Reference Connell, den Boer and Gradwell1971). Density dependence effects can occur at densities as low as 30 individuals (Peters, Reference Peters2003), with higher mortality observed in high-density areas. While no information is available for S. calcicola, past studies have shown that Semecarpus seeds are dispersed by large birds, primates, squirrels and flying foxes (Pteropus sp.) (Ashton et al., Reference Ashton, Gunatilleke, Singhakumara and Gunatilleke2001; Jayasekara et al., Reference Jayasekara, Takatsuki, Weerasinghe and Wijesundara2003; Marshall, Reference Marshall1985). An alternative explanation is that most of the lower elevation plots were close to areas dominated by mature mango (Mangifera indica) or coconut (Cocos nucifera) trees. Our observed pattern may be a consequence of clearing of areas during the establishment of the farms and subsequent post-clearing recolonisation.
Our estimated number of mature individuals suggests this species will fall into the Endangered category based on its small population size and continual threats. The main conservation problem for Semecarpus calcicola is that there is no legal protection for most of its habitat, except for a small population on Mantanani Kecil Island. An estimated 46% of PMB has been converted to alternative land use, with most of the remaining forest heavily disturbed. While a few scattered individuals were observed to persist in this landscape, they are under threat from continued anthropogenic disturbances and particularly the uncontrolled development of resorts. This is a major new emerging threat to individuals in low-lying areas.
A second problem is recruitment. While we found good initial recruitment of Semecarpus calcicola, the population structure suggests that few of the new recruits establish as seedlings. Herbivory was observed on most new recruits and established seedlings. The most probable agents of herbivory are the introduced cattle and/or the terrestrial hermit crabs (Coenobita sp.). While we do not collect any herbivory data on our field sampling, we noticed the presence of cattle, particularly domesticated cows that roam around and graze around the island. Due to the expansion of resorts and plantation expansion across the island, grazing areas reduced over time, forcing the cattle to graze near and around the forested area. Many seedlings showed signs of slashing damage, particularly in the lower elevation plots.
Within our knowledge, the island’s land ownership remains as one of the possible complications to conserve S. calcicola population within the island. The need to enforce the law to protect these species might not be as straightforward due to the land ownership problem. Second, the lack of awareness within the island’s communities on the importance of these narrow-endemic species further constrains the conservation efforts. Land-use change and introduced species threaten the survival and growth of S. calcicola, wherein, in the current study, we found herbivory activities within the lowland S. calcicola population.
Supplementary material
The supplementary material for this article can be found at https://doi.org/10.1017/S026646742510031X.
Acknowledgements
We would like to thank Sabah Parks for organising the trip to Pulau Mantanani for the fieldwork and the overall assistance toward the whole fieldwork.
Funding statement
This work was financially supported by Universiti Malaysia Sabah (SDK0055-2018 - Propagation and Conservation of Selected Threatened and Endangered Species in Sabah).
Competing interests
The authors confirm no conflict of interests.