1. Introduction
The leading approach to conservation of large mammals is to create protected areas (Brandon et al., Reference Brandon, Redford and Sanderson1998; Margules and Pressey, Reference Margules and Pressey2000; Adams et al., Reference Adams, Aveling, Brockington, Dickson, Elliott, Hutton, Roe, Vira and Wolmer2004). Protected area systems involve top–down command-and-control measures, including fencing off specific areas to restrict their use. While recent research suggests that protected areas can be effective in some cases (Bruner et al., Reference Bruner, Gullison, Rice and Fonseca2001), many developing country experiences have been disappointing (Brandon et al., Reference Brandon, Redford and Sanderson1998; Adams and Hulme, Reference Adams and Hulme2001; Western, Reference Western2001). The difficulties with protected areas include: (i their size – often parks are too small to sustain a full range of services; (ii) inadequate administrative and management capacity; (iii) limited resources for monitoring and enforcement; and (iv) denying access to local communities, especially the poor who may depend directly on the restricted ecosystem for survival. When rights and access to ecosystem services shift in ways that adversely impact local communities, poor households have little incentive to maintain or use ecosystems in a sustainable way (Barbier, Reference Barbier, Barbier and Swanson1992; Tisdell, Reference Tisdell1995; Damania et al., Reference Damania, Stringer, Karanth and Stith2003).
The limitations of protected area approaches led to efforts aimed at aligning the interests of the poor with conservation objectives through community-based resource management programs. The importance of integrating local communities into protected-area planning dates back to at least the 1982 World Parks Congress (Adams et al., Reference Adams, Aveling, Brockington, Dickson, Elliott, Hutton, Roe, Vira and Wolmer2004). This participatory-style conservation approach, mostly driven by encouragement of external donors, seeks to provide local communities with incentives to protect crucial ecosystems through sharing products, responsibilities, and decision-making authority. However, evaluations and studies continue to raise important concerns about the appropriateness of community-based conservation efforts, arguing that positive and lasting success is elusive when development projects combine biodiversity conservation goals with poverty reduction goals (Simpson, Reference Simpson1995; Murombedzi, Reference Murombedzi1999).
Other studies question the assumptions linking local communities and sustainable resource use across diverse geographic conditions and economic situations (Barrett and Arcese, Reference Barrett and Arcese1995, Reference Barrett and Arcese1998). An analysis of community based natural resource management in Kenya concludes that it did not: (i) result in more equitable distribution of economic benefits; (ii) reduce conflicts; (iii) consider traditional Maasai grazing and wildlife movement knowledge; (iv) improve biological diversity protection; or (v) improve sustainable resource use (Kellert et al., Reference Kellert, Mehta, Ebbin and Lichtenfeld2000). The Kenya case focused on the Kimana Community Wildlife Sanctuary, an important area ecologically serving as a wildlife corridor between two protected areas, Amboseli and Tsavo National Parks. The study region of this paper encompasses the Kimana wildlife corridor.
More recently, a variety of compensation and market-related policies have gained prominence to encourage ecosystem and land managers to change behaviour. While direct financial and market incentive schemes, commonly referred to as direct payments for ecosystem services (PES), now exist in many developed countries – e.g., within the European Union there are elaborate payment schemes for the conservation of waders (meadow birds) – experiences in many developing countries (in particular, in countries other than in Latin America) are more limited (e.g., Landell-Mills and Porras, Reference Landell-Mills and Porras2002; Wunder, Reference Wunder2005). If conservation can be promoted directly through PES, it would potentially benefit the poor as well (Pagiola et al., Reference Pagiola, Arcenas and Platais2005).
Ecosystems provide a plethora of services to human communities, and these services benefit people at a wide range of scales – varying from local to national and even global scale (MEA, 2005). Unless compensation takes place for ecosystem services spilling over to areas beyond their source, such services will likely be ignored by local ‘suppliers’ and, if those services deteriorate, too little will be provided relative to the desires of the regional, national, or global community. The idea behind PES to remedy this situation is simple: beneficiaries of these services should make ‘direct, contractual and conditional payments to local landholders and users in return for adopting practices that secure ecosystem conservation and restoration’ (Wunder, Reference Wunder2005). The type of ecosystem service and the geographical location of the beneficiary (vis-à-vis the location of the source) are important determinants of the form of the contract that can be written.
To date, PES activities in developing countries most often address watershed issues where feedback loops are ‘tight’ and where suppliers and demanders are easy to identify. Less work has been done on payments for global values, although there is some experience with carbon sequestration projects in the context of Joint Implementation, or the Clean Development Mechanism. In this study we are concerned with one particular type of ecosystem service, namely benefits associated with biodiversity conservation (more specifically, conservation of elephants, Loxodonta africana, in a beautiful landscape). The nature of this service implies two types of service beneficiaries could potentially fund a payment scheme: (i) eco-tourists visiting the area and enjoying non-consumptive use values, and (ii) households in various parts of the world enjoying non-use values of conservation.
From a ‘global efficiency perspective’ these two types of value should be added, but it is evident that tapping into the latter source of funding is not easy. There is no ‘world government’ that can tax citizens in the West to finance the provision of public goods in the South. While the Global Environmental Facility (GEF) initiative allows funding for non-use values of international importance, it is not designed for sustained financing. Targeting ‘users’ of the ecosystem services – tourists visiting the area on a safari – is likely a more viable long-run option for the payment scheme.
This paper explores the opportunity to establish an international payment system for ecosystem services associated with wildlife (elephant) conservation near Kenya's Amboseli National Park (NP). Under current trends the long-term future of the Amboseli ecosystem (and its icon – the elephant) looks rather bleak.Footnote 1 Ultimately, impoverished and remote communities are the main drivers of changes in local land use. Because wildlife in many protected areas, including Amboseli, depend on access to (food) resources found on private lands, the success of conservation efforts – elephants or onions? – is determined by the balance between benefits and costs as perceived by these private agents. The objective of this paper, therefore, is twofold. First, we explore whether efforts to promote elephant conservation near Amboseli NP through a PES scheme represent a viable economic proposition, or not. While a cost–benefit analysis is beyond the scope of the study, we aim to provide a rough indication of the costs involved in elephant conservation, and then establish whether these costs are likely to be outweighed by the increase in welfare from ‘more elephants’. The outcome of such a comparison may be used to decide whether strategies should be implemented that provide incentives for local households to sustainably manage their rangelands and share this habitat with wildlife. The second, and closely related objective, is to predict how a PES scheme affects conservation and welfare of the Maasai. To address the second question one would ideally use a household model, but as a fully calibrated Maasai model is not available, we resort to an approximation instead.
The paper is organized as follows. Section 2 provides a brief profile of the Amboseli ecosystem. In section 3, we sketch the bare bones of the Savanna and PHEWS models that are used to simulate the impacts, in terms of changes in land use, income, and elephant abundance, from a PES system. Section 4 presents the simulation results as well as the break-even cost analysis. Section 5 concludes.
2. The Amboseli Ecosystem
The Amboseli ecosystem, an area of some 8,000 km2, comprises part of the Ilkisongo region of southeastern Kajiado District in Kenya and the Longido region of northern Tanzania. Amboseli is typical of African arid rangelands: rainfall is low and unpredictable in time and space. At the heart of the ecosystem is Amboseli NP, the core of a UNESCO Man and the Biosphere Reserve protecting 392 km2 (about 5 per cent) of the wildlife dispersal area. Amboseli's swamps are fed by subsurface water that percolates though volcanic rock from the forested catchment of Kilimanjaro rising spectacularly to the south. Nearly four decades of ecological monitoring and research, as well as two of the world's longest studies of elephants and primates, have brought Amboseli international scientific and conservation recognition.
Amboseli NP is fundamental to Kenya's tourist industry, typically ranking second among parks in annual park gate fees – around USD 3.5 million in 2004. In the past, the absence of wide-scale intensive agriculture and the relatively low population density encouraged and provided refuge to a magnificent array of biodiversity, including large and small mammals, birds, reptiles, insects and plants, some of which are rare or threatened. Birdlife International has named Amboseli one of the world's Important Bird Areas.
At present, market, policy and institutional incentives interact in ways that weaken the region's ecological integrity, endanger the wildlife tourism industry and threaten the long-term viability of rural households. Wildlife habitats are diminishing, migration corridors are narrowing, water resources are being degraded, livestock–wildlife competition is worsening, income inequality is increasing, and human–wildlife conflicts are mounting (Campbell et al., Reference Campbell, Gichohi, Mwangi and Chege2000; Reid et al., Reference Reid, Gachimbi, Worden, Wangui, Mathai, Mugatha, Cambell, Maitima, Butt, Gichohi and Ogol2004). Human–human conflicts are increasing too, as the interests of local communities, park managers, and wildlife tourism providers increasingly clash (Hoare, Reference Hoare1999; Campbell et al., Reference Campbell, Lusch, Smucker and Wangui2003).
The Amboseli ecosystem is home to Maasai pastoralists whose long-practiced livestock activities are well adapted to the variable habitat, and whose land use decisions are a key driver of wildlife abundance in and around the Park. However, the majority of Maasai households receive virtually no direct benefits from the wildlife tourism industry. The cash benefits are not distributed fairly nor equally to the pastoralists (Kellert et al., Reference Kellert, Mehta, Ebbin and Lichtenfeld2000; Mburu et al., Reference Mburu, Birner and Zeller2003). And the indirect benefits, in the form of reduced school fees, irrigation infrastructure maintenance, livestock sales yards, and other related community goods, often fail to benefit those in most need.Footnote 2 The Maasai do bear the costs of managing wildlife habitats, including personal safety, grazing competition, investments to minimize risks, management costs, damage to crops (from eating and trampling), and damage to livestock through the spread of diseases and killing (Norton-Griffiths and Southey, Reference Norton-Griffiths and Southey1995; Campbell et al., Reference Campbell, Gichohi, Reid, Mwangi, Chege and Sawin2002).
The Maasai are organized in so-called group ranches, which are communally owned stretches of land. Currently, the property rights system in the traditional Maasai territory is in a state of flux, and many group ranches have been (or are in the process of) subdividing communal land ownership (refer to Boone et al., Reference Boone, BurnSilver, Thornton, Worden and Galvin2005 and the references therein for more information on the subdivision process). Subdivision implies titling land and allocating it to individuals. The Maasai choose between two decision alternatives. First, they can rent out their land to farmers (or they can farm their land themselves). Depending on the location of the land, irrigated or rain-fed agriculture is feasible, resulting in an area-specific flow of rental payments (or profits). Second, they can use their land for pasture and earn a living as pastoralists, herding goats and cattle. If they do so, we approximate their stocking decisions based on a series of behavioral rules – the PHEWS model discussed below.
From a conservation perspective the pastoral outcome is preferred. Some of the irrigated land was fenced during the late 1990s to protect crops from wildlife, and increasingly those protected croplands impede access to water, food, breeding grounds, and to the seasonal migration of wildlife up and down the slopes of Mount Kilimanjaro, and between Amboseli and other protected areas like Tsavo NP. (In addition, albeit somewhat beside the main point of this paper, there is evidence that agricultural use of the former grazing grounds is not sustainable because of water pollution, agrochemical use, and soil runoff.) Wildlife populations that had access to all of Amboseli's swamps until the 1970s, now have no access to one swamp and only partial access to three others (Reid et al., Reference Reid, Gachimbi, Worden, Wangui, Mathai, Mugatha, Cambell, Maitima, Butt, Gichohi and Ogol2004).
The Maasai have increasingly rented out large areas for irrigated or rain-fed agriculture during the past decade. During the past 20 years, in the adjacent areas to the south and east of Amboseli NP (Loitokitok Division), human populations have more than tripled, rain-fed agricultural areas expanded by 3.5 times, and irrigated area increased by 18 times, from around 250 ha to 4800 ha (Campbell et al., Reference Campbell, Lusch, Smucker and Wangui2003). While cropping may be privately rational (the returns of cultivation dominate the private returns of wildlife management), it is an open question whether it is also socially beneficial – i.e., what happens when we include ecosystem services benefiting people outside the Amboseli ecosystem in the picture?
3. The model
The majority of elephants and the other migrating species cannot survive without Amboseli's larger ecosystem, migrating seasonally between the Park and its surroundings. The future of much of Amboseli's wildlife lies in the hands of the people surrounding the Park. Six communally owned group ranches surround the Park. The predominant form of land use, livestock raising, is compatible with wildlife conservation. While livestock and wild herbivores may compete for forage, and predators may occasionally kill livestock, historical grazing systems and population pressures seemed to be sustainable and allowed for the co-existence of domesticated and wild animals.
3.1 The Savanna model
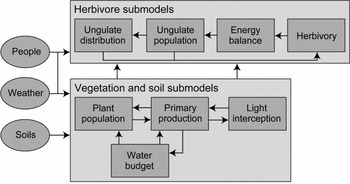
To address management and policy questions relevant to wildlife and livestock requires an integrated approach (Coughenour et al., Reference Coughenour, Boone, Thornton, Howe, Chuluun and Ojima2002). We built upon an integrated assessment of southern Kajiado District (Boone et al., Reference Boone, BurnSilver, Thornton, Worden and Galvin2005; Thornton et al., Reference Thornton, BurnSilver, Boone and Galvin2006) that uses a process-based, spatially explicit ecosystem model called Savanna. Savanna has been applied at sites throughout the semi-arid areas of the world, but was first developed within Turkana District, Kenya (Coughenour, Reference Coughenour1985). Many subsequent improvements and applications have been described (e.g., Coughenour, Reference Coughenour, McKenzie, Hyatt and McDonald1992; Buckley et al., Reference Buckley, Coughenour, Blyth, O'Leary and Bentz1993; Ellis and Coughenour, Reference Ellis, Coughenour, Squires and Sidahmed1998; Boone et al., Reference Boone, Coughenour, Galvin and Ellis2002, Reference Boone, Galvin, Coughenour, Hudson, Weisberg, Vogel and Ellis2004, Reference Boone, BurnSilver, Thornton, Worden and Galvin2005; Thornton et al., Reference Thornton, Fawcett, Galvin, Boone, Hudson and Vogel2004, Reference Thornton, BurnSilver, Boone and Galvin2006; Boone, Reference Boone2005). A schematic outline of the model is provided in Figure 1a.
Schematic outline of the SAVANNA model used to simulate the impact of land use change on wildlife (elephant) abundance

Savanna is a series of FORTRAN computer programs that join to model primary ecosystem interactions, simulating functional groups for plants and animals (e.g., perennial and annual grasses, cattle, grazing antelopes) over periods from 10 to 100 or more years (Ellis and Coughenour, Reference Ellis, Coughenour, Squires and Sidahmed1998). The model represents landscapes by dividing them into a system of square cells, and uses a series of digital maps (GIS maps) to characterize each cell. The model predicts water and nitrogen availability to plants using rainfall and soil properties, for each cell in the map. Based upon water, light, and nutrient availability, quantities of photosynthate are calculated for each of the plant functional groups. Photosynthate is distributed to the plant parts based on established allometrics, yielding estimates of primary production. Plant populations are calculated from investments in reproductive parts.
A habitat suitability index is calculated for each cell, at weekly intervals and for each animal functional group, based upon forage quality and quantity, slope, elevation, cover, and the density of herbivores. Herbivores are distributed on the landscape based upon these indices. Importantly for this study, where we are interested in the system's response to the presence or absence of fenced-in cropland, maps may be used to modify the distribution of herbivores. Animals feed upon the available vegetation, depending upon dietary preferences and consumption rates. The energy gained is reduced by energy costs associated with basal metabolism, gestation, and lactation. Net energy remaining goes toward weight gain, with weights reflected in animal condition indices. Charts and maps are produced at monthly intervals (e.g., Boone et al., Reference Boone, Coughenour, Galvin and Ellis2002).
Seven plant functional groups are captured in the case study's Savanna application: palatable grasses, palatable forbs, unpalatable grasses and forbs, papyrus (Cyperus papyrus) swamps, palatable shrubs, unpalatable shrubs, and deciduous woodlands. Nine animal groups are modeled: three livestock species (cattle, goats and sheep), and six wildlife groups (wildebeest, Connochaetes taurinus; zebra, Equus burchellii; African buffalo, Syncerus caffer; grazing antelope; browsing antelope; and elephants). See Boone et al. (Reference Boone, BurnSilver, Thornton, Worden and Galvin2005) for species comprising grazing and browsing antelope groups. A variety of data sources were used to parameterize the application for southern Kajiado District, described in Boone et al. (Reference Boone, BurnSilver, Thornton, Worden and Galvin2005), including examples of literature used. The ecosystem model was calibrated using sources such as a net primary production database (Kinyamario, Reference Kinyamario1996), satellite imagery, which relates well to regional stocking levels (Oesterheld et al., Reference Oesterheld, DiBella and Kerdiles1998), and information from important literature sources (e.g., De Leeuw et al., Reference De Leeuw, Prins, Njuguna, Said and de By1998).
While formal validation studies of the Savanna model are unavailable (and perhaps impossible in light of the model's integrative nature), various efforts demonstrate that the model provides simulation results that seem to mirror the ‘big pictures’ in reality (e.g., Boone et al., Reference Boone, Coughenour, Galvin and Ellis2002, Reference Boone, Galvin, Coughenour, Hudson, Weisberg, Vogel and Ellis2004). Adjustment and assessment of the parameterization of Savanna applications (such as the Kajiado model used in this study) include comparisons of model output to actual NDVI surfaces (the normalized difference vegetation index made from satellite imagery), NPP estimates based on field data (e.g., Kinyamario, Reference Kinyamario1996), comparisons of simulated and observed herbivore populations (Rykiel, Reference Rykiel1996) from aerial surveys conducted by the Kenyan government, and comparisons to field data (e.g., ecological sampling to quantify standing green and standing dead biomass, as in Boone et al., Reference Boone, Coughenour, Galvin and Ellis2002), sometimes collected for the purpose.
3.2 The PHEWS Model
In an ideal world the Savanna model would be linked to a process-based, detailed, and fully calibrated household model that captured the myriad of response Maasai may have to changing circumstances. Such a model would combine the preferences of the Maasai households with respect to goods and services they consume (including their utility from leisure and ‘life style’ considerations that are undoubtedly relevant in this context) with a set of constraints – a budget constraint, time constraint, production possibilities, etc. However, such a model is not available for the study area. Instead, we use an approximation of such a model, calibrated for pastoral households in East Africa, called PHEWS (Pastoral Household Economic Welfare Simulator – see Thornton et al., Reference Thornton, Galvin and Boone2003, Reference Thornton, Fawcett, Galvin, Boone, Hudson and Vogel2004, and Reference Thornton, BurnSilver, Boone and Galvin2006 for details). We distinguish between 24 different household ‘groups’ in this study – the product of eight livelihood strategies and three wealth levels (poor, medium, rich). For details about the classification, please refer to Thornton et al. (Reference Thornton, BurnSilver, Boone and Galvin2006).
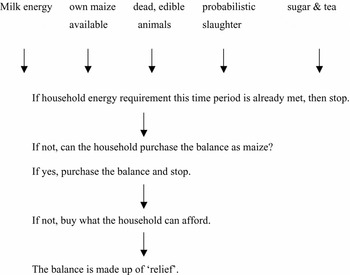
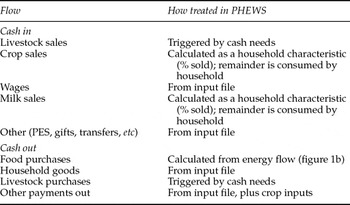
PHEWS is based on a set of rules that households follow when trying to secure caloric intake (and also accounts for some probabilistic slaughter for ceremonial occasions). It is well known that rainfall and income from herding are highly volatile in this part of the world. PHEWS keeps track of dietary energy flows and prescribes a certain series of actions when intake falls short of a desired level. An overview of the energy flow in the household, and associated behavioral rules, is provided in Figure 1b. The household has access to two types of assets to finance its consumption of energy: (i) a so-called ‘cash box’ that evolves in accordance with expenditures and income from various sources, and (ii) a livestock herd. An overview of the relevant additions to, and subtractions from, the cash box is provided in table 1. The livestock herd dynamics are governed by a simple set of rules governing livestock sales and purchases. Livestock sales are triggered by specific cash needs above certain levels, and similarly livestock purchases (which are much rarer) are triggered when the household has accumulated specific levels of available cash. The rules and triggers used were developed from household data collected by BurnSilver (Reference BurnSilver2007) and formed part of the calibration of PHEWS for Kajiado – details are discussed in Thornton et al. (Reference Thornton, BurnSilver, Boone and Galvin2006).
Schematic outline of the energy flow in the PHEWS model used to simulate behavior of pastoralists

Cash flows in the Pastoral Household and Economic Welfare Simulator (PHEWS)

Source: Thornton et al. (Reference Thornton, Galvin and Boone2003, Reference Thornton, BurnSilver, Boone and Galvin2006).
In sum, pastoral households have a target caloric intake and specific cash needs. They are assumed to use livestock as a buffer in periods when household income and consumption are low, and livestock numbers will be built up when income is high and caloric requirements are easily satisfied. Remaining funds are placed in the ‘cash box’ where they are stored for future use when income is low (Thornton et al., Reference Thornton, BurnSilver, Boone and Galvin2006). When caloric intake from consumption of animal products, maize and sugar is insufficient to meet the threshold, the household tries to use its ‘cash box’ (if available) to buy maize, to make up for the deficit. If this fails, they sell a goat or cow. If all fails, the model assumes that there will be outside relief from some exogenous source. For this reason the model is not particularly useful for capturing Malthusian population dynamics, say, and we simply assume that the human population is constant.Footnote 3
The SAVANNA and PHEWS models are tightly linked, and are literally part of the same simulation. At each time step modeled, SAVANNA passes information about livestock to PHEWS, and PHEWS passes information about the sale of animals and such back to SAVANNA.
3.3 Three scenarios
We distinguish between three different scenarios, which are compared to highlight effects of different management practices. In control scenario A we consider the base case where parts of the group ranches that surround the Park are converted to fenced-in cropland (but note that we assume that the fenced-in areas are used for cropping throughout the entire study period – from 1977 to 2000 – and that in reality fencing only started in the 1990s). We use historical rainfall patterns to simulate livestock and wildlife abundance over time and space. In the pastoral scenario B we explore the case where the fenced-in area is returned to grazing ground and accessible for wildlife and livestock alike. One may think of this as a command-and-control approach to conservation, simply banning the use of fences. We simulate the impact on wildlife and livestock, but also on Maasai income. Finally, in PES scenario C we consider what happens if we compensate the Maasai for restoring the grazing grounds. That is, in return for giving up the privately profitable option to rent out land to crop growers, the Maasai are assumed to engage in an easement deal with a funding agency that offers a competitive rate of return on the land. Compared to scenario B the Maasai budget constraint is therefore relaxed, which means that households are better able to meet their target consumption levels.Footnote 4
This approach involves comparisons between simulations where the only attributes changed are areas available for grazing and payments to Maasai. The model is parameterized to agree with current conditions to the degree possible, but the approach is not predicated on responses being absolutely correct, but rather on comparisons between simulations that are otherwise parameterized identically. Our results are not intended to provide precise predictions about how the elephant population may change in the future; too many unforeseen circumstances may affect that trajectory. Rather, we provide examples of tradeoffs associated with PES systems, and identify the direction and magnitudes of change in wild and domestic ungulates, and in Maasai well-being.
4. Simulation results
In this section we present the simulation results of the three scenarios, and we use these results as input in a break-even cost analysis. We try to address the question whether a PES scheme for elephant conservation is welfare enhancing at the global scale, or not. We also use the output to discuss the form that transfers from conservationists to pastoral households may take.
4.1 Returning cropland to range land
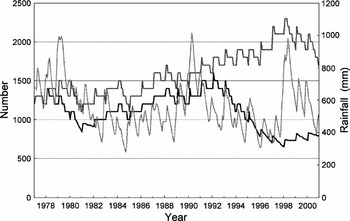
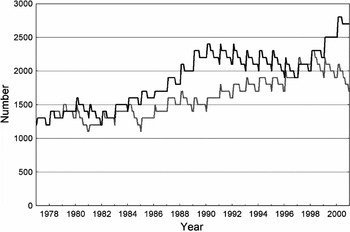
Figure 2 summarizes the impact of returning the fenced-in cropland to grazing grounds on elephant abundance. The dashed upper line reflects elephant abundance in scenario B (no fences) and the solid lower line reflects the number of elephants in control scenario A. The figure also shows the historical pattern of rainfall in the study area (light dashed line).
Elephant abundance with (solid) and without (heavy dashed) habitat conversion
Precipitation over 12 months (light dashed) is overlaid for comparison

Not surprisingly, expanding elephant habitat translates into a larger number of elephants. However, during the first 15 years of the simulation exercise, the impact is very modest – typically in the range of only 100 to 300 extra elephants per year, or a modest 15 per cent increase in abundance. It appears as if the pastoral scheme is hardly worthwhile. But the situation abruptly changes after 1992, when stocking rates are rather high and a serious drought hits the area. The elephant population in the control scenario collapses to about 50 per cent of its pre-drought level of abundance, while the elephant population in the pastoral scenario increases. Considering the entire study period from 1977 to 2000, the average number of elephants in the pastoral scenario is about 500 heads larger than in the control scenario. The averages tell only part of the story, however; the main benefit from removing fences is that the elephant population is much more resilient to changes in (environmental) conditions when it has access to a wider set of base resources.
The interpretation of these results is as follows. In times of sufficient rainfall, the swamp areas converted to cropland do not represent a key resource for elephants. Opening up these areas implies they have access to more food, so we observe a modest increase in the population. However, the picture changes in times of drought, when access to the swamps for food and water becomes necessary to support the elephants. If this access is denied, water and food become critical factors and the population crashes.
The elephant population in pastoral scenario B increases during the drought of the mid 1990s because of less competition from livestock. Faced with a drought, the Maasai have no option but to sell part of their large stock to support their families, to buy grain, and to purchase more drought-resistant small stock. The loss of milk from the large stock demands more large animal sales, which in turn means less milk, etc., in the downward spiral seen here and sometimes seen in Maasai communities. In the simulation, goats eventually came to dominate herd composition. This represents a fundamental tradeoff of the command-and-control option to conservation; if it is effective at promoting elephant conservation by restricting the Maasai's use rights of the swamps, the costs of this ‘success’ are borne entirely by the Maasai who see their herds shrink and income position deteriorate. Since most of the non-use values associated with conservation are transboundary, this is clearly unfair.
4.2 The effect of paying for ecosystem services
Figure 3 summarizes the consequences of establishing a PES system, where the Maasai lease their cropland to a conservation agency (as opposed to crop farmers), and where the restored grazing grounds and swamps are available for livestock and wildlife. The upper solid line represents the elephant population when a PES system is in place – the scenario C – and the lower dashed line, again, depicts pastoral scenario B discussed above, where fences have been removed but where no compensation takes place.
The effect of paying Maasai for not renting out their lands on the elephant population
A comparison of pastoral systems with (solid) and without compensation (dashed)

The first thing to notice is that a fair transfer to the Maasai did not compromise elephant conservation – the opposite is true. Key resource areas and other rangelands remained available because of the PES agreements limiting cultivation. Elephant numbers exceeded those when the entire area is pastoral because the transfer enabled the Maasai to support a livestock herd that was close to a sustainable size and composition for the ecosystem. While increasing livestock herd size is detrimental for conservation – livestock and wildlife compete for base resources – the same is not true for the changes in composition brought about by the PES system. Specifically, cattle diets overlap less with elephants than do goat diets (e.g., see Skarpe et al., Reference Skarpe, Jansson, Seljeli, Bergstrom and Roskaft2007). The PES system enabled the Maasai to gradually expand their cattle stock (towards a herd that exceeds the herd under pure pastoralism by some 4,000 heads, or an increase of some 25 per cent relative to the pastoral scenario B), and move away from goats. In the final periods of the simulation exercise, the goat herd under scenario C is some 10,000 heads smaller than in pastoral scenario B (representing a 33 per cent reduction). Because goats and elephants have overlapping diets – they compete to some degree for food – this change in the composition induced by a relaxed budget constraint favored elephants. By the same token: note that the change in livestock composition from goats to cattle will adversely impact grazing species of wildlife that compete for food with cows.
The main insight is that poverty alleviation and conservation may go hand-in-hand. Implementation of a PES scheme will both make the Maasai better off (in our specification: they are fully compensated for the foregone returns from leasing out their land, and as a bonus they can use the restored grazing grounds for their own livestock) and will enhance and stabilize elephant populations. The lack of a tradeoff follows from ecological interactions between species, and capturing such interactions implies developing multi-disciplinary models as the one advanced here.
4.3 First attempt at a break-even cost analysis
The observation that the PES scheme makes elephants and Maasai better off does not necessarily imply that it is welfare enhancing, because there are costs to consider as well. How do the costs and benefits compare? A full cost–benefit analysis may account for the distributional consequences (giving extra weight to income of the Maasai) and should account for transaction costs, etc. The break-even cost analysis ignores these issues and focuses instead on a more narrow question: does the conservation value created by the PES exceed or fall short of the opportunity costs of conservation – the foregone returns to cultivating crops, proxied by the rental payments to Maasai?
Upon comparing control scenario A with PES scenario C, the PES scheme produces benefits of some additional 600–700 elephants per year (average value). How much does the international community value the conservation of some 650 elephants? Answering this question is not easy. First, we are interested in marginal values and this information is not available to our knowledge. Second, the willingness to donate money for elephant conservation projects likely increases with income. Geography matters as well, because elephants are a real threat to the safety of people who live with them (41 per cent of villagers polled in Cameroon wanted elephants removed or fenced in, and a significant minority wanted them shot – see WWF, 2000). When considering the non-use value of charismatic species like elephants, it is not obvious which reference population should be included in the aggregation exercise.
Because of the uncertainties that inevitably surround point estimates of the value of elephants we turn the question around: focus on the costs of conservation first, and then argue whether it is plausible that aggregate conservation values are sufficiently large to overcome these costs or not. Based on observations in the field we first use a payment of US $10 per acre per year as a proxy for the opportunity costs of conservation. Multiplying the fee by the relevant area of cropland yields a total cost of $112,500 per year. Assuming constant marginal cost, this translates into a cost of some $175 per elephant per year (divide by 650).
Assuming that the marginal value of elephant conservation is constant (a strong assumption), a prerequisite for the PES scheme to be globally welfare enhancing is that households in Europe and the United States are willing to pay $0.60 per year for African elephant conservation.Footnote 5 Of course, it is an open question whether households are indeed willing to pay such amounts, but evidence gleaned from contingent valuation studies into the willingness to pay for other species (for an overview, see Loomis and White, Reference Loomis and White1996) suggests that this number is not excessive. One specific study aimed at valuing Asian elephants (E. maximum) also produced an estimate of willingness to pay amongst the people of Sri Lanka that would have been sufficiently high – some $12 per household per year (Bandara and Tisdell, Reference Bandara and Tisdell2004). We conclude that a PES effort for the Amboseli region is likely to make good economic sense.
The discussion above, however, is incomplete and misses out on an important source of heterogeneity. While most of the rain-fed land can be obtained at a relatively low cost, this is not true for other areas where irrigated horticulture is possible. Net agricultural profits in such areas are considerably higher. Even if the landowners secure only part of these returns (with the remainder accruing to the farmer who does the actual work and faces most of the production and price risk) as rental payments, it is unlikely that a viable PES scheme could be set up that would be able to induce the Maasai to keep the land under pasture. In other words, while implementing a PES scheme to safeguard critical elephant habitat and wildlife corridors is feasible for large parts of the study area, there are also pockets where the returns to agriculture may dominate the (social) returns to herding and conservation.
4.4 Exploring leakage
This section examines how robust these results are with respect to alternative specifications of Maasai behavior. According to the PHEWS model, pastoralists use PES funds to re-balance the composition of their livestock herd (purchasing extra cattle at the expense of goats and sheep), and store some of the money in their cash box for future use. What happens if, instead, all the new funds are used to purchase additional livestock in the same proportion as current livestock holdings? This would aggravate competition for food between livestock and wildlife and potentially attenuate the conservation benefits. Following earlier economic literature on such attenuating effects (such as in the literature on carbon emissions, see for example Felder, Reference Felder1993) we refer to this outcome as ‘leakage’. We have used SAVANNA to explore this issue.
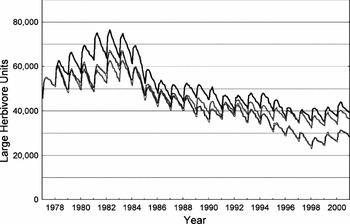
Representative results are provided in figure 4, depicting wildlife populations for three different scenarios: (i) PES payments going to households (solid line), which is just scenario C based on the PHEWS model, (ii) PES based on the assumption that all money is immediately converted into livestock (dashed line), and (iii) the control scenario A above (open line). The curves for scenario's A and C are different than the ones depicted in figures 2 and 3 because they are based on an aggregate measure of wildlife – they contain, but are not limited to, elephant abundance. Two results follow from figure 4. First, it is clear (and unsurprising) that the conservation effects of PES are attenuated when the Maasai convert all payments into livestock – the dashed curve is below the solid curve. Livestock demand for forage exceeds the carrying capacity by some 20 per cent, and overgrazing and competition for food forces the wildlife population down. In particular smaller-bodied herbivores showed such compensatory changes in abundance in response to a rapid increase in livestock stocking (elephants are less sensitive).
Payments to pastoralists may result in larger livestock herds and accentuated competition for food between livestock and wildlife
Wildlife stocks in the presence (solid) and absence (open) of payments for ecosystem services, as well as if payments are used entirely to purchase livestock (dashed). (The definition for Large Herbivore Units is the same as for a Tropical Livestock Unit, or 250 kg of body mass, with masses used to convert numbers of animals into LHUs as shown in Boone and BurnSilver (Reference Boone and BurnSilver2002: 6).)

Second, and more interestingly, upon comparing the new scenario where PES payments are used to buy livestock to the control scenario without PES it is evident that it is difficult to unambiguously rank the scenarios in terms of conservation effects. There are periods where the wildlife populations with PES are smaller than those occurring in the control case with farming and fences. Throughout the 1990s this situation reverses, and the conservation effects of PES are positive. The reason for the ambiguity is that PES pushes both the extensive and intensive margin of herding. The extensive margin is pushed out as more rangeland is made available, but the intensive margin shifts simultaneously as Maasai increase their stocking rates. The net effect on the availability of food for wildlife is ambiguous, but will be determined by the relative price of livestock. If this price is high (relative to the PES payment), pastoralists respond by modestly increasing their stocking rates, and the extensive margin effect dominates. However, as the livestock price becomes sufficiently low (or as the payments translates into a sufficiently large number of new livestock heads), the gains from extra rangeland are dissipated through the losses from extra competition for food. In the absence of information on relative prices (context-specific) and a better understanding of the pastoralists' objective function it is hard to predict the outcome of PES systems. This is an area worthy of more research.
5. Discussion and conclusion
This paper explores the opportunities for implementing a payment for ecosystem services scheme on Maasai group ranches near Amboseli NP. Wildlife migrates seasonally in and out of the park, and conserving wildlife in a sustainable fashion implies securing land use types outside the reserve that are compatible with wildlife. Livestock grazing is an example of such a compatible land use type. Fenced-in cropping is not. Due to the many and potentially complex inter-linkages between human and natural systems it is imperative to analyze these issues with a model that integrates insights from ecology and economics.
PES is an increasingly popular instrument for promoting conservation, especially in Europe. In recent years, PES has been introduced in developing countries, in particular in the context of watershed management and carbon storage. However there is no reason to discount the potential use of PES as a mechanism to align potentially opposing interests in the area of wildlife management or biodiversity conservation (areas where non-tangible non-use values are likely important – spilling over national boundaries). We conclude that PES may be a powerful tool in the Amboseli ecosystem because it promotes conservation and contributes to alleviation of poverty (also through stabilization of pastoral income). Nevertheless, the study area displays considerable heterogeneity in terms of the opportunity costs of conservation (i.e. foregone returns from cropping), and perhaps a PES scheme is unlikely to swing Maasai behavior in those irrigated horticulture areas where the returns to agriculture are very high.
Moreover, and interestingly, the basic behavioral model that we employ (PHEWS) suggests that these beneficial effects seem to mutually enforce each other: there is no tradeoff between making the Maasai less poor and protecting elephants. Our analysis also indicates that the cost per household per year in Europe or the USA to support a PES that conserves elephants is modest. One important caveat is the potential issue of ‘leakage’. If we use a simple mechanical rule to describe Maasai behavior (i.e. ‘use all extra funds to purchase extra livestock’), then much of the gains from habitat expansion are dissipated through extra competition for food between livestock and wildlife – this is clearly an issue that needs to be explored in more detail.
One final issue remains – how should the PES project be funded? In light of the very significant non-use values that represent an ongoing flow of benefits accruing to the world population, the effort should be to implement a matching flow of sustained compensation flowing from North to South. Fortunately matters appear relatively simple for the case of the Amboseli ecosystem, which is a very popular tourist destination. With 200,000 tourist days a year, the PES program could be easily funded with a relatively minor increase in the Park entrance fee – from US$30 to US31 – or with the introduction of a modest bed tax. Having visitors pay for conservation implies that non-visitors are free riding, and receive their non-use values at zero cost. Clearly such free rides are not always feasible elsewhere.