Implication
Return over feed (ROF) is a herd profit index used by Canadian dairy farmers to evaluate profitability of their cows and make culling decision in their herds. This study proposed methods for estimation of genetic merit of ROF. However, because of the simplicity of this index, ROF it is not recommended to be used for selection. The Canadian selection index (Lifetime Profit Index) seems to be a better alternative for selection for profitability because it accounts for larger number of traits influencing cow’s profitability and consider differences in heritability among traits.
Introduction
Genetic selection for more profitable animals is the main objective of most breeding programs. Mulder and Jansen (Reference Mulder and Jansen2001) defined a profitable cow as an animal that can sustain a high production for many years with acceptable reproduction and without serious health problems. Genetic merit of profit can be increased by combining predicted breeding values of economically important traits in a selection index (Hazel, Reference Hazel1943). Each country uses a different set of traits and economic weights in their selection index (Miglior et al., Reference Miglior, Muir and Van Doormaal2005). In general, selection of appropriate traits and proper derivation of economic weights is a relatively difficult task. An alternative approach is to design a direct evaluation of profit as a trait (Visscher and Goddard, Reference Visscher and Goddard1995). The advantages of this approach include (i) the use of whole lactation production rather than only 305-day yields, (ii) traits without available EBV can be considered (feed intake, disease resistance) and (iii) fewer genetic parameters are necessary than when using selection index (Meuwissen and Goddard, Reference Meuwissen and Goddard1997). However, because this approach ignores differences in heritabilities between components of profit, smaller genetic progress would be achieved from direct selection on profit compared to selection based on selection index (Visscher and Goddard, Reference Visscher and Goddard1995).
Profit functions that account for all income and costs associated with each animal are preferable, but because of limited information on animal-specific health and reproductive costs, simplified functions are usually used. Norman et al. (Reference Norman, Cassell, Pearson and Wiggans1981) proposed a simplified profit function that was only based on production and Tigges et al. (Reference Tigges, Pearson and Vinson1984) reported that it explained 95% of total variability of profit. Individual profit depends on management decisions such as voluntary waiting period and culling, therefore suboptimal management decisions can create a biased relationship between profit and other traits such as calving interval, lactation length and herd life (Goddard, Reference Goddard1998).
Individual profit can be defined as lifetime profit, profit per lactation, profit per year or profit per day of herd life. Based on the definition of profit, heritability estimates for this trait range from 0.13 to 0.36 (Visscher and Goddard, Reference Visscher and Goddard1995; Weigel et al., Reference Weigel, Cassell and Pearson1997; Pérez-Cabal and Alenda, Reference Pérez-Cabal and Alenda2003) with lifetime profit having a lower heritability estimates than profit per lactation.
Canadian dairy farmers use return over feed (ROF), a herd profit index, developed by Canadian DHI to evaluate profitability of their cows and make culling decision in their herds. This index is based on milk income and feed costs, which are the two most important determinants of cow’s profitability (Adkinson et al., Reference Adkinson, Farmer and Jenny1993). Because of the popularity of ROF among farmers, the Canadian dairy industry requested to estimate genetic merit of ROF and investigate the relationship between ROF and the Canadian selection index – Lifetime Profit Index (LPI).
The objective of this study was to estimate variance components and breeding values (EBVs) for ROF through the first three lactations and to calculate correlations between EBV for ROF and other traits currently evaluated in Canada.
Material and methods
Data
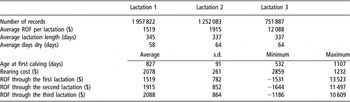
Data were age at calving, total milk, fat and protein yields, days in milk and days dry of the first, second and third lactations recorded from 1980 to 2007 on 1 951 893 Holstein cows (Table 1). All cows were required to have a first lactation record. The pedigree file contained 3 753 029 animals. Functions developed by CanWest DHI were used to calculate individual rearing cost and ROF per lactation (McLaren, Reference McLaren2004). Rearing cost was calculated as:

where $1800 (in Canadian dollars) was a cost for rearing a heifer until 730 days of age (24.3 months), AFC was age at first calving in days, $1.21 was an overhead cost per day for a heifer and $1.66 was a maintenance feed cost for every additional day after 730 days of age. ROF per lactation was calculated as a difference between income per lactation and expenses per lactation. Income per lactation was calculated as:

where $9.92 was the price per kilogram of fat, fat was amount of fat in kilogram produced per lactation, $7.16 was the price for kilogram of protein, protein was the amount of protein in kilogram produced per lactation, 0.0576 was the percentage of other solids per kilogram of milk, $1.53 was the price per kilogram of other solids, milk was the amount of milk produced per lactation, the last term represents a deduction for transportation of fluid at a cost of $0.0431 per kilogram and 1.03 is a coefficient for conversion kilogram of milk to liters. The formula for calculating expenses was:

where $3.21 represented the daily overhead cost for a lactating cow, $1.66 was the daily maintenance feed cost, DIM stands for days in milk and DD stands for days dry, $1.21 was the daily overhead cost for a dry cow, $2.31 was the marginal feed cost per kilogram of fat and $3.01 was the opportunity cost for kilogram of quota. The opportunity cost for kilogram of quota was based on price of quota ($25 000 per 1 kg of daily production of fat) and bank interest rate of 4.4%. Costs associated with reproduction and health were not considered due to unavailability of data. After deriving elements in equations (2) and (3), ROF can be expressed as:

Description of data

ROF = return over feed.
This equation clearly indicates that ROF is a simple linear function of production traits with a penalty for calving interval (DIM + DD).
Models
Profit was defined either as ROF per lactation or cumulative ROF from first calving until a given point. A multiple-trait (MT) model and random regression model (RRM) were compared to investigate which definition of profit would be the most appropriate for the Canadian dairy industry. Both models fitted rearing cost and profit as correlated traits.
The MT reflected ROF per lactation and was defined as:

where yijkl is the ith trait (i = 1,…4 − rearing cost, ROF through the first, second and third lactations), hij was the jth herd–year–season of calving effect, aik was the additive genetic effect of animal k and eijkl was the residual effect for each observation. ROF through the nth lactation was set to 0 for cows that were culled and had less than n lactations. ROF through the nth lactation, for cows that did not yet have a chance to experience the nth lactation, was set to a missing record.
In matrix notation, the model can be described as:

where y was a vector of observations, b was a vector of herd–year–season of calving effect and a and e were vectors of additive genetic and residual values, respectively; X, Z were incidence matrices.
The data were assumed to follow:

and

where G and R were a 4 × 4 (co)variance matrices of additive genetic and residual effects, respectively. A was the additive genetic relationship matrix and I was an identity matrix.
The RRM was a two-trait model, evaluating rearing cost and cumulative ROF. Cumulative ROF was a trait with repeated observations and was defined as a sum of ROF from first calving to the subsequent calving. Cumulative ROF was fitted as a function of age at subsequent calving. The model was defined as:

where y 1 was rearing cost, y 21 was ROF of the first lactation, y 22 was equal to sum of ROF of the first and second lactations and y 23 was sum of ROF through the first three lactations, αjn was the nth fixed regression coefficient of the jth herd–year–season–parity class, Φ n(age) is the nth covariate associated with age at calving (age), and βkn was the nth regression coefficient for the random additive genetic effect of animal k and γkn was the nth random regression coefficient for the permanent environmental effect of animal k. Legendre polynomials of orders 1 and 2 were fitted for fixed and random regressions, respectively. A phantom record was created for a cow without a second or third lactation to incorporate information about zero ROF after culling and to force regression curves to plateau after culling in the second and third lactations, respectively. Failure of doing that would likely lead to overestimation or underestimation of breeding values of cows with short herd life. A trend of the regression function after culling would be increasing for cows that had higher profit at the last lactation compared to previous lactation, and decreasing for cows that had lower ROF at the last lactation compared to previous lactation. This would result in a predicted ROF that would be higher for the first group of cows and lower for the second group of cows than ROF at the time of culling. In reality, ROF after culling remains constant; and it is equal to ROF at culling.
The RRM model can be described in matrix notation as:

where y1 and y2 were vectors of observations for rearing cost (trait 1) and cumulative ROF (trait 2), respectively; b1 was a vector of herd–year–season of calving effects for trait 1, b2 was a vector of regression coefficients for herd–year–season of calving effect for trait 1, a1 was a vector of additive genetic effects for trait 1, a2 was a vector of random regression coefficients for additive genetic effects for trait 2, p was a vector of random regression coefficients for permanent environmental effect for trait 2, and e1 and e2 were residual values for trait 1 and 2, respectively. X1, X2, Z1, Z2 and W were incidence matrices.
The (co)varience structure was defined as:

where σG 12 was an additive genetic variance for trait 1, G12 and G21 were covariance matrices of size 1 × 3 and 3 × 1 of additive genetic effect for trait 1 and random regression coefficients for additive genetic effect for trait 2, G12 was a covariance matrix (3 × 3) of random regression coefficients for additive genetic effect for trait 2, P was a random regression covariance matrix (3 × 3) for permanent environmental effect for trait 2; σR 12 and σR 22 were residual variances for trait 1 and 2, respectively and σR 1σR 2 and σR 2σR 1 were residual (co)variances between trait 1 and 2, respectively.
In order to illustrate differences between MT and RRM, an example of a cow with three lactations is given. Let us consider a cow with 1094 days at first calving (rearing cost of $2845) and lactation length of 356, 480 and 388 days at first, second and third lactations, respectively. Its ROFs through the first, second and third lactations were $802, $697 and $1391, respectively. With MT, −$2845, $802, $697 and $1391 were input values for the four traits analyzed for this cow. In this model, differences in length of lactation were not considered. With RRM, rearing cost ($2845) and cumulative ROF was evaluated in a two-trait model. The first record for cumulative ROF of this cow was $802 and it was regressed to 1450 days (age at second calving = 1094 + 356 days), the second record was $1499 ($802 + $697) and it was regressed to 1930 days (age at third calving = 1450 + 480 days) and the third record was $2890 ($1499 + $1391) and it was regressed to 2318 days (age at the end of third lactation = 1930 + 388 days). The advantage of the RRM model is that it takes into account lactation length and age when ROF was generated.
Variance component estimation
Variance components were estimated using subsamples of data consisting of 145 981 records with MT, 78 866 records from 28 293 cows with RRM. The subsamples were generated from the original data set by randomly selecting 10% and 8% herds for MT and RRM, respectively. Flat priors were used for fixed effects and (co)variances. Variance components were estimated by GIBBS2F90 (Misztal et al., Reference Misztal, Tsuruta, Strabel, Auvray, Druet and Lee2002). A single chain of 150 000 samples was generated for each model. The first 20 000 samples were discarded as a burn-in, and the remaining 130 000 samples were used to compute posterior means of model parameters. Convergence of Gibbs chains was monitored by visual inspections of plots of samples for selected parameters.
Breeding value estimation
Breeding values were estimated by BLUPF90IOD (Tsuruta et al., Reference Tsuruta, Misztal and Stranden2001), for 3 041 078 animals using records of 1 951 893 cows with MT and RRM and variance components estimated previously. EBV for rearing cost and EBV for ROF through the first (P1), second (P2) and third (P3) lactations were calculated. With MT, P1, P2 and P3 were EBVs of the second, third and forth traits. With RRM, P1, P2 and P3 were calculated as EBVs on 1230, 1650 and 1980 days of age, respectively. These ages corresponded to average ages at the end of the first, second and third lactations of Canadian Holstein cows.
Overall ROF EBV (OPROF) was defined as ROF during the first three lactations calculated in MT as:

The MT model assumed that all three lactations contribute equally to the overall ROF. With RRM, profit was defined as a cumulative trait, and therefore, OPROF from this model was equal to P3.
Results and discussion
Heritability of ROF and rearing cost
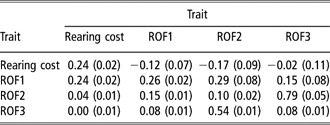
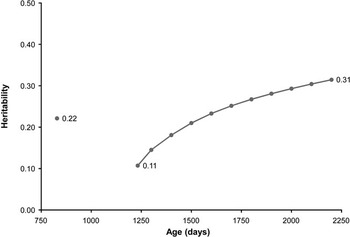
Table 2 reports posterior mean estimates of heritabilities of rearing cost and ROF during the first, second and third lactations and correlations between these traits estimated by MT. Estimates of heritability of rearing cost were 0.23 from MT and 0.22 from RRM (Figure 1). Rearing cost, as defined in this study, is a linear transformation of AFC. Heritability of AFC in Holsteins ranged between 0.086 (Nilforooshan and Edriss, Reference Nilforooshan and Edriss2004) and 0.23 (Allaire and Lin, Reference Allaire and Lin1980). Jamrozik et al. (Reference Jamrozik, Fatehi and Schaeffer2005) estimated heritability of 0.088 for AFC of Canadian Holsteins. Estimates of heritability of ROF during the first, second and third lactations from MT were 0.27, 0.10 and 0.08, respectively. Genetic correlations between first and later lactations decreased with lactation number and ranged from 0.29 through 0.15. In accordance with Visscher and Goddard (Reference Visscher and Goddard1995), profit during the second and third lactations had a genetic correlation ⩾0.80. These results suggest that the first lactation ROF would not be a good indicator of ROF of later lactations, but the second lactation ROF can be used to predict ROF of the third lactation. Estimates of heritability of cumulative ROF from RRM increased with age and ranged from 0.11 to 0.31 (Figure 1). Pérez-Cabal and Alenda (Reference Pérez-Cabal and Alenda2003) analyzed profit per year of productive life of Spanish Holsteins together with production traits, functional herd life and calving interval using an MT model and reported heritability of 0.34, 0.36 and 0.33 for profit per year with data up to the first, second and third lactations, respectively.
Posterior mean estimates of heritabilities (diagonal), genetic correlations (above diagonal) and residual correlations (below diagonal), and their posterior standard deviations (in parenthesis) estimated by multiple-trait model for rearing cost and return over feed of the first (ROF1), second (ROF2) and third (ROF3) lactations

Heritability of rearing cost (single dot) and return over feed (solid line) estimated by random regression model (RRM).

Correlations between rearing cost and profit
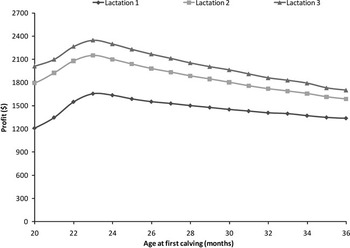
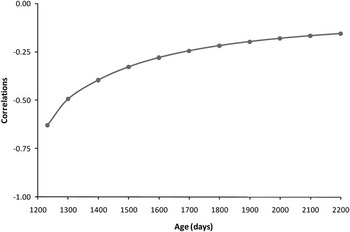
Figure 2 reports an average ROF during the first, second and third lactations fitted as function of AFC. In all three lactations, the relationship between ROF and AFC was curvilinear and ROF was maximized at 23 months of age. This suggests that AFC of 23 months is the optimal age for maximizing ROF during the first, second and third lactations. In MT, rearing cost had low negative genetic correlations of −0.12 and −0.17 with ROF through the first and second lactations, respectively, and close to zero correlations with ROF through the third lactation (Table 2). Cumulative ROF was also negatively genetically correlated with rearing cost, but these correlations were more negative than those for ROF per lactation from MT (Figure 3). The correlations between rearing cost and cumulative ROF from RRM were the most negative at early stages of animal’s life (r = −0.63), and slowly increased with age (r = −0.15). This indicates that genetically AFC (rearing cost) has much larger effect on ROF through the first lactation than on ROF through later lactations. As given in Figure 2, ROF has a nonlinear relationship with AFC (rearing cost). Both RRM and MT assumed a linear relationship between rearing cost and ROF and because of this constraint the correlations between rearing cost and ROF could be biased.
Return over feed at the first, second and third lactations as function of age at first calving.

Trend of genetic correlation between rearing cost and return over feed estimated by random regression model (RRM).

In MT, P1, P2 and P3 are defined as EBVs for ROF from the beginning till the end of lactation but in RRM, as ROF until a given age (1230, 1650 and 1980 days of age). Cows with long AFC are penalized in RRM. For example, assume two cows that calved in the same herd–year–season class and generated the same ROF during the first lactation but the first cow (cow1) had much shorter AFC than the second cow (cow 2). With MT, the cow 1 had the same P1 as cow 2, but with RRM, the cow 1 had higher P1 from RRM than cow 2 because cow 1 had more productive days from first calving until 1230 days of age and therefore had higher ROF from the first calving until 1230 days of age than cow 2. The fact that in RRM, ROF is fitted as a function of age and therefore accounts for differences in age at calving, and length of lactation explains higher negative correlations between rearing cost and cumulative ROF from RRM and ROF per lactation from MT.
Differences among models
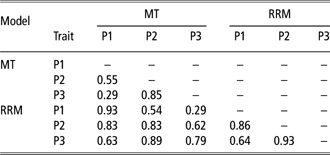
As reported in Table 3, correlations between P1, P2 and P3 from MT, and P2 and P3 from RRM were the highest for the first lactation (0.92, 0.93) and the lowest for the third lactation (0.82, 0.79), which was expected because RRM cumulates ROF with age. With MT, correlations between P1 and P2; P1 and P3; and P2 and P3 were moderate (0.55), small (0.29) and high (0.85), respectively. This indicates that ROF during the first lactation is governed by slightly different factors than ROF during the second and third lactations. Since correlations between P1 from RRM and P2 and P3 from RRM were moderate to high (r ⩾ 0.60), EBV for ROF during the first lactation from RRM can be used for an early prediction of EBV of cumulative ROF during later lactations. Visscher and Goddard (Reference Visscher and Goddard1995) and Pérez-Cabal and Alenda (Reference Pérez-Cabal and Alenda2003) also reported a high correlation between cumulative profit measured early and late in life.
Correlations between estimated breeding values for return over feed during the first (P1), second (P2) and third (P3) lactations estimated by multiple-trait model and random regression model for bulls with at least 50 daughters (N = 4890)

MT = multiple-trait model; RRM = random regression model.
The advantage of RRM is that it has, compared with MT, a flexibility to fit records from lactations in progress and provide measure of genetic merit of ROF for different management systems (with different average herd life), because it can estimate EBV for cumulative ROF for any stage of an animal’s life.
Relationship of profit with other traits
In order to find relationships between ROF and other traits evaluated in Canada, Spearman rank correlations were calculated between EBV for the various measures of ROF and EBV as officially published by the Canadian Dairy Network in August 2007. The correlations were calculated using EBV of sires that were officially proven for each particular trait. In Canada, Holstein bulls are required to have ⩾20 daughters in ⩾10 herds in order to be officially proven for production traits, type, herd life and female fertility traits; and ⩾10 daughters in ⩾10 herds for both direct and maternal calving ease (Canadian Dairy Network (CDN), 2009a).
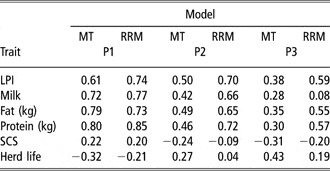
Table 4 presents correlations between P1, P2 and P3 and official EBVs for LPI, milk, fat and protein yield, somatic cell score (SCS) and herd life. In Canada, higher EBVs are desirable for LPI, production traits and herd life, and lower EBVs are desirable for SCS. Correlations between EBVs for LPI and for ROF decreased with lactation number and were the highest with EBV from RRM (0.74). This suggests that current definition of LPI is the closest to our definition of ROF during the first lactation from RRM. None of correlations between profit EBV and LPI reached unity because profit, as defined in this study, by ROF uses production of the whole lactation rather than only 305-day production, like in LPI, and also different traits are considered in the CanWest DHI profitability function than in LPI, and different weights are assigned to traits common to both approaches. Higher correlation between EBVs for ROF and for LPI could be obtained by incorporating reproduction and health cost into the profit functions. However, because the current functions should account for 95% of overall costs (Tigges et al., Reference Tigges, Pearson and Vinson1984), large increase in correlations is not expected.
Correlations between estimated breeding values (EBVs) for return over feed during the first (P1), second (P2) and third lactations (P3) estimated by multiple-trait model and random regression model, and EBV for milk, fat protein yields, somatic cell score, Lifetime Profit Index and herd life

MT = multiple-trait model; RRM = random regression model; LPI = Lifetime Profit Index; SCS = somatic cell score.
Production traits EBV had high (r > 0.70), moderate (r > 0.40) and small (r > 0.08) correlations with P1, P2 and P3, respectively. Protein EBV had the highest correlation with ROF from all production traits, which reflects the current multiple-component milk payment system in Canada. Another reason for the high correlations between ROF and protein EBV could be that the profit functions used in this study to calculate ROF approximated feed cost using only the kilogram of fat and assumed fixed fat–protein ratio. This simplification might have caused an overestimation of EBV for cows with low fat–protein ratio.
Both correlations between P1 and SCS (0.20 to 0.22) and herd life (−0.21 to −0.38) were undesirable. However, P2 and P3 had desirable correlations with SCS (−0.09 to −0.31) and herd life (0.04 to 0.43) that increased with lactation number.
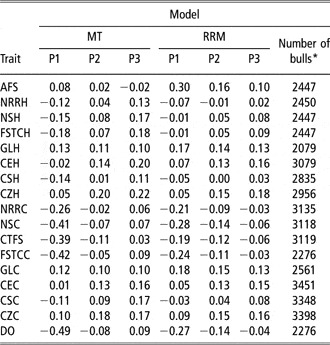
Table 5 presents correlations between P1, P2 and P3 with EBV for 19 reproduction traits. In Canada, EBVs for reproduction traits are expressed as relative breeding values (RBV, standardized to mean of 100 and standard deviation of 5). High RBV values are desirable, thus positive correlations with profit are desirable. All heifer reproduction traits had low unfavorable correlations with EBVs for ROF during the first lactation; with exception of age at first service, which had correlations of 0.08 and 0.30 with P1 from MT and RRM, respectively. Unfavorable moderate correlations were reported between EBVs for number of services, calving to first service, first service to conception for cows and days open and P1 from MT. With RRM, P1 was also negatively correlated with EBVs of these reproduction traits, but the correlations were much smaller. This suggests that the most profitable cows during the first lactation are cows with excellent production, undesirable SCS, below-average herd life, and such cows would have difficulty conceiving during later lactations. In later parities, majority of reproduction traits were positively correlated with P2 and P3 from MT; however, these correlation were all <0.21. With RRM, correlations between P2, P3 and EBV of reproduction traits ranged from −0.14 (number of services for cows and days open) to 0.18 (calf size for heifers). On the basis of these results, cows that are profitable during the second and third lactations can be described as those with moderate production, good health and desirable reproduction and longevity. It seems that cows that are most profitable at the first lactation are different than those that are most profitable at later lactations. At first lactation, the most important factor for profit seems to be production. However, high production leads to higher SCS, poor fertility and higher risk of diseases and consequently higher risk of culling. At later lactations, only cows that conceived and stayed healthy were allowed to generate profit; therefore, such cows had to be more robust than cows that were most profitable at the first lactation, but had below-average herd life and reproduction and health. In Kulak et al. (Reference Kulak, Dekkers, McAllister and Lee1997), cows that survived the first lactation had by $487 higher lifetime profit than cows with only first lactation.
Correlations between bull estimated breeding value (EBV) for return over feed during the first (P1), second (P2) and third (P3) lactations estimated by multiple-trait model and random regression model and EBV for age at first service, non-return rate in heifers, number of services in heifers, first service to conception in heifers, gestation length in heifers, calving ease in heifers, calf survival in heifers, calf size in heifers, non-return rate in cows, number of services in cows, calving to first service, first service to conception in cows, gestation length in cows, calving ease in cows, calf survival in cows, calf size in cows and days open

MT = multiple-trait model; RRM = random regression model; AFS = age at first service; NRRHs = non-return rate in heifers; NSHs = number of services in heifers; FSTCHs = first service to conception in heifers; GLHs = gestation length in heifers; CEHs = calving ease in heifers; CSHs = calf survival in heifers; CZHs = calf size in heifers; NRRCs = non-return rate in cows; NSCs = number of services in cows; CTFS = calving to first service; FSTCCs = first service to conception in cows; GLCs = gestation length in cows; CECs = calving ease in cows; CSCs = calf survival in cows; CZCs = calf size in cows; DO = days open.
High EBV for reproduction trait is desirable.
*Number of bulls that were officially proven in August 2007 for a particular trait.
Table 6 reports correlations between OPROF with official EBVs for LPI, milk, fat and protein yields, SCS and herd life. LPI had higher correlation with OPROF from MT (0.66) than with OPROF from RRM (0.59). Pérez-Cabal and Alenda (Reference Pérez-Cabal and Alenda2003) reported correlation of 0.46 between EBVs for profit and Spanish economic index MEG. The EBVs for production traits were moderately correlated with OPROF, which was expected since ROF is mainly based on milk production. The EBVs for production traits had high genetic correlations with lifetime profit in studies by Visscher and Goddard (Reference Visscher and Goddard1995) and Pérez-Cabal and Alenda (Reference Pérez-Cabal and Alenda2003). Close to zero correlations and small favorable correlations were reported between both EBVs for SCS and herd life and OPROF from MT and RRM, respectively.
Correlations between estimated breeding value (EBV) for overall return over feed EBV estimated by multiple-trait model and random regression model with EBV for milk, fat protein yields, somatic cell score, lifetime profit index and herd life

MT = multiple-trait model; RRM = random regression model; LPI = Lifetime Profit Index; SCS = somatic cell score.
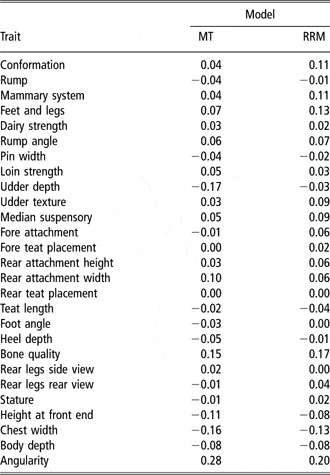
As reported in Table 7, the majority of EBVs for type traits, except of angularity and bone quality, did not have a significant relationship with OPROF, which is in agreement with Norman et al. (Reference Norman, Cassell, Pearson and Wiggans1981), suggesting that type traits do not have a large effect on cow profitability. Almost all correlations between EBVs for type traits and OPROF were positive. Small negative correlations were reported between OPROF and EBV for udder depth, front end and chest width. Pérez-Cabal and Alenda (Reference Pérez-Cabal and Alenda2003) reported positive genetic correlation between EBVs for profit and for majority of type traits, with exception for body depth and udder depth; however, their correlations were higher than in our study. Pérez-Cabal et al. (Reference Pérez-Cabal, Garcia, Gonzalez-Recio and Alenda2006) reported positive small genetic correlations of 0.10, 0.05 and 0.04 between EBVs for profit and for feet and legs, foot angle and rear leg set, respectively. Pérez-Cabal and Alenda (Reference Pérez-Cabal and Alenda2003) described a profitable cow as an animal with a tightly held and conformed udder that is able to withstand high production and is resistant to diseases. St-Onge et al. (Reference St-Onge, Hayes and Cue2002) reported positive relationship between feet and legs and conformation and lifetime profit. This could indicate that Holstein cows that have higher genetic value for feet and legs tend to live longer and consequently generate higher lifetime profit.
Correlation for overall estimated breeding value (EBV) for overall return over feed EBV estimated by multiple-trait model and random regression model with EBV for type traits (N = 4942)

MT = multiple-trait model; RRM = random regression model.
Mulder and Jansen (Reference Mulder and Jansen2001) derived economic values for Canadian Holstein cows using discounted lifetime profit adjusted for opportunity cost (DLPOC) calculated by a profit function that in addition to the factors included in ROF also considered calf sales, slaughter value and opportunity cost of postponed replacement. Opportunity cost is the potential income forgone by not choosing to replace a cow by a heifer. Production traits had higher phenotypic correlations with DLPOC than with type traits and protein had the highest correlations. Both herd life and SCS had low favorable correlations with DLPOC. This is in agreement with results from this study. However, Mulder and Jansen’s phenotypic correlations between discounted lifetime profit and production traits were smaller than correlations between EBVs for OPROF and for production traits estimated in this study. This is probably because this study considered only first three lactations and because the income in ROF is entirely determined by income from milk production.
De Haan et al. (Reference De Haan, Cassell, Pearson and Smith1992) compared relative net income (RNI) introduced by Norman et al. (Reference Norman, Cassell, Pearson and Wiggans1981) and RNI adjusted for opportunity cost and type traits. The authors reported that both RNI and RNI adjusted for opportunity cost had low phenotypic correlations with type traits and large correlations with first lactation milk yield. Van Arendonk (Reference Van Arendonk1991) reported that ignoring opportunity cost of postponed replacement in profit equations can lead to overestimation of importance of the effect of herd life on lifetime profit. Kulak et al. (Reference Kulak, Dekkers, McAllister and Lee1997) noted that opportunity cost is accounted for herd management decisions. Profit adjusted for opportunity cost makes a direct comparison of profitability of cows across farms possible.
ROF, as defined in this study, did not consider differences in maintenance of feed cost among animals. Larger cows require more energy for maintenance than small cows. This simplification could have biased our estimates and overestimated EBV of cows with larger frame. If our model, overestimated EBV of larger cows than high positive correlations would be observed between RFO and type traits describing size of the animal (rump, chest width, body depth). However, low negative correlations were reported between EBV of ROF and these type traits.
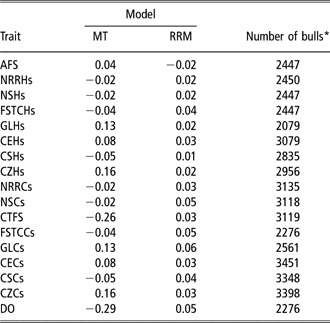
Table 8 reports correlations between OPROF with 19 reproduction traits. Reproduction traits that had a negative effect on OPROF from MT were calving to first service and days open suggesting that cows with delayed conception may be more profitable at a genetic level. Reproduction traits with a positive effect on ROF were calf size for progeny born from heifers and cows. No significant relationship was reported between OPROF from RRM and reproduction traits.
Correlations between bull estimated breeding value (EBV) for overall return over feed EBV estimated by multiple-trait model and random regression model, and EBV for age at first service, non-return rate in heifers, number of services in heifers, first service to conception in heifers, gestation length in heifers, calving ease in heifers, calf survival in heifers, calf size in heifers, non-return rate in cows, number of services in cows, calving to first service, first service to conception in cows, gestation length in cows, calving ease in cows, calf survival in cows, calf size in cows and days open

MT = multiple-trait model; RRM = random regression model; AFS = age at first service; NRRH = non-return rate in heifer; NSHs = number of services in heifers; FSTCHs = first service to conception in heifers; GLHs = gestation length in heifers; CEHs = calving ease in heifers; CSHs = calf survival in heifers; CZHs = calf size in heifers; NRRCs = non-return rate in cows; NSCs = number of services in cows; CTFS = calving to first service; FSTCCs = first service to conception in cows; GLCs = gestation length in cows; CECs = calving ease in cows; CSCs = calf survival in cows; CZCs = calf size in cows; DO = days open.
High EBV for reproduction trait is desirable.
*Number of bulls that were officially proven in August 2007 for a particular trait.
One of the major weaknesses of the RFO is that it does not take into account reproduction and health cost. Reproduction cost is highly influenced by management decisions; a high-producing cow will be more likely inseminated with more expensive semen than a low-producing cow. This could be avoided by using the average price of semen instead of the actual price. But, still the effect of the farmer will be present, because it is the farmer who decides whether a cow with fertility problems will be bred repeatedly or culled. Another question is whether cost of synchronization and embryo transfer should be part of the profit index. Health costs are difficult to trace. In 2007, a new health data recording system was introduced in Canada for dairy cattle (CDN, 2009b). However, at this point, only limited number of farms report diseases in their herds on regular basis. Both MT and RRM partly account for indirect costs related to health and reproduction. A cow with serious health or reproductive problems will be most likely culled. Such a cow will be in our models penalized by assigning profit during subsequent lactation(s) to zero. Cows with moderate health problems will have most likely lower test-day yield and therefore will have lower profit than healthy cows.
Kulak (Reference Kulak1994) used complex profit equations, which considered both health and reproductive cost, to study relationship of profit with other traits. In his study, average milk revenue was reported to be the most important income trait. Days dry had the highest negative impact on profitability, followed by AFC and reproductive diseases. Lifetime reproductive traits and diseases were significantly related to DLPOC.
The disadvantage of the MT model is that it does not account for length of lactation and favors cows with long calving intervals. Cows with longer days open will have longer lactations and consequently could have larger profit than cows that conceived early in lactation only because they lactated for longer period. The weakness of RRM is that it benefits cows with low AFC. As shown in Figure 2, phenotypic relationship between AFC and profit is curvilinear. The optimal AFC for maximizing profit is 23 months. Ettema and Santos (Reference Ettema and Santos2004) reported that cows with AFC < 23 months had increased calving difficulty and higher incidence of stillbirths than cows with larger AFC. Selection using EBV from RRM could decrease average AFC, which could have a negative effect on certain traits such as calving ease and calf survival.
Conclusions
ROF per lactation and cumulative profit derived from the CanWest DHI profit functions are moderately heritable traits, with estimates of heritabilities ranging from 0.08 to 0.31. Sire’s EBV for ROF had favorable correlations with LPI, EBV for production traits and SCS. Both models, proposed in this study, can be used to calculate genetic merit of ROF of dairy cows. The RRM model seems to be a more suitable model for estimating breeding values of cow’s ROF. It better accounts for environmental effects than MT; it can fit records from lactations in progress, and EBV for ROF can be calculated for any stage of animal’s life.
The ROF is a good indicator of cow profitability despite the fact that it is a simplified profit index that does not account for animal-specific health and reproductive cost. However, because ROF does not account for differences in heritabilities between components of profit, ROF is not recommended to be used for direct selection for profit.
Acknowledgements
Funding was provided by Agriculture and Agri-Food Canada. Appreciation is extended to Ignacy Misztal for providing GIBBS2F90 and BLUPF90iod programs. The Authors thank Mr Ian Rumbles (CanWest DHI) and Drs Robert Moore and Daniel Lefebvre (VALACTA) for their helpful feedback and also thank the section editor and two anonymous reviewers for their helpful comments and suggestions.