




No CrossRef data available.
Article contents
Predicting change with the RBANS in a community dwelling elderly sample
Published online by Cambridge University Press: 01 October 2004
Abstract
Repeated neuropsychological assessments are common with older adults, and the determination of clinically significant change across time is an important issue. Regression-based prediction formulas have been utilized with other patient and healthy control samples to predict follow-up test performance based on initial performance and demographic variables. Comparisons between predicted and observed follow-up performances can assist clinicians in determining the significance of change in the individual patient. In the current study, multiple regression-based prediction equations for the 5 Indexes and Total Score of the RBANS were developed for a sample of 223 community dwelling older adults. These algorithms were then validated on a separate elderly sample (N = 222). Minimal differences were present between observed and predicted follow-up scores in the validation sample, suggesting that the prediction formulas are clinically useful for practitioners who assess older adults. A case example is presented that illustrates how the algorithms can be used clinically. (JINS, 2004, 10, 828–834.)
Information
- Type
- Research Article
- Information
- Journal of the International Neuropsychological Society , Volume 10 , Issue 6 , October 2004 , pp. 828 - 834
- Copyright
- © 2004 The International Neuropsychological Society
INTRODUCTION
Neuropsychologists are frequently asked to determine if there have been changes in the cognitive abilities in older patient populations. Typically, referral sources are concerned with cognitive decline associated with a progressive neurological condition (e.g., Alzheimer's disease) or surgical procedure (e.g., tumor resection, hip replacement) or improvements due to an intervention (e.g., medication, cognitive rehabilitation). To make the decision of neuropsychological change in the individual patient, clinicians have had several statistical procedures at their disposal (e.g., Reliable Change Index: Jacobson & Truax, 1991; Reliable Change Index: Zegers & Hafkenscheid, 1994; Reliability–Stability Index: Chelune et al., 1993; Reliability–Stability Index: McSweeny et al., 1993; for a review of these formu-las, see Bruggemans et al., 1997, or McCaffrey et al., 2000). Alternatively, regression-based formulas (McSweeny et al.) have been developed using demographic variables and performance at the initial testing (i.e., Time 1) to predict performance at retest (i.e., Time 2). Although these regression-based formulas have some distinct advantages over other methods, such as accounting for individual differences, they also have some unique challenges. For example, large samples are often needed to develop and then validate these formulas.
Existing research on regression-based change formulas has utilized both patient and control samples. McSweeny et al. (1993) and others (Hermann et al., 1996; Sawrie et al., 1996) have developed change formulas on a large battery of neuropsychological measures in patients with epilepsy. The predicted scores can be used to assist clinicians in determining if there has been a meaningful change in functioning following surgery. Similarly, the discrepancies between predicted and observed follow-up scores allowed Bruggemans et al. (1997) to weigh the neuropsychological effects of cardiac surgery in the individual patient. More recently, Temkin et al. (1999) applied the same methodology to a large sample of neurologically stable adults. The development of “normal” change algorithms potentially allows for a broader application of the formulas. A consistent finding across these studies is that initial performance on a test is the best predictor of retest performance, and demographic variables slightly improve prediction accuracy. The patients in the aforementioned studies, however, tended to be young (e.g., majority under 50 years old), and therefore less relevant to the prediction of change in older adults. A notable exception is the standardized regression-based methodology of Sawrie et al. (1999), who developed change formulas specifically applicable to older adults. Another problematic issue in the earlier studies is that it is unlikely that older patients will be evaluated (either initially or on retest) as extensively as the patients in those studies. Therefore, there is a need for age-appropriate prediction formulas on healthy older adults with briefer screening measures.
One such measure is the Repeatable Battery for the Assessment of Neuropsychological Status (RBANS; Randolph, 1998), which was designed to be a brief, repeatable, stand-alone battery tapping discrete neuropsychological domains. It is more comprehensive than other screening measures of cognitive functioning typically used with elderly patients with suspected neurological impairment (e.g., Mini-Mental State Examination: Folstein et al., 1975; Dementia Rating Scale: Mattis, 1988). Given its brevity and its ability to tap multiple cognitive domains, clinicians' use of the RBANS in follow-up evaluations is more likely. As such, it is important to be able to predict change scores, which when compared to obtained retest performances, can assist in making the determination of the amount of change in the individual patient. Unfortunately, besides the test's manual, there is very little test–retest data on this instrument (see Wilk et al., 2002, for an exception).
The purpose of this study was to develop regression-based change formulas for the RBANS using a large sample of community dwelling older adults, and then compare the accuracy of these scores in an independent sample.
METHODS
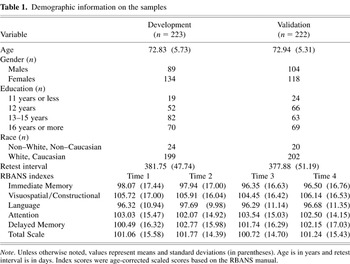
Data for the present study represents a subsample of the Oklahoma Longitudinal Assessment of Health Outcomes in Mature Adults (OKLAHOMA) study. In this study, individuals were recruited from the practices of family physicians throughout central Oklahoma to assess various indicators of health functioning across time. Physicians in these practices reviewed their billing records and identified patients 65 years or older with a visit in the past 18 months. Staff members eliminated patients who were thought to be too confused to understand and sign informed consent. Prior to inclusion into the study, a research nurse and the Project Coordinator for the OKLAHOMA study interviewed each individual (n = 955). Based on these contacts, an additional 156 individuals were eliminated because it was judged that they lacked the cognitive capacity to make informed decisions. Of the remaining 799 participants initially assessed, 500 were re-evaluated approximately 1 year later. An additional 55 patients were eliminated from further analyses (n = 445) for a variety of self-reported comorbid medical conditions that were thought to negatively impact their cognitive functioning (e.g., stroke or transient ischemic attack, head injury, concussion, seizures, Parkinson's disease, brain hemorrhage). The remaining 445 participants were randomly divided into two groups (development group, n = 223; validation group, n = 222). Demographic information and retest intervals for the two groups are provided in Table 1. All participants completed Form A of the RBANS (Randolph, 1998) on both occasions, and their scores are also presented in Table 1. Sensory deficits (e.g., macular degeneration) precluded some participants from completing all subtests.
Demographic information on the samples

The RBANS (Randolph, 1998) is a brief, individually administered test measuring attention, language, visuospatial/constructional abilities, and immediate and delayed memory. It consists of 12 subtests, which yield five Index scores and a Total Scale score. Normative information from the manual for the Index and Total scores is based on 540 healthy adults who ranged in age from 20–89 years old. All subtests were administered and scored as defined in the manual, with the exception of the Figure Copy and Figure Recall, which is more thoroughly described in Duff et al. (2003). In brief, minor modifications were made to the original scoring criteria for Figure Copy and Recall based on communications with the RBANS developer (C. Randolph, personal communication, January 18, 2003 and March 3, 2003), which were less rigid than the scoring criteria reported in the manual. Utilizing these modified scoring criteria, scores for these two subtests more closely approximated the normative information reported by Randolph (1998). A copy of these modified scoring criteria can be obtained from the first author.
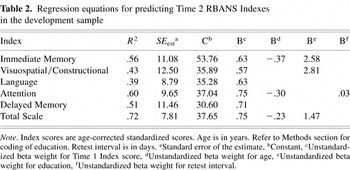
Based on McSweeny et al. (1993), stepwise multiple regression analyses were used to derive prediction equations in the development sample. In these alogorithms, our intent was to provide the best prediction of a Time 2 Index score from the available data at Time 1. Therefore, demographic variables (age, gender, education, race), retest interval, and the Time 1 Index score were regressed on a single Time 2 Index score (e.g., demographic variables, retest interval, and Time 1 Immediate Memory was regressed on Time 2 Immediate Memory). Age was represented as years old at Time 1. Gender was coded as female = 0, and male = 1. Education was coded as 11 years or less = 1, 12 years = 2, 13–15 years = 3, or 16 years or more = 4. Race was coded as non-White/non-Caucasian = 0, or White/Caucasian = 1. The inclusion of these demographic variables, and their respective categorizations, has been empirically supported in other investigations with this same dataset (Beatty et al., 2003; Duff et al., 2003; Patton et al., in press). Retest interval was represented as days from Time 1 to Time 2. Index scores were age-corrected standard scores calculated from the RBANS manual, with a mean of 100 and a standard deviation of 15. A separate prediction equation was generated for each of the Indexes and the Total Score using the development sample. No variables were forced into the equations, rather their entry or removal was empirically determined (e.g., entry: p = .05, removal: p = .10).
Predicted Time 2 scores were then generated for each participant in the validation sample, and their observed Time 2 scores were compared to the predicted Time 2 scores. Several methods were employed to compare observed and predicted Time 2 scores in the validation sample, including pair-wise t tests, effect sizes (i.e., d; Cohen, 1988), Pearson correlations, and the percentage of cases' predicted score falling within ±5 and ±10 points of the observed score.
RESULTS
There were no significant differences between the development and validation samples across age, gender, education, race, or retest interval. Time 1 and Time 2 RBANS scores were not significantly different between the groups (p > .01 for all comparisons).
The results of the prediction of Time 2 RBANS Indexes based on the development sample are presented in Table 2. For each Index score, the final model's R2, standard error of the estimate, constant, and unstandardized beta weights for relevant variables are listed. The final model in predicting Immediate Memory at Time 2, which included Immediate Memory at Time 1, age, and education, accounted for a significant amount of variance [F(3,219) = 90.95, p < .001]. Visuospatial/Constructional Time 2 was best predicted by Visuospatial/Constructional Time 1 and education [F(2,220) = 80.85, p < .001]. Language Time 2 was best predicted by Language Time 1 [F(2,218) = 136.22, p < .001]. Attention Time 1, age, and retest interval best predicted Attention Time 2 [F(3,217) = 106.21, p < .001]. Delayed Memory Time 2 was best predicted by Delayed Memory Time 1 [F(1,220) = 225.23, p < .001]. Finally, the follow-up Total Score is best predicted by Total Score Time 1, age, and education [F(3,216) = 184.71, p < .001].
Regression equations for predicting Time 2 RBANS Indexes in the development sample

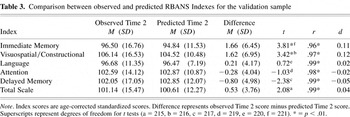
Predicted Time 2 scores for the validation sample, based on the formulas in Table 2, are presented in Table 3. The mean differences between observed and predicted Time 2 scores were minimal, ranging from −0.80 (Delayed Memory) to 1.65 (Immediate Memory) Index points. Pairwise comparisons between observed and predicted scores for the validation sample were significant for the Immediate Memory [t(221) = 3.81, p < .01] and Visuospatial/Construction [t(216) = 3.42, p < .01]) Indexes. All other Index and Total Score comparisons were nonsignificant (p > .01). Effect sizes (i.e., Cohen's d) were all small (i.e., ≤ .20).
Comparison between observed and predicted RBANS Indexes for the validation sample

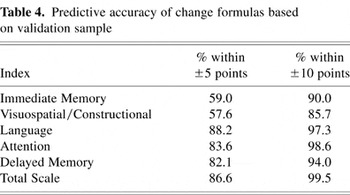
Table 4 displays the percentage of cases whose predicted Time 2 score fell within ±5 Index points and within ±10 Index points of the observed Time 2 score. As can be seen in the table, 86% of the patients' predicted Time 2 Total Score was within ±5 points of its observed Time 2 score, and 99% were within ±10 points on that same measure. For the individual Indexes, the Language Index prediction formula was the most accurate (i.e., identifying 88% and 97% of the cases within ±5 and ±10 points, respectively), and the Visuospatial/Constructional Index prediction formula was the least accurate (i.e., identifying 58% and 86% within 5 and 10 points, respectively).
Predictive accuracy of change formulas based on validation sample

DISCUSSION
The present study presents regression formulas that were designed to predict follow-up performances on the RBANS, which were derived from a large sample of community dwelling older adults. Consistent with previous research (McSweeny et al., 1993; Temkin et al., 1999), initial performance on a measure (i.e., Time 1 score) was the best predictor of follow-up performance (i.e., Time 2) on that same measure, although other factors, including demographic variables, also added to the predictive value of the formulas. Within the current study, predictor variables accounted for approximately 39–72% (M = 53%) of the variance of the criterion variables (i.e., R2 of multiple regression equations). Although these findings do not capture the entirety of the Time 2 scores, they are similar to those reported by others (Hermann et al., 1996; Sawrie et al., 1996) using different patient samples. Temkin et al. (1999) reported slightly higher relationships between predictor and criterion variables, but they only presented on a limited set of neuropsychological measures. It is possible that the inclusion of other variables (e.g., education defined continuously rather than categorically, broader range of racial/ethnic status, medical conditions of the patient, psychometric stability of the measures, occupational status of the patient, or squared and cubed transformations of the Time 1 measures; see Temkin et al.) may further increase the robustness of these formulas.
An individual's Index score at Time 1 was consistently the best predictor of their Time 2 performance. For example, when looking at the standardized beta weights from the regression equations, nearly 80% of Total Score's Time 2 performance could be identified with its Time 1 score. Demographic variables, however, were less equitably distributed among the regression algorithms, in that age was utilized by three equations, education by three, while gender and race did not significantly contribute to any RBANS Index scores. The inclusion of age into equations was unexpected due to the relatively restricted age range of the sample (i.e., 64–90 years old) and given that Index scores are already age-corrected. Education's impact was less surprising, as its relationship with intelligence and other neuropsychological measures has been repeatedly demonstrated (e.g., Heaton et al., 1991). Test–retest interval was only used in one of the regression formulas, which may also be due to the restricted range in that the duration between testings was approximately 1 year for most participants. Past research (Temkin et al., 1999), however, suggests that some measures are more affected by the length of time between evaluations.
As noted above, it is not surprising that demographic factors contributed to the prediction of follow-up scores; however, the process by which they contribute is less clear. Unlike a single-session evaluation, where demographic factors affect performance at one point in time, repeated assessments are considerably more complex. In a re-evaluation, age and education could affect Time 1 scores, Time 2 scores, and the change in scores from Time 1 to Time 2. That is, there is likely some synergistic effect of age, education, and other factors on the change in performance across time (McCaffrey et al., 2000). For example, it is possible that change occurs differently in older individuals with lower education attainment. Indeed, intelligence has been shown to interact with repeated assessments, practice effects, and the determination of change across time (Rapport et al., 1997a, 1997b; Rentz et al., 2004).
In addition to developing the prediction formulas, the present study also empirically assessed the utility of these formulas by validating them in a separate sample of healthy older adults. The mean differences between observed and predicted Time 2 scores were minimal in the validation sample, and ranged from −0.80 (Delayed Memory) to 1.65 (Immediate Memory). Overall, the regression equations were accurate in predicting the observed score with the mean difference across Indexes being 0.48 Index points. Two of the predicted Indexes were significantly different from their observed counterparts, but the magnitude of these differences was small. Correlations between observed and predicted scores were also statistically significant for all measures, and indicated a strong relationship between these scores.
To further evaluate the clinical utility of the prediction equations, the percentage of cases whose predicted Time 2 score fell within ±5 or ±10 points of their observed Time 2 score was assessed in the validation sample. As expected, the Total Score had the greatest combined accuracy, with 86% of the cases falling within ±5 points, and 99% falling within ±10 points. Although the individual Indexes tended to have slightly lower hit rates, clinicians should feel confident in predicting Time 2 scores using the proposed algorithms.
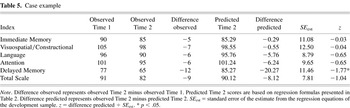
Practitioners who have not used these techniques previously may also benefit from a brief case example illustrating their use. The patient is a 75-year-old retired White male with 10 years of education who was evaluated for complaints of memory problems approximately 1 year ago. His RBANS scores from that time are presented in Table 5. Due to his borderline memory performances, a diagnosis of mild cognitive impairment was made and a follow-up evaluation in 1 year was recommended. Observed Time 2 RBANS scores are also presented in Table 5, along with the difference between Time 1 and Time 2 observed scores. Predicted Time 2 scores (based on the equations in Table 2) and the difference between observed and predicted Time 2 scores are also presented. An initial review of the differences between observed Time 1 and 2 scores suggests that the patient has declined across all cognitive domains in the course of the year, from 1/3 to 4/5 of an Index standard deviation (SD = 15). Such a progressive decline, especially if accompanied by deterioration of activities of daily living, might lead a clinician towards the diagnosis of dementia.
Case example

If the clinician were to utilize the prediction equations from the current study, however, s/he might come to a different conclusion. Specifically, when Time 2 predicted differences (i.e., predicted Time 2 score − observed Time 2 score) are compared to observed differences (i.e., observed Time 1 score − observed Time 2 score), it is revealed that observed decline is greater than predicted decline for some of the Indexes (e.g., Immediate Memory: observed = −5, predicted = −.29). For other Indexes (e.g., Attention and Total Score), predicted and observed differences are similar (e.g., Attention: observed = −6, predicted = −6.24). Finally, the predicted difference (−20.27) is much greater than the observed difference (−12) for the Delayed Memory Index. When the predicted/observed differences are converted to standard metric by dividing them by their respective standard error of the estimates (Hermann et al., 1996; McSweeny et al., 1993; Sawrie et al., 1996), it is revealed that only the Delayed Memory Index demonstrates a statistically significant decline (i.e., z > |1.64|).
Hence, when the statistical data are considered, it appears that the patient in question only shows a significant decline in Delayed Memory, which might prompt the clinician to retain the diagnosis of mild cognitive impairment, rather than infer the expression of a full dementia. It should be noted, however, that we are not advocating for a strictly psychometric assessment of any patient (i.e., based solely on test data, without the complementing historical information or behavioral observations), rather we are attempting to provide clinicians with the necessary psychometric information to assist in the clinical decision-making process. A copy of the computer program used to calculate the predicted scores, difference scores, and test of the differences' significance can be obtained from the first author.
Several limitations of the present study should be noted. First, as with most regression-based prediction formulas (Tabachnick & Fidell, 1996), the current RBANS equations are likely to provide the best estimates of Time 2 performances for individuals who do not fall at the extremes of functioning (e.g., <2nd percentile or >98th percentile) at Time 1. In these cases, the prediction equations are more susceptible to regression to the mean effects, and will likely overestimate or underestimate predicted Time 2 scores. Similarly, the use of these formulas outside the demographic and situational parameters of the sample (e.g., <64 or >90 years old; relatively brief or extended retest intervals) may increase error. Readers are reminded that all Figure Copy and Figure Recall protocols were scored using slightly modified scoring criteria than those specified in the RBANS manual. Finally, participants in the current study do not represent “optimal” aging, as defined by the American Psychological Associate Working Group on the Older Adult (1998). Rather, they may be more representative of “normal” aging patterns, which include individuals with numerous medical conditions. In fact, the absence of a significant practice effect (see Table 1) in this sample raises the possibility that this group of older adults might be slightly declining in their cognitive abilities.
In conclusion, the present prediction algorithms have the potential to provide more accurate assessments of possible change in the individual patient by considering the influence of initial performance, practice effects, test–retest interval, and other demographic factors. These equations provided estimates that closely approximated actual Time 2 Index scores. In addition to providing prediction equations on a new measure, the RBANS, the current study also extends the existing literature in this area to include formulas relevant for practitioners who evaluate older adults. Future research should continue to expand this limited knowledge base, as this segment of the population continues to grow. Additionally, validation of the effectiveness of these formulas in a clinical sample would further extend their clinical utility.
ACKNOWLEDGMENTS
The authors would like to extend their thanks to the Department of Family Medicine at the University of Oklahoma Health Sciences Center for their continued support of this project. Portions of this paper were previously presented at the 32nd Annual Meeting of the International Neuropsychological Society in Baltimore, Maryland.
References
REFERENCES
American Psychological Associate Working Group on the Older
Adult.
(1998).
What practitioners should know about working with older adults.
Professional Psychology: Research and Practice,
29,
413–427.Google Scholar
Beatty, W.W.,
Mold, J.W., &
Gontkovsky, S.T.
(2003).
RBANS performance: Influences of sex and education.
Journal of Clinical and Experimental Neuropsychology,
25,
1065–1069.Google Scholar
Bruggemans, E.F.,
Van de Vijver, F.J.R., &
Huysmans, H.A.
(1997).
Assessment of cognitive deterioration in individual patients
following cardiac surgery: Correcting for measurement error and
practice effects.
Journal of Clinical and Experimental Neuropsychology,
19,
543–559.Google Scholar
Chelune, G.J.,
Naugle, R.I.,
Luders, H.,
Sedlak, J., &
Awad, I.A.
(1993).
Individual change after epilepsy surgery: Practice effects and
base-rate information.
Neuropsychology,
7,
41–52.Google Scholar
Cohen, J.
(1988).
Statistical power analysis for the behavioral sciences
(2nd ed.).
Mahwah, NJ:
Lawrence Erlbaum Associates, Inc.
Duff, K.,
Patton, D.E.,
Schoenberg, M.R.,
Mold, J.,
Scott, J.G., &
Adams, R.A.
(2003).
Age- and education-corrected independent normative data for the
RBANS in a community dwelling elderly sample.
Clinical Neuropsychologist,
17,
351–366.Google Scholar
Folstein, M.F.,
Folstein, S.E., &
McHugh, P.R.
(1975).
“Mini Mental State”: A practical guide of grading the
cognitive state of patients for the clinician.
Journal of Psychiatric Research,
12,
189–198.Google Scholar
Heaton, R.K.,
Grant, I., &
Matthews, C.G.
(1991).
Comprehensive norms for an expanded Halstead-Reitan Battery:
Demographic corrections, research findings, and clinical
applications.
Odessa, FL:
Psychological Assessment Resources.
Hermann, B.P.,
Seidenberg, M.,
Schoenfeld, J.,
Peterson, J.,
Leveroni, C., &
Wyler, A.R.
(1996).
Empirical techniques for determining the reliability, magnitude,
and pattern of neuropsychological change after epilepsy surgery.
Epilepsia,
37,
942–950.Google Scholar
Jacobson, N.S. &
Truax, P.
(1991).
Clinical significance: A statistical approach to defining
meaningful change in psychotherapy research.
Journal of Consulting and Clinical Psychology,
59,
12–19.Google Scholar
Mattis, S.
(1988).
Dementia Rating Scale Professional manual.
Odessa, FL:
Psychological Assessment Resources, Inc.
McCaffrey, R.J.,
Duff, K., &
Westervelt, H.J.
(2000).
Practitioner's guide to evaluating change with
neuropsychological assessment instruments.
New York:
Kluwer/Plenum.
McSweeny, A.J.,
Naugle, R.I.,
Chelune, G.J., &
Luders, H.
(1993).
“T scores for change”: An illustration of a regression
approach to depicting change in clinical neuropsychology.
Clinical Neuropsychologist,
7,
300–312.Google Scholar
Patton, D.E.,
Duff, K.,
Schoenberg, M.R.,
Mold, J.,
Scott, J.G., &
Adams, R.A.
(2003).
Performance of cognitively normal African Americans on the RBANS in
community dwelling older adults.
Clinical Neuropsychologist,
17,
513–530.Google Scholar
Randolph, C.
(1998).
Repeatable Battery for the Assessment of Neuropsychological Status
manual.
San Antonio, TX:
The Psychological Corporation.
Rapport, L.J.,
Axelrod, B.N.,
Theisen, M.E.,
Brines, B.,
Kalechstein, A.D., &
Ricker, J.H.
(1997a).
Relationship of IQ to verbal learning and memory: Test and retest.
Journal of Clinical and Experimental Neuropsychology,
19,
655–666.Google Scholar
Rapport, L.J.,
Brines, B.,
Axelrod, B.N., &
Theisen, M.E.
(1997b).
Full scale IQ as mediator of practice effects: The rich get richer.
Clinical Neuropsychologist,
11,
375–380.Google Scholar
Rentz, D.R.,
Huh, T.J.,
Faust, R.R.,
Budson, A.E.,
Scinto, L.F.M.,
Sperling, R.A., &
Daffner, K.R.
(2004).
Use of IQ-adjusted norms to predict progressive cognitive decline
in highly intelligent older individuals.
Neuropsychology,
18,
38–49.Google Scholar
Sawrie, S.M.,
Chelune, G.J.,
Naugle, R.I., &
Luders, H.O.
(1996).
Empirical methods for assessing meaningful neuropsychological
change following epilepsy surgery.
Journal of the International Neuropsychological Society,
2,
556–564.Google Scholar
Sawrie, S.M.,
Marson, D.C.,
Boothe, A.L., &
Harrell, L.E.
(1999).
A method for assessing clinically relevant individual cognitive
change in older adult populations.
Journals of Gerontology Series B–Psychological Sciences &
Social Sciences,
54,
P116–P124.Google Scholar
Tabachnick, B.G. &
Fidell, L.S.
(1996).
Using Multivariate Statistics
(3rd ed.).
New York:
Harper Collins.
Temkin, N.R.,
Heaton, R.K.,
Grant, I.,
Dikmen, S.A.
(1999).
Detecting significant change in neuropsychological test
performance: A comparison of four models.
Journal of the International Neuropsychological Society,
5,
357–369.Google Scholar
Wilk, C.M.,
Gold, J.M.,
Bartko, J.J.,
Dickerson, F.,
Fenton, W.S.,
Knable, M.,
Randolph, C., &
Buchanan, R.W.
(2002).
Test–retest stability of the Repeatable Battery for the
Assessment of Neuropsychological Status in schizophrenia.
American Journal of Psychiatry,
159,
838–844.Google Scholar
Zegers, F.E. &
Hafkenscheid, A.
(1994).
The ultimate reliable change index: An alternative to the Hageman
and Arrindell approach.
(Heymans Bulletins HB-94-1154-EX). Groningen, The Netherlands:
University of Groningen.
Demographic information on the samples
Regression equations for predicting Time 2 RBANS Indexes in the development sample
Comparison between observed and predicted RBANS Indexes for the validation sample
Predictive accuracy of change formulas based on validation sample
Case example
 You have
Access
- 44
- Cited by