With rising living standards and a growing global population, the demand for livestock products is projected to double by 2050 (McGuire, Reference McGuire2015). This surge in demand places significant pressure on the livestock sector to increase production. To meet this challenge, it is essential to adopt management practices that enhance production efficiency. One of the key factors influencing efficiency is the environment in which animals are raised (Koknaroglu et al., Reference Koknaroglu, Loy, Wilson, Hoffman and Lawrence2005, Reference Koknaroglu, Otles, Mader and Hoffman2008). Climate is a critical environmental factor, affecting animals through variables such as temperature, humidity, solar radiation, wind speed (WS), precipitation and air pressure. In intensive livestock systems, these climatic factors often act as limiting conditions. Although their impacts on animal health are difficult to measure, quantifying them is crucial for proactive or informed decisions about husbandry practices (Hahn, Reference Hahn1981).
Various environmental indices are utilized to quantify and interpret the influence of climatic factors on livestock, and one widely used index for this purpose is the comprehensive climatic index (CCI), developed by Mader et al. (Reference Mader, Johnson and Gaughan2010), which is a robust model designed to evaluate livestock performance across a wide temperature range (−30 to 45°C). This model integrates daily environmental variables, temperature, relative humidity (RH), WS and solar radiation to calculate a daily CCI value. By doing so, it provides a more precise assessment of environmental stress throughout the year. The CCI model is an important advancement in the quantification and understanding of environmental stress in livestock systems (Mader et al., Reference Mader, Johnson and Gaughan2010). According to Yousef and Johnson (Reference Yousef and Johnson1985), stress refers to external forces that disrupt an animal's physiological equilibrium. Within this context, heat stress is defined as thermal forces that raise the animal's core body temperature, leading to hyperthermia (Hahn and Nienaber, Reference Hahn and Nienaber1993; Young and Hall, Reference Young and Hall1993). It occurs when the animal's capacity to dissipate heat is insufficient to offset the external thermal load. Responses to heat stress vary across individuals depending on factors such as breed, genotype, body size, age, production stage and prior acclimatization. Environmental factors like stress duration and intensity also influence the severity of the response (Hahn et al., Reference Hahn, McQuigg and Decker1970; Buffington et al., Reference Buffington, Collazo-Arocho, Canton, Pitt, Thatcher and Collier1981; Hahn and Mader, Reference Hahn and Mader1997; Gaughan et al., Reference Gaughan, Mader, Holt, Josey and Rowan1999; Gaughan, Reference Gaughan2002). Conversely, cold stress (hypothermia) occurs under low-temperature conditions when animals increase metabolic activity to maintain core body temperature, thereby diverting energy away from growth and weight gain. This thermogenic response is a typical adaptation of cattle to cold environments (Beaver, Reference Beaver, Breed and Moore2010).
Both heat and cold stress negatively affect cattle productivity (Koknaroglu et al., Reference Koknaroglu, Otles, Mader and Hoffman2008), but the impact of heat stress is expected to intensify with climate change. Rising global and regional temperatures are likely to amplify the effects of heat stress more than cold stress in the future. Projections indicate that due to increased greenhouse gas emissions, global average temperatures could rise by 0.5–2.5°C by 2030 (Moss et al., Reference Moss, Jouany and Newbold2000). To evaluate the impact of heat or cold stress on milk production, it is crucial to establish an unperturbed lactation curve (ULC), also known as the expected lactation curve, which represents the theoretical milk yield trajectory in the absence of environmental or physiological disturbances. Several models have been developed to estimate the ULC, with the Wilmink, Wood, Ali and Schaeffer, and random regression models (RRMs) being the most commonly used. According to Adriaens et al. (Reference Adriaens, van den Brulle, D'Anvers, Statham, Geerinckx, De Vliegher, Piepers and Aernouts2021), deviations between the observed and expected daily milk yield (DMY) offer valuable insights into both the magnitude of milk losses and the temporal patterns of production under stress. These residuals, derived from the difference between actual and expected yields, can serve as indicators of an animal's resilience to environmental challenges (Kasna et al., Reference Kasna, Zavadilova and Vareka2025). When combined with thermal comfort indices such as the CCI, these deviations provide a powerful framework for quantifying the effects of heat and cold stress on milk yield and for assessing the adaptive capacity of individual dairy cows.
Recent studies (Poppe et al., Reference Poppe, Veerkamp, Van Pelt and Mulder2020; Adriaens et al., Reference Adriaens, van den Brulle, D'Anvers, Statham, Geerinckx, De Vliegher, Piepers and Aernouts2021; Ben Abdelkrim et al., Reference Ben Abdelkrim, Tribout, Martin, Boichard, Ducrocq and Friggens2021; Wang et al., Reference Wang, Brito, Zhang, Shi, Zhu, Liu, Guo and Wang2022) have explored the use of DMY fluctuations to develop novel climate resilience traits in dairy cattle, based on the idea that more resilient animals show fewer yield variations under stress conditions. For effective selection, these traits must be heritable and positively correlated with economically important traits. To date, there has been limited research focused on quantifying milk yield responses to heat and cold stress and on developing robust resilience indicators based on these responses in indigenous Indian cattle breeds. Further, the responses of animals at different stages of lactation to varying climatic conditions over the seasons may vary, which may affect the DMY. Thereby, this study was conducted to develop and evaluate the milk yield deviation-based resilience indicator traits to quantify thermal stress-related production losses, including heat and cold stress. The study further aims to estimate the genetic parameters for the indicator traits and to assess their association with the milk production traits in Sahiwal cattle.
Materials and methods
Data source
The study was conducted on 500 Sahiwal cows maintained in the Livestock Research Centre of the National Dairy Research Institute, Karnal. All the animals were of a similar age group and were maintained in almost similar management conditions. The first lactation DMY records of Sahiwal cows calved during the period from 1994 to 2025 were collected from the Animal Genetics and Breeding Division, NDRI, Karnal. DMY records of those animals with less than 100 days of lactation length and less than 500 kg of lactation yield were removed. The records with abnormal lactations and unknown pedigrees were removed, and finally, the dataset contained 132,548 DMY records of 500 females sired by 90 bulls.
The climatic variables necessary for the calculation of CCI, including solar radiation, WS (m/s), daily minimum, average and maximum air temperature (T min, TA, T max and °C), and RH (%) etc., were collected from the Langley Research Center Prediction of Worldwide Energy Resources (POWER) Project of the National Aeronautics and Space Administration (NASA) (https://power.larc.nasa.gov/data-access-viewer/) by selecting the required data by clicking the parameters option.
Comprehensive climate index
The CCI was proposed to evaluate both heat stress and cold stress and was computed as follows (Mader et al., Reference Mader, Johnson and Gaughan2010; Wang et al., Reference Wang, Bjerg, Choi, Zong and Zhang2018):
 \begin{equation*}CCI = {T{\text{a}}} + RH\,{{\text{adj}}} + V\,{{\text{adj}}} +RAD\,{{\text{adj}}}\end{equation*}
where T a is the average temperature, RH is the relative humidity, V is the air velocity and RAD is the solar radiation, while RHadj, V adj and RADadj are the correction factors of RH, air velocity and solar radiation, respectively.
 \begin{align*}{\text{RHadj}} &= {e^{\left( {0.00182{\text{* RH * }}1.8{\text{ * }}10 - 5{\text{ * Ta }} \times {\text{ RH}}} \right)}}\\
& \qquad*{\text{ }}\left( {0.000054*{\text{ }}T{a^2} + {\text{ }}0.00192*{\text{ }}Ta - 0.0246} \right)\\
& \qquad*{\text{ }}\left( {RH - 30} \right)\end{align*}
 \begin{align*}
V_{\text{adj}} &=
\left(\frac{-6.56}{\exp\left\{\!
\begin{array}{l}
\frac{1}{(2.26\,*\,WS\,+\,0.23)^{0.45}}\,*\ \left[2.9 + 1.14 \,*\, 10^{-6} \,\right. \\[4pt]
\quad\left. *\, WS^{2.5} - \log_{0.3}\!\left( 2.26\,*\,WS + 0.33\right)^{-2} \right]
\end{array}
\!\right\}}\right) \\
&\qquad - \left(0.00566\,WS^{2} + 3.33\right)
\end{align*}
 \begin{align*}RAD{\text{adj}} &= 0.0076*RAD - 0.00002*RAD*T{\text{a}} + 0.00005\\
& \quad*{\text{ T}}{a^2}{\text{ }}*\sqrt {RAD} + 0.1*T{\text{a}} - 2\end{align*}
where RAD is measured in W/m2 of global horizontal irradiance, WS is measured in m/s and T a is measured in °C. The adjustment parameters account for the influence of these meteorological variables on animal comfort.
Classification of data
The finalized dataset was categorized based on season of calving, period of calving and stage of lactation. The 31-year dataset was segmented into 6 periods, each spanning 5 years, except for the final period, which encompassed 6 years. Seasonal classification was carried out based on prevailing climatic conditions, resulting in four distinct seasons: winter (December–March), pre-monsoon (April–June), monsoon (July–September) and post-monsoon (October–November). Lactation stages were divided as follows: early lactation (1–100 days), mid-lactation (101–200 days) and late lactation (201–305 days).
Random regression model
The random regression analysis was performed using Wombat software (Meyer, Reference Meyer2007). The RRMs included the direct genetic and permanent environmental (PE) effects of animals as random effects and fixed effects of period of calving, season of calving and age of cow at calving as covariates, as shown below:
 \begin{align*}{Y_{ijkl}} &= PO{C_i} + SO{C_j} + b\left( {AFC} \right) + \mathop \sum \limits_{n = 1}^q {\alpha _n}{Z_{n{\text{ }}}}\left( s \right) + {\text{ }}\mathop \sum \limits_{n = 1}^q {\beta _{ln}}{Z_{n{\text{ }}}}\left( s \right) \\ &\quad+ {\mathop \sum \limits_{n = 1}^{q _{ln}}}{Z_{n{\text{ }}}}\left( s \right) + {\text{ }}{e_{ijkl}}\end{align*}
where Y ijkl denotes the lth DMY record of kth cow calved in ith period and jth season of calving, respectively. The term 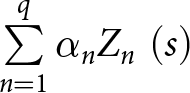 $\mathop \sum \limits_{n = 1}^q {\alpha _n}{Z_{n{\text{ }}}}\left( s \right)$ describes the overall fixed lactation curve across days in milk (DIM), with zn(s) being the nth Legendre polynomial evaluated at DIM and αn the corresponding fixed regression coefficient. Random regression coefficients βln and γln represent the additive genetic and PE effects, respectively, for each cow over DIM. The vector z(s) is of size q and describes the shape of the lactation curve of fixed and random regressions evaluated at s DIM. The term e denotes the random residual effect. This model structure allows for the estimation of milk yield trajectories over time (DIM), while adjusting for important fixed effects such as age at first calving, period and season.
The model in matrix notation can be written as
 \begin{equation*}Y\, = \,Xb\, + \,Za\, + Wp\, + \,e\end{equation*}
where b is the fixed regression coefficients, a is the random regression coefficients, p is the vector of effects of PE for cows with test day records, e is the vector of residual effects and X, Z and W are the incidence and covariate matrices.
Statistical analysis
The RRMs were developed with different Legendre polynomial orders for additive (second and third) and PE (second, third and fourth) effects. The efficiency of fitted RRMs was assessed on the basis of log likelihood estimates, Akaike information criterion (AIC) and Bayesian information criterion (BIC) values. The AIC and BIC values were calculated as follows.
The AIC was calculated as suggested by Akaike (Reference Akaike1974) and Burnham and Anderson (Reference Burnham and Anderson2004) with necessary changes recommended by Vieira et al. (Reference Vieira, Campos, da Silva, Tedeschi and Tamy2012), using the following formula:
 \begin{equation*}AIC = n\,{\log _e}MSE + 2P.\end{equation*}
The BIC was calculated as follows: the model with the lowest BIC value was considered the best (Schwarz, Reference Schwarz1978):
 \begin{equation*}BIC = n\,{{\log}_e}\left( {MSE} \right) + P{\text{ }}\log{\text{ }}\left( n \right)\end{equation*}
Resilience indicators
Following the acquisition of each cow's fitted lactation curve, daily yield deviations, or residuals, were computed as follows:
 \begin{equation*}{\text{Residual}} = {\text{ }}DM{Y_n} - \overline {DM{Y_n}} \end{equation*}
where 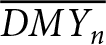 $\overline {DM{Y_n}} $is the daily milk yield anticipated on the nth day of milk (DIM). A consecutive four negative residuals are taken as a yield perturbation (Adriaens et al., Reference Adriaens, van den Brulle, D'Anvers, Statham, Geerinckx, De Vliegher, Piepers and Aernouts2021; Chen et al., Reference Chen, Boerman, Gloria, Pedrosa, Doucette and Brito2023). The CCI threshold level of 5–25 was considered as a comfort zone, as suggested by Aatralarasi et al. (Reference Aatralarasi, Dhaliwal, Kingra, Malhotra and Jain2024). An event of such yield perturbation, with the values of CCI ≥25 for the corresponding days, accounts for the milk loss due to heat stress. Whereas the occurrence of yield perturbation with CCI values <5 was considered due to cold stress. After examining the animal's health records, all other possible causes of the milk loss on that specific day were ruled out to ensure that the loss is attributed only to the heat and cold stresses. Based on this, three direct climate resilient indicator traits were developed for heat and cold stresses, namely number of days in heat or cold stress (NDHS/NDCS), total milk loss (TML) during heat or cold stress and average milk loss (AML) per animal per day due to heat or cold stress. Further, four variance indicators, namely natural log-transformed variance (LnVar), lag-1 autocorrelation (r auto) and skewness (Skew) from DMY deviations, and log-transformed variance (Var) from actual DMY, were also calculated as reported by Kasna et al. (Reference Kasna, Zavadilova and Vareka2025).
Estimation of genetic parameters
The Wombat software (Meyer, Reference Meyer2007) was used to estimate the variance and covariance components using multi-trait animal models. A total of nine traits were considered for the analysis, including two milk production traits, viz. first lactation 305-day milk yield (FL305DMY) and first lactation peak yield (FPY), and seven resilience indicator traits, including NDHS, TML, AML, Var, LnVar, r auto and skewness. The multivariate animal model used can be described as:
 \begin{equation*}{Y_i} = {X_i}{b_i} + {Z_i}{a_{i{\text{ }}}} + {e_i}\end{equation*}
where Yi = the vector of observations for the ith trait; bi, ai and ei are the vectors of fixed effects (period of calving and season of calving), random animal effects and random residual effects for the ith trait, respectively, and Xi and Zi are incidence matrices relating the observations of the ith trait to the fixed and random animal effects, respectively. It is assumed that a ∼ N (0, A  $\sigma _a^2$) and e ∼ N (0, I
 $\sigma _e^2$), where A is the matrix of additive genetic effects generated based on the pedigree information,
 $\sigma _a^2{\text{ }}$is the additive genetic variance, I is an identity matrix and
 $\sigma _e^2$is the residual variance. The variance and covariance estimates were used to calculate the heritability, genetic and phenotypic correlations of the traits considered.
Results
Best lactation curve model for the Sahiwal cow
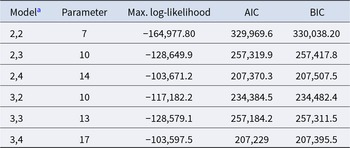
Six different RRMs were fitted, and the efficiency parameters are given in Table 1.
Statistical parameters for identifying the best lactation curve model for Sahiwal

Table 1 Long description
The table compares six lactation-curve models for Sahiwal using number of parameters, maximum log-likelihood, and the information criteria AIC and BIC (lower AIC/BIC indicate better fit with penalty for complexity). Model 3,4 has the best overall fit, with the lowest AIC (207,229) and BIC (207,395.5) and a max log-likelihood of −103,597.5, using 17 parameters. Model 2,4 is the next best by AIC/BIC (207,370.3 and 207,507.5) with 14 parameters and log-likelihood −103,671.2. Models 2,2 and 3,2 perform worst, with much higher AIC/BIC (329,969.6/330,038.20 and 234,384.5/234,482.4) and more negative log-likelihoods (−164,977.80 and −117,182.2). Models 2,3 and 3,3 are similar and intermediate, with AIC around 257,320 and 257,184 and BIC around 257,418 and 257,312. Because AIC and BIC penalize additional parameters differently, the preferred model should be based on the criterion chosen, though both agree here that 3,4 is best.
a The Legendre polynomial orders for animal additive and permanent environmental effects, respectively.
The evaluation of the best-fit model was done using AIC, BIC and maximum log-likelihood values, which indicated notable differences among the models assessed. The second-order polynomial for both additive and PE effect resulted in the highest AIC (329,969) and BIC (330,038) values, and the AIC and BIC values were found to be lowered as the model parameters of the models were increased. Given the comparable parameter estimates between the 2,4 and 3,4 models, the RRM with a second-order polynomial for additive genetic effect and a fourth-order polynomial for PE effect (RRM 2, 4) was selected as optimal for modelling DMY in Sahiwal cattle. This model offered the best balance between accuracy and simplicity, since more complex models showed improvements, as indicated in the findings of Van der Werf et al. (Reference Van der Werf, Goddard and Meyer1998), Pool et al. (Reference Pool, Janss and Meuwissen2000) and Kheirabadi et al. (Reference Kheirabadi, Rashidi, Alijani and Imumorin2014).
Descriptive analysis of resilience indicators to heat stress in Sahiwal cattle
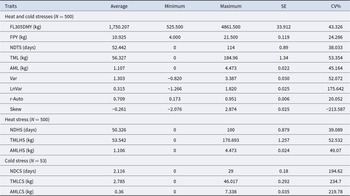
The details of descriptive statistics for various climate stress indicator traits for heat stress, cold stress and thermal stress (both heat and cold stress), along with two production traits, are presented in Table 2. The milk loss due to thermal stress for each animal was calculated as the sum of milk loss due to heat stress and milk loss due to cold stress. Overall average FL305DMY was estimated as 1750.21 kg, and the average FPY was 10.93 kg. On average, Sahiwal cows experienced climatic stress for 52 days (number of days under thermal stress [NDTS]), resulting in a mean TML of 56.33 kg per animal, with an AML of 1.10 kg, which included both heat and cold stress. Here, NDTS refers to the number of days in thermal stress, which includes both NDHS and NDCS. Specifically, cold stress affected 140 animals out of 500 animals under study, and the average number of cold stress days was observed as 2.12, while the AML per animal was 2.78 kg. The results showed that the incidence of heat stress was comparatively higher than the cold stress, as only 28% of the total cows under study showed the cold stress-related milk loss. The coefficient of variation (%) of most of the traits was almost similar, except the Skew (−213.59) and LnVar (175.64).
Descriptive statistics of the milk production heat and cold stress indicator traits

Table 2 Long description
Descriptive statistics summarize milk-yield traits and stress indicators, reporting mean, minimum, maximum, standard error, and coefficient of variation for combined thermal stress (N=500), heat stress (N=500), and cold stress (N=53). For all thermal stress days, cows average 1,750.2 kg first-lactation 305-day yield (range 525.5 to 4,861.5) and 10.93 kg peak yield (4.0 to 21.5). Thermal stress exposure averages 52.44 days (0 to 114) with total milk loss 56.33 kg (0 to 184.96) and average daily loss 1.107 kg (0 to 4.473). Heat stress closely mirrors the overall pattern: 50.33 days (0 to 100) with 53.54 kg total loss (0 to 170.69) and 1.106 kg average loss (0 to 4.473), indicating heat drives most of the combined losses. Cold stress is much less frequent and based on fewer animals: 2.12 days on average (0 to 29) with 2.79 kg total loss (0 to 46.02) and 0.36 kg average loss (0 to 7.34). Variability is high for loss and cold-stress measures (CV often >50% and >190% for cold-stress traits), so means may be influenced by a small number of high-loss cases, especially in the smaller cold-stress group. Additional thermal-stress metrics (Var, LnVar, r-Auto, Skew) show wide ranges, including negative skew values, suggesting distributions may be non-normal.
NDTS, number of days in thermal stress; TML, total milk loss; AML, average milk loss; FL305DMY, first lactation 305-day milk yield; FPY, first lactation peak yield; NDHS, number of days in heat stress; TMLHS, total milk loss due to heat stress; AMLHS, average milk loss due to heat stress; NDCS, number of days in cold stress; TMLCS, total milk loss due to cold stress; AMLCS, average milk loss due to cold stress.
Temporal milk yield response to thermal stress
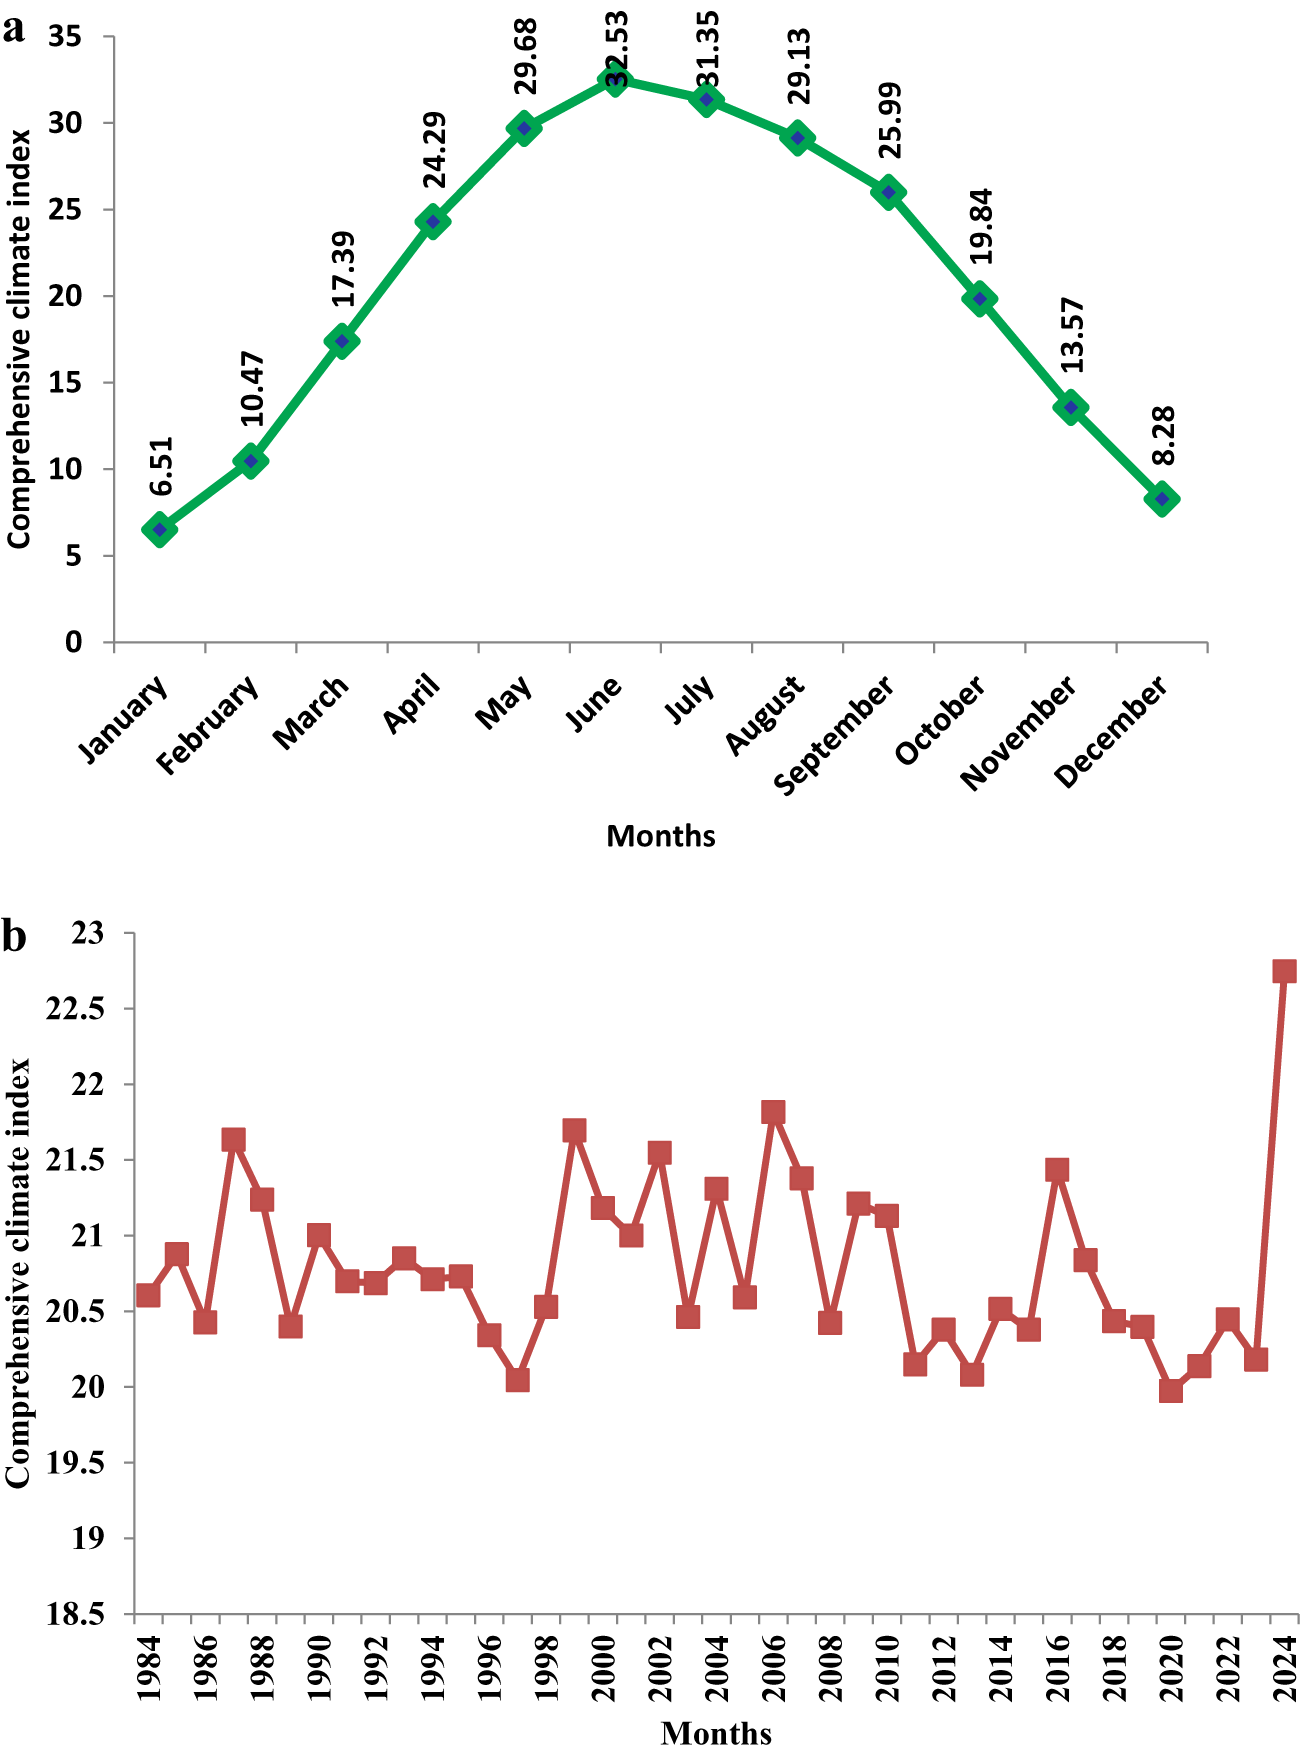
Figure 1 explains the monthly (1a) and annual (1b) trends in CCI, and Figure 2 illustrates the seasonal, lactation stage-wise and monthly variation in the NDTS and TML. The highest mean values for both NDTS (25.88 days) and TML (26.66 kg) were observed during the monsoon season, followed by the pre-monsoon season (NDTS: 24.23 days; TML: 26.64 kg). Across lactation stages, mid-lactation was most affected, with NDTS and TML reaching 25.32 days and 25.86 kg, respectively. A monthly analysis revealed that July was the peak month for thermal stress impact, with the highest values of NDTS (11.09 days) and TML (11.37 kg), which corresponded to the average CCI value of 33.76. Contrary to this, June had the TML of 9.86 kg and NDHS of 9.66 days in spite of having the maximum CCI value of 34.01.
(a) Monthly average CCI estimates. (b) Annual average CCI estimates.

Figure 1 Long description
The image A showing a line graph with the vertical axis label “Comprehensive climate index” and tick labels from 0 to 35. The horizontal axis label is “Months” with category labels: January, February, March, April, May, June, July, August, September, October, November, December. The plotted values labeled at each point are: January 6.51, February 10.47, March 17.39, April 24.29, May 29.68, June 32.53, July 31.35, August 29.13, September 25.99, October 19.84, November 13.57, December 8.28. The image B showing a line graph with the vertical axis label “Comprehensive climate index” and tick labels from 18.5 to 23. The horizontal axis label is “Months” with tick labels: 1984, 1986, 1988, 1990, 1992, 1994, 1996, 1998, 2000, 2002, 2004, 2006, 2008, 2010, 2012, 2014, 2016, 2018, 2020, 2022, 2024. The plotted series shows multiple square markers connected by line segments across the years, with values visually positioned between about 20 and 22.5 and the final point near 2024 positioned near 23.
Variation of NDTS and TML at different (a) seasons, (b) stages of lactation and (c) months due to thermal stress (heat and cold stress).

Figure 2 Long description
The image A showing a mixed bar and line graph labeled “(a)Seasons”. The horizontal axis lists Winter, Pre-monsoon, Monsoon, Post-monsoon. The left vertical axis label is “NDTS (Days)” with values 0 to 30. The right vertical axis label is “TML (kg)” with values 0 to 30. Bar values for NDTS are: Winter 2.3, Pre-monsoon 24.226, Monsoon 25.88, Post-monsoon 0.036. Line marker values for TML are: Winter 3.01, Pre-monsoon 26.64, Monsoon 26.66, Post-monsoon 0.02. The legend shows NDHS and TML. The image B showing a mixed bar and line graph labeled “(b)Stages of lactation”. The horizontal axis lists Early, Mid, Late. The left vertical axis label is “NDTS (Days)” with values 0.00 to 30.00. The right vertical axis label is “TML (kg)” with values 0.00 to 30.00. Bar values for NDTS are: Early 20.86, Mid 25.32, Late 6.26. Line marker values for TML are: Early 25.03, Mid 25.86, Late 5.44. The legend shows NDHS and TML. The image C showing a mixed bar and two line graph labeled “(c)Months”. The horizontal axis lists Jan, Feb, Mar, Apr, May, Jun, Jul, Aug, Sep, Oct, Nov, Dec. The left vertical axis label is “Comprehensive Climatic Index” with values 0 to 40. The right vertical axis label is “TML (kg) and NDTS (Days)” with values 0 to 12. Bar labels for CCI are: Jan 8.48, Feb 12.69, Mar 19.74, Apr 26.58, May 31.68, Jun 34.01, Jul 33.76, Aug 32.47, Sep 30.13, Oct 24.43, Nov 16.88, Dec 10.61. The legend shows CCI, NDHS and TML.
Figure 3a further confirms that heat stress effects peaked during the monsoon, while Figure 4a shows that the maximum impact of cold stress occurred during the winter season, with average values of NDCS (2.12 days) and TML (2.78 kg). Figures 3b and 4b show that mid-lactation cows were most vulnerable to heat stress (NDHS: 24.69 days; TML: 25.24 kg), whereas cold stress effects were most evident in the early (0.67 days and 1.17 kg) and late lactation stage (NDCS: 0.82 days; TML: 0.99 kg). Monthly trends (Figures 3c and 4c) indicate that the highest heat-induced milk loss occurred in July (11.37 kg), whereas January recorded the maximum cold-induced loss (1.89 kg).
Variation of NDHS and TML at different (a) seasons, (b) stages of lactation and (c) months due to heat stress.

Figure 3 Long description
The image A showing (a) Seasons. A mixed bar and line graph with legend entries NDHS and TML. The horizontal axis label is (a) Seasons with categories Winter, Pre-monsoon, Monsoon, Post-monsoon. The primary vertical axis label is NDHS (Days) with range 0.00 to 30.00. The secondary vertical axis label is TML (kg) with range 0.00 to 30.00. NDHS is shown as bars with values: Winter 0.18; Pre-monsoon 24.23; Monsoon 25.88; Post-monsoon 0.04. TML is shown as a line with point labels: Winter 0.23; Pre-monsoon 26.64; Monsoon 26.66; Post-monsoon 0.02. NDHS and TML increase from Winter to Pre-monsoon, remain high at Monsoon and decrease at Post-monsoon. The image B showing (b) Stages of lactation. A mixed bar and line graph with legend entries NDHS and TML. The horizontal axis label is (b) Stages of lactation with categories Early, Mid, Late. The primary vertical axis label is NDHS (Days) with range 0.00 to 30.00. The secondary vertical axis label is TML (kg) with range 0.00 to 30.00. NDHS is shown as bars with values: Early 20.19; Mid 24.69; Late 5.44. TML is shown as a line with point labels: Early 23.86; Mid 25.24; Late 4.45. NDHS and TML are highest at Mid and lowest at Late. The image C showing (c) Months. A mixed bar and two line graph with legend entries CCI, NDHS, TML. The horizontal axis label is (c) Months with categories Jan, Feb, Mar, Apr, May, Jun, Jul, Aug, Sep, Oct, Nov, Dec. The primary vertical axis label is Comprehensive climate index with range 0 to 40. The secondary vertical axis label is TML (Kg) and NDHS (Days) with range 0 to 12. CCI is shown as bars with values: Jan 8.48; Feb 12.69; Mar 19.74; Apr 26.58; May 31.68; Jun 34.01; Jul 33.76; Aug 32.47; Sep 30.13; Oct 24.43; Nov 16.88; Dec 10.61. NDHS and TML are shown as two separate lines with circular markers; monthly numeric labels for NDHS and TML are not shown next to the points. Both lines rise from Jan through Jul, then fall from Aug through Oct and remain near the baseline from Oct through Dec. The highest points for both lines occur around Jul and the lowest points occur around Jan and from Oct through Dec.
Variation of NDCS and TML at different (a) seasons, (b) stages of lactation and (c) months due to cold stress.

Figure 4 Long description
The image A showing (a) Seasons. The horizontal axis shows Winter, Pre-monsoon, Monsoon, Post-monsoon. The left vertical axis label is NDCS (Days), ranging from 0.00 to 2.50. The right vertical axis label is TML (Kg), ranging from 0.00 to 3.00. Legend: NDCS and TML. NDCS is shown as bars and TML is shown as a line with circular markers. NDCS bar values: Winter 2.12, Pre-monsoon 0, Monsoon 0, Post-monsoon 0. TML line values: Winter 2.78, Pre-monsoon 0, Monsoon 0, Post-monsoon 0. Pattern: NDCS and TML are nonzero at Winter and are 0 for Pre-monsoon, Monsoon and Post-monsoon. The image B showing (b) Stages of Lactation. The horizontal axis shows Early, Mid, Late. The left vertical axis label is NDCS (Days), ranging from 0 to 1. The right vertical axis label is TML (Kg), ranging from 0.00 to 1.40. Legend: NDCS and TML. NDCS is shown as bars and TML is shown as a line with circular markers. NDCS bar values: Early 0.67, Mid 0.63, Late 0.82. TML line values: Early 1.17, Mid 0.62, Late 0.99. Pattern: NDCS is highest at Late (0.82) and lowest at Mid (0.63). TML is highest at Early (1.17) and lowest at Mid (0.62). The image C showing (c) Months. The horizontal axis shows Jan, Feb, Mar, Apr, May, Jun, Jul, Aug, Sep, Oct, Nov, Dec. The left vertical axis label is Comprehensive climatic index, ranging from 0 to 40. The right vertical axis label is TML (Kg) and NDCS (Days), ranging from 0 to 2. Legend: CCI, NDCS, TML. CCI is shown as bars. NDCS and TML are shown as lines with circular markers. CCI bar values: Jan 8.48, Feb 12.69, Mar 19.74, Apr 26.58, May 31.68, Jun 34.01, Jul 33.76, Aug 32.47, Sep 30.13, Oct 24.43, Nov 16.88, Dec 10.61. Pattern: CCI increases from Jan (8.48) to a peak at Jun (34.01), then decreases through Dec (10.61).
Variance components and genetic parameters estimation for thermal and heat stress
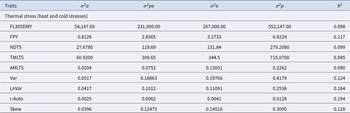
The variance components were estimated for both thermal stress and heat stress indicator traits, and the results are presented in Tables 3 and 4, respectively. The thermal stress was calculated as the sum of heat and cold stress effects, while for heat stress, the effect of cold stress was not considered. In this way, Table 3 presents the variance components for thermal stress indicator traits, while Table 4 depicts the variances for heat stress indicator traits. For the thermal stress, the per cent additive genetic variance was maximum for r-Auto, followed by LnVar and Skew. The Total milk loss due to thermal stress (TMLTS) had the lowest additive genetic variance for thermal stress indicators. Similar trends were observed for the heat stress indicator traits, as the additive genetic variance was highest for r-Auto, followed by LnVar and Skew, and the lowest estimate was observed for total milk loss due to heat stress (TMLHS). Further, the PE and residual variances were higher than the additive genetic variance for all the analysed traits.
Estimated variance components of thermal stress indicator traits in Sahiwal cattle

Table 3 Long description
The table reports variance components for multiple thermal-stress indicator traits in Sahiwal cattle: additive genetic variance (σ2a), permanent environmental variance (σ2pe), residual variance (σ2e), total phenotypic variance (σ2p), and heritability (h2). For production traits, FL305DMY has σ2p 552,147 with σ2a 54,147 and h2 0.098, while FPY has σ2p 6.9224 with h2 0.117. Heat-stress indicator traits show similarly low heritability: NDTS h2 0.099 (σ2p 279.2080), TMLTS h2 0.085 (σ2p 715.0700), and AMLTS h2 0.090 (σ2p 0.2262). Derived variability traits range from h2 0.124 for Var (σ2p 0.4179) to 0.164 for LnVar (σ2p 0.2538), and r-Auto has the highest heritability at 0.194 (σ2p 0.0128). In most traits, σ2pe and σ2e together account for more of σ2p than σ2a, indicating environmental and residual effects dominate. Values are on each trait’s own scale, so compare heritabilities across traits rather than raw variances.
NDHS, number of days in heat stress; TMLHS, total milk loss due to heat stress; AMLHS, average milk loss due to heat stress; FL305DMY, first lactation 305-day milk yield; FPY, first lactation peak yield.
Estimated variance components of heat stress indicator traits in Sahiwal cattle

Table 4 Long description
The table reports variance components for multiple heat-stress indicator traits, listing additive genetic variance (σ²a), permanent environmental variance (σ²pe), residual variance (σ²e), total phenotypic variance (σ²p), and heritability (h²). FL305DMY has the largest variances overall (σ²a 54,987; σ²pe 230,500; σ²e 267,170; σ²p 552,657) with h² 0.099. FPY shows σ²p 6.9229 and h² 0.115. Among heat-stress measures, NDHS has σ²p 258.333 and h² 0.107, while TMLHS has a higher σ²p 617.651 but the lowest h² at 0.061, indicating most variation is non-genetic. AMLHS has small absolute variances (σ²p 0.2647) but h² 0.117. Derived traits Var, LnVar, r-Auto, and Skew have σ²p values from 0.0125 to 0.4165, with the highest h² for r-Auto (0.175) and LnVar next (0.156). Comparisons should focus on relative patterns (e.g., h² differences) because traits are on different scales and units.
FL305DMY, first lactation 305-day milk yield; FPY, first lactation peak yield; NDCS, number of days in cold stress; TMLCS, total milk loss due to cold stress; AMLCS, average milk loss due to cold stress.
Estimation of genetic parameters
The heritability, genetic and phenotypic correlation estimates for thermal stress traits and heat stress traits are depicted in Figures 5 and 6, respectively. The heritability estimates for milk production traits were low in magnitude, with 0.098 for FL305MY and 0.117 for FPY. Among the thermal resilience indicator traits, r-Auto had the maximum heritability of 0.194, followed by 0.164 for LnVar and 0.128 for Skew. The Total milk loss due to thermal stress (TMLTS) had the lowest heritability estimate of 0.085, followed by Average milk loss due to thermal stress (0.090). Similar trends were observed for the heat stress indicator traits, as the r-Auto had the highest heritability estimate of 0.175, followed by LnVar (0.156) and Skew (0.127). The TMLHS had the lowest heritability estimate of 0.061.
Heatmap showing the estimates of heritability (diagonal), genetic (below diagonal) and phenotypic correlations (above diagonal) between thermal stress (heat and cold stresses) indicator traits in Sahiwal cattle.

Figure 5 Long description
The heatmap displays estimates of heritability (diagonal), genetic correlations (below diagonal) and phenotypic correlations (above diagonal) for thermal stress traits in Sahiwal cattle. Row labels include AutoCorrCT, r-Auto, Skew, ST-THI, ST-THIHS, LnVar, r-AutoHS, Var, TMLHS and AMLHS. Column labels are FL305MY, FPY, NDTS, TMLTS, AMLTS, Var, LnVar, r-Auto and Skew. Numerical values are present in each cell, representing correlation estimates. The legend indicates a gradient from negative to positive values, with endpoints showing low to high correlation. Notable patterns include higher heritability estimates along the diagonal and varying genetic and phenotypic correlations across traits. Key zones of elevated values are observed in the upper and lower sections of the matrix.
Heatmap showing the estimates of heritability (diagonal), genetic (below diagonal) and phenotypic correlations (above diagonal) between heat stress indicator traits in Sahiwal cattle.

Figure 6 Long description
The heatmap displays a correlation matrix for heat stress indicator traits in Sahiwal cattle. The diagonal cells contain heritability estimates, cells below the diagonal contain genetic correlation estimates and cells above the diagonal contain phenotypic correlation estimates. The gradient legend runs from a scale of negative 0.5 to positive 0.5, where lower negative values appear as deeper shades and higher positive values appear as deeper contrasting shades, with near-zero values appearing as neutral or pale tones. Row and column labels along both axes are identical and include the following traits in order: FL305MY, FPY, NDHHS, TMLHS, AMLHS, Var, LnVar, r-Auto and Skew. Numerical values are present in every cell. The diagonal heritability estimates read as follows: FL305MY is 0.100, FPY is 0.115, NDHHS is negative 0.523, TMLHS is 0.061, AMLHS is 0.846, Var is 0.862, LnVar is 0.213, r-Auto is 0.175 and Skew is 0.127. Selected phenotypic correlation values above the diagonal include FL305MY and FPY at 0.747, FL305MY and TMLHS at 0.410, FL305MY and AMLHS at 0.334, FL305MY and LnVar at 0.443 and FL305MY and r-Auto at 0.125. FL305MY and Skew reads negative 0.428. Selected genetic correlation values below the diagonal include FPY and FL305MY at 0.471, TMLHS and FL305MY at 0.816, AMLHS and FL305MY at 0.506, Var and FL305MY at 0.186, LnVar and FL305MY at 0.513, r-Auto and FL305MY at 0.396 and Skew and FL305MY at negative 0.537. The largest negative value visible in the matrix is approximately negative 0.804, located at the intersection of r-Auto and TMLHS. The largest positive values include approximately 0.862 at the LnVar diagonal cell and 0.846 at the AMLHS diagonal cell. The matrix is symmetric in structure, with each trait appearing once as a row label and once as a column label.
Perusal of the genetic and phenotypic correlation for thermal stress indicator traits revealed that the genetic correlations of FL305DMY with all the thermal stress indicator traits were positive, except for skewness. The genetic correlation between FL305DMY and TMLTS was very high and positive (+0.79), indicating that these two traits are genetically controlled by the same set of genes. The FPY had high positive genetic correlation with AMLTS (0.89), LnVar (0.88) and Var (0.83), indicating the genetic association between these traits. Similarly, LnVar had a high genetic correlation with FPY (0.88), AMLTS (0.82) and Var (0.69). The skewness had a negative genetic correlation with all the other traits. The r-Auto had a positive genetic correlation with the other traits, ranging from 0.19 to 0.60. The phenotypic correlations ranged from −0.427 (FL305DMY and Skew) to 0.745 (FL305DMY and FPY). In general, skewness had a negative phenotypic correlationwith all the traits studied except NDTS. The phenotypic correlations of LnVar with other traits, namely FPY, TMLTS, AMLTS and Var, were positive and high.
For the heat stress indicator traits, the FL305DMY had high and positive genetic correlation with the TML (0.82) and AML (0.51). The FPY had positive and high genetic correlation with LnVar (0.86), Var (0.85) and AMLHS (0.80). LnVar also had high genetic correlation with AMLHS (0.75) and Var (0.67). The skewness had a negative genetic correlation with all the other traits, while the r-Auto had a positive correlation with the other traits.
Discussion
Climate change is rapidly altering global weather patterns, leading to increased frequency and intensity of extreme climatic events such as heat and cold waves, and erratic rainfall. These environmental stressors significantly impact livestock systems, particularly dairy cattle, by reducing feed intake, impairing reproductive performance and decreasing milk yield and quality (Pragna et al., Reference Pragna, Archana, Aleena, Sejian, Krishnan, Bagath, Manimaran, Beena, Kurien, Varma and Bhatta2017; Gayari et al., Reference Gayari, Rahman, Lalhmingmawii and Mandal2024). Among these, thermal stress due to both heat and cold climates poses a major challenge to sustainable dairy production, especially in tropical and subtropical regions. As traditional breeding methods struggle to keep pace with changing environmental pressures, genomic selection for climate resilience emerges as a promising strategy. By identifying and selecting animals with superior genetic potential to maintain productivity under stress conditions, genomic tools offer a pathway towards developing cattle populations that are better adapted to future climate scenarios.
Over the past five decades, the Temperature-Humidity Index has been widely used as the standard metric for assessing heat stress risk in livestock across the globe (Herbut et al., Reference Herbut, Angrecka and Walczak2018; Sejian et al., Reference Sejian, Bhatta, Gaughan, Dunshea and Lacetera2018; Tao et al., Reference Tao, Rivas, Marins, Chen, Gao and Bernard2020). In recent years, additional indices have been developed to better represent the temperature as experienced by the animal, including the CCI, which is notably the only index applicable throughout all seasons of the year, including winter. The CCI is a multi-seasonal climatic index that integrates ambient temperature with RH, WS and solar radiation to more accurately reflect the thermal environment experienced by livestock. However, threshold values for these indices vary significantly across regions due to factors such as breed differences, milk production potential and local microclimatic conditions (Herbut et al., Reference Herbut, Angrecka and Walczak2018), and only a few studies have used CCI as a thermal index in dairy cows. According to Mader et al. (Reference Mader, Johnson and Gaughan2010), cattle begin to exhibit behavioural signs of heat stress when CCI values reach or exceed 25°C and cold stress when the value goes below 5. Supporting this, Jara et al. (Reference Jara, Keim and Arias2016) observed significant behavioural alterations in dairy cows at CCI ≥25°C, along with increased tympanic temperatures under elevated CCI conditions. In the study, the maximum CCI value was noticed in June (34.01), whereas the minimum CCI value was found during January (8.48).
When an animal is exposed to heat stress, it induces an increase in the dissipation of excess body heat to the environment through various physiological mechanisms (Collier et al., Reference Collier, Baumgard, Zimbelman and Xiao2019). Also, an animal tries to reduce its heat load through behavioural responses like shade-seeking behaviour, standing time, lying time, water intake, feeding, defecating and urinating frequency and drinking frequency (Ratnakaran et al., Reference Ratnakaran, Sejian, Jose, Vaswani, Bagath, Krishnan, Beena, Devi, Varma and Bhatta2017).
Numerous studies have shown that heat stress has a substantial negative impact on the production, health and reproductive performance of lactating dairy cows (Bohmanova et al., Reference Bohmanova, Misztal and Cole2007; Bernabucci et al., Reference Bernabucci, Biffani, Buggiotti, Vitali, Lacetera and Nardone2014; Collier et al., Reference Collier, Baumgard, Zimbelman and Xiao2019; Osei-Amponsah et al., Reference Osei-Amponsah, Dunshea, Leury, Cheng, Cullen, Joy, Abhijith, Zhang and Chauhan2020). Cook et al. (Reference Cook, Mentink, Bennett and Burgi2007) reported that cows tend to remain standing for extended periods during warmer conditions, a behaviour linked to reduced milk production and a higher incidence of foot-related disorders. Similarly, the negative impact of cold stress on the productivity of the animals has also been studied (Hoelscher, Reference Hoelscher2001; Mader, Reference Mader2003; Toghiani et al., Reference Toghiani, Hay, Fragomeni, Rekaya and Roberts2020). Angrecka and Herbut (Reference Angrecka and Herbut2015) reported that cows with an average milk yield of 21.6 kg experienced a reduction of nearly 2 kg in milk production during periods of moderate cold stress, highlighting a strong association between milk yield and the Wind Chill Temperature Index. Similarly, Brouček et al. (Reference Brouček, Letkovičová and Kovalčuj1991) observed a 2 kg decline in milk yield in cows averaging 15 kg of daily production when ambient temperatures dropped below −10°C. Despite this, thermal stress, especially cold stress, remains a neglected issue in herd management practices worldwide (Tao and Dahl, Reference Tao and Dahl2013). Growing concern over this problem has emerged in response to the increasing frequency and intensity of heat waves globally. These climate shifts, when combined with the use of high-yielding dairy breeds, have amplified the visibility and urgency of addressing heat stress in dairy production systems.
In this study, climatic stress condition was characterized by a daily CCI value with a threshold of greater than 25 indicating heat stress and less than 5 indicating cold stress, as suggested by Mader et al. (Reference Mader, Johnson and Gaughan2010). A heat stress-induced perturbation in milk yield was defined as a period of at least 4 consecutive days with negative residuals, occurring when the CCI exceeds 25, whereas for cold stress, CCI values below 5 are taken. This method, as described by Adriaens et al. (Reference Adriaens, Friggens, Ouweltjes, Scott, Aernouts and Statham2020), offers a straightforward and practical approach while effectively excluding short-term fluctuations caused by unrelated factors (Bach and Busto, Reference Bach and Busto2005; Gaillard et al., Reference Gaillard, Friggens, Taghipoor, Weisbjerg, Lehmann and Sehested2016). The residuals were calculated from the RRM (order 2 for the animal effect and order 4 for the PE effect), after the model had been identified to be the best fit model for DMY in Sahiwal cattle with lower AIC (207,370.3) and BIC (207,507.5) values and a higher maximum log likelihood value (−103,671.2). Findings from this and previous studies (Van der Werf et al., Reference Van der Werf, Goddard and Meyer1998; Pool et al., Reference Pool, Janss and Meuwissen2000; Kheirabadi et al., Reference Kheirabadi, Rashidi, Alijani and Imumorin2014) clearly indicate that increasing the order of fit for the PE effect in the series of RR models leads to a significant improvement (P < 0.05) in model performance. However, the magnitude of improvement becomes smaller with each successive increase in the order of fit. From these yield perturbations, seven resilience indicators were developed to assess the individual's response to heat and cold stress. Assessment of animal performance was done over different temporal scales, including monthly variation, seasonal changes and lactation stage variation. This approach enables the identification of individual differences in the onset and duration of heat stress, facilitating the selection of animals that exhibit greater tolerance to thermal stress.
The average TML due to thermal stress during the first lactation in Sahiwal cattle was estimated at 56.33 kg per animal, occurring over an average of 52.4 days under stress. A closer breakdown reveals that heat stress was the predominant contributor, accounting for 53.54 kg of milk loss over 50.33 days, whereas cold stress had a negligible impact, contributing to only 2.78 kg of milk loss across 2.12 days. These findings reflect the greater sensitivity of Sahiwal cattle to heat stress in tropical climates. Further, out of 500 animals studied, only 140 animals showed the cold perturbation, while the remaining animals showed resilience to cold stress, as no loss in milk production was observed.
When compared to findings in temperate regions, the TMLHS in this study was higher than the 31.4 ± 12.2 kg/year reported for Holstein cows in the Netherlands by André et al. (Reference André, Engel, Berentsen, Vellinga and Oude Lansink2011), yet lower than estimates from broader multi-regional assessments such as those by St-Pierre et al. (Reference St-Pierre, Cobanov and Schnitkey2003) and Wang et al. (Reference Wang, Brito, Zhang, Shi, Zhu, Liu, Guo and Wang2022), which reported considerably higher annual productivity losses due to heat stress. On the contrary, the cold stress-related losses were similar to those observed in studies from temperate climates, such as Angrecka and Herbut (Reference Angrecka and Herbut2015), who reported a 2 kg loss, and Brouček et al. (Reference Brouček, Letkovičová and Kovalčuj1991), indicating greater resilience of tropical breeds like Sahiwal to cold extremes.
The month-wise distribution of heat stress showed the greatest impact in July (11.37 kg TML; 11 days under heat stress), followed closely by August (10.94 kg TML; 10.4 days). In contrast, cold stress was observed predominantly in January (1.89 kg TML; 1.39 days) and December (0.82 kg TML; 0.65 days). This pattern corresponds to climatic variations in northern India, where extreme heat and humidity prevail during the monsoon months and mild cold occurs in winter. The cumulative effect was highest during the monsoon season, with 26.65 kg of milk lost over 25 days of heat stress, while cold stress was restricted to the winter season, contributing to a mere 2.78 kg loss over 2.12 days.
These observations are consistent with reports by Park et al. (Reference Park, Ataallahi, Ham, Oh, Kim and Park2022), who noted significant heat-related declines in milk production from June to August, and by Brouček et al. (Reference Brouček, Letkovičová and Kovalčuj1991) and Aarif et al. (Reference Aarif, Pampori, Hasin, Sheikh, Bhat and Parra2020), who documented cold-related reductions in production during winter months.
The study further analysed the impact of stress across lactation stages. Interestingly, the maximum milk loss due to cold stress occurred during the early stage of lactation (1.17 kg TML; 0.67 days), followed by the late stage of lactation (0.99 kg TML; 0.81 days), which corroborates the findings of Young (Reference Young1981), who reported higher sensitivity during early lactation.
On the other hand, heat stress-related milk losses peaked during mid-lactation, aligning with the observations of Perera et al. (Reference Perera, Gwazdauskas, Pearson and Brumback1986), Basiricò et al. (Reference Basiricò, Bernabucci, Morera, Lacetera and Nardone2009), Bernabucci et al. (Reference Bernabucci, Lacetera, Baumgard, Rhoads, Ronchi and Nardone2010) and Das et al. (Reference Das, Sailo, Verma, Bharti, Saikia and Kumar2016). These studies consistently highlighted the mid-lactation period as a phase of high metabolic activity and energy demand, making cows particularly susceptible to heat-induced production drops. This aligns with the physiological understanding that milk yield peaks during mid-lactation, and any thermal discomfort during this phase disproportionately impacts productivity.
In general, all the traits showed a lower percentage of additive genetic variance as compared to the PE and residual variances, and the heritability estimates were also low. The majority of the previous studies also suggested low heritability estimates for these traits. Kasna et al. (Reference Kasna, Zavadilova and Vareka2025) also reported lower heritability estimates of 0.12, 0.13, 0.07 and 0.02 for Var, LnVar, a-Auto and Skew in Holstein cows. Wang et al. (Reference Wang, Brito, Zhang, Shi, Zhu, Liu, Guo and Wang2022) also obtained lower heritability estimates of 0.061 for TML in lactation and 0.014 for the total number of DIM loss. The low heritability estimates obtained in the present study suggest the limited genetic control over the climate resilience indicator traits, and the genetic improvement for these traits may require a long-term selection approach, as the rate of genetic gain is very low.
Cattle have developed a suite of genetic mechanisms to cope with thermal stress, several of which have become focal points in breeding programmes for heat-tolerant livestock. The slick mutation – a loss-of-function variant in the prolactin receptor (PRLR) gene – is well-characterized, producing a short, sleek coat that improves heat dissipation and is associated with lower rectal temperatures and better milk production under heat load. Heat shock proteins (HSPs), encoded by gene families such as HSPA (HSP70), HSPB (small HSPs) and HSPC (HSP90), act as molecular chaperones that are rapidly upregulated in response to elevated body temperature, preventing protein misfolding and maintaining cellular homeostasis under stress. Sweating capacity is largely governed by the density and activity of sweat glands, which are influenced by genes like EDARADD, EDA and EDNRB, and Bos indicus cattle generally possess higher sweat gland density than Bos taurus breeds, contributing to their superior heat tolerance. Collectively, variation across these loci underlies the substantial genetic differences in heat adaptation observed between breeds and individuals, and they represent key targets for genomic selection in the context of climate change and tropical livestock production.
The high and positive genetic correlation between FL305DMY and TMLTS suggests that the genetic improvement for first-lactation milk yield may increase the TML due to thermal stress. The above result also suggests that the high yielders are more susceptible to thermal stress than the low yielders, as the TML is genetically positively correlated with the 305-day milk yield. Similarly, the FPY had high and positive genetic correlations with AMLTS, LnVar and Var, indicating that the genetic improvement for peak yield would also genetically improve these traits.
Conclusion
This study revealed that thermal stress caused a 3.12% ((56.33 × 100)/(1750.21 + 56.33)) reduction in first lactation milk yield of Sahiwal cows, with heat stress (2.97%) contributing more to milk loss than cold stress (0.16%). The monsoon season was found to be the most stressful period due to high humidity and solar radiation. Low heritability estimates and high genetic correlations between milk production and thermal resilience traits suggest that climate resilience indicators should be integrated into breeding programmes along with the milk production traits. The negative skewness and high autocorrelation of milk loss indicate sustained thermal stress impacts with slow recovery. Therefore, comprehensive strategies combining genetic selection for climate resilience and improved heat/cold stress management are recommended for enhancing Sahiwal cattle productivity in tropical dairy systems.
Supplementary material
The supplementary material for this article can be found at https://doi.org/10.1017/S0022029926102404.
Funding statement
No external funding was granted for this work. This work was supported by the ICAR-National Dairy Research Institute, Karnal, under the Institutional Research Project.
Competing interests
The authors declare no conflicts of interest.
Ethics approval/declarations (include appropriate approvals or waivers)
The data used in this study were obtained from available records and public repositories and required no ethical approval.
Author contributions
P.P.: investigation, generation of data, analysis, writing original draft; R.A.: analysis of climate data, editing of draft; G.G.: conceptualization of methodology, review of manuscript; S.M.: editing of manuscript; P.C.L.: review of reference, writing of draft; V.V.: climate data generation and editing of original manuscript; T.V.R.: conceptualization, data curation, review and editing of manuscript. All authors read and approved the final manuscript.