


INTRODUCTION
Coastal zones are widely diverse in aspects such as vegetation, climate and geology, to cite a few. In extensive areas, such as the Brazilian coast, the contrasts are evident and call our attention to the necessity of considering specific environmental conditions when performing studies on these areas.
The Brazilian coastal zone presents a huge linear extension of over 8000 km (from 4.87°N to 33.75°S). This latitudinal coverage, allied with great geomorphological and climatic variety, explains the diversity of species and ecosystems present in the littoral. The Brazilian waters cover an area of approximately 3.6 million km2 (Marinha do Brasil, accessed in October 2017), with quite distinctive oceanographic conditions along the coast. Together with the terrestrial tropical and subtropical features, this allows very specific biodiversity to develop as warm waters on the north and northeast coasts and colder waters on the south and southeastern coasts create ecosystems that include estuaries, mangroves, lagoons, sandy plains, rocky reefs, and islands.
Archaeological sites characterized by the anthropogenic accumulation of mollusk shells, comprising a large variety of ecofacts and artifactual remains, have been identified along the Atlantic coast of South America. They are located in areas with high availability of resources for the past populations, especially on ecotones comprising estuarine or lagoon environments along with restingas, coastal forests, and on rocky islands. The Quaternary records recovered in these archaeological sites, such as shells, teeth, bones, carapaces, spines, spicules, phytoliths, charcoal, and others, are tools used not only for archaeological interpretations (Scheel-Ybert Reference Scheel-Ybert2014), but also for studies on biodiversity, palaeoenvironments, marine paleontology, and radiocarbon (14C) dating for example (Golfieri et al. Reference Golfieri, Ferrero and Zarta1998; Scheel-Ybert Reference Scheel-Ybert2000; Martinez et al. Reference Martínez, Rojas, Ubilla, Verde, Perea and Piñeiro2006; Gordillo et al. Reference Gordillo, Rabassa and Coronato2008; Suguio Reference Suguio2010; Aguirre et al. Reference Aguirre, Donato, Richiano and Farinati2011; Charó et al. Reference Charó, Gordillo, Fucks and Giaconi2014; Souza Faria Reference Souza Faria, de Souza and Cristina2014; Alves et al. Reference Alves, Macario, Souza, Aguilera, Goulart, Rita Scheel-Ybert, Bachelet, Carvalho, Oliveira and Douka2015a; Reference Suguio2015b; Carvalho et al. Reference Carvalho, Macario, Oliveira, Oliveira, Chanca, Eduardo Alves, Souza, Aguilera and Douka2015; Macario et al. Reference Macario, Souza, Aguilera, Carvalho, Oliveira, Alves, Chanca, Silva, Douka, Decco, Trindade, Marques, Anjos and Pamplona2015a; Souza et al. Reference Souza, Lima, Duarte and Silva2016; Lopes et al. Reference Lopes, Bertucci, Rapagnã, de Almeida Tubino, Monteiro-Neto, Tomas, Tenório, Lima, Souza, Carrillo-Briceño and Haimovici2016; Cancelli et al. Reference Cancelli, Testa, Hadler, Saafeld, Barboza and Dillenburg2017; Coe et al. Reference Coe, Souza, Duarte, Ricardo, Machado, Macario and Silva2017; Silva et al. Reference Silva, Pádua, Souza and Duarte2017).
Remains recovered from shellmounds should be studied in an integrated way, considering functional approaches in a palaeoecological perspective (Fürsich Reference Fürsich1995; Froyd and Willis Reference Froyd and Willis2008). The chronology of such sites is an essential component of the palaeoenvironment reconstruction, allowing the establishment of a temporal framework for variations in environmental conditions. However, the use of 14C dating for that purpose should be performed with care due to the influence of the MRE on marine samples and, therefore, an evaluation of regional environmental features which may affect the local offset is needed.
Regional Aspects of the MRE
The incorporation and distribution of 14C in the oceans are reflected in the global reservoir age included in the marine calibration curves (e.g., Reimer et al. Reference Reimer, Bard, Bayliss, Beck, Blackwell, Bronk Ramsey, Grootes, Guilderson, Haflidason, Hajdas, Hatté, Heaton, Hoffmann, Hogg, Hughen, Kaiser, Kromer, Manning, Niu, Reimer, Richards, Scott, Southon, Staff, Turney and van der Plicht2013). However, deviations from the global marine reservoir age, caused by local environmental aspects, present large variability (Ascough et al. Reference Ascough, Cook, Church, Dugmore, Arge and McGovern2006). This offset is known as ∆R (Stuiver et al. Reference Stuiver, Pearson and Braziunas1986) and is affected by ocean dynamics, climate variability and freshwater drainage (see Alves et al. Reference Alves, Macario, Ascough and Bronk Ramsey2018 for a recent review). Negative ∆R values are usually the result of terrestrial catchment, where the influence of rivers and lagoons can approximate the reservoir ages to the atmospheric signal. Freshwater input can also result in positive ∆R values when old carbon sequestered in soil/peat stocks (Trumbore Reference Trumbore2000; Douglas et al. Reference Douglas, Pagani, Eglinton, Brenner, Hodell, Curtis, Ma and Breckenridge2014; Keaveney et al. Reference Keaveney, Reimer and Foy2015a, Reference Keaveney, Reimer and Foy2015b) or dead carbon from limestone (Broecker and Walton Reference Broecker and Walton1959) is present. The 14C reservoir age of estuaries, representing neither fully freshwater nor fully marine environments, can also be expressed in terms of the R(t) offset (Milheira et al. Reference Milheira, Macario, Chanca and Alves2017; Olsen et al. Reference Olsen, Ascough, Lougheed and Rasmussen2017) from an atmospheric calibration curve such as IntCal13 (Reimer et al. Reference Reimer, Bard, Bayliss, Beck, Blackwell, Bronk Ramsey, Grootes, Guilderson, Haflidason, Hajdas, Hatté, Heaton, Hoffmann, Hogg, Hughen, Kaiser, Kromer, Manning, Niu, Reimer, Richards, Scott, Southon, Staff, Turney and van der Plicht2013) or SHCal13 (Hogg et al. Reference Hogg, Hua, Blackwell, Niu, Buck, Guilderson, Heaton, Palmer, Reimer, Reimer, Turney and Zimmerman2013).
The depletion of the oceans in 14C concentration is enhanced in deep waters due to the low exchange rate of carbon in this environment (Alves et al. Reference Alves, Macario, Ascough and Bronk Ramsey2018 and references therein). However, patterns of ocean circulation displace water masses from different locations and depths, promoting the mixing of water carrying specific 14C signals (Alves et al. Reference Alves, Macario, Ascough and Bronk Ramsey2018). In coastal upwelling regions, where wind patterns favor the rising of deep waters, ∆R values can be greatly increased (see e.g., Owen Reference Owen2002; Taylor et al. Reference Taylor, Southon and Des Lauriers2007; Holmquist et al. Reference Holmquist, Reynolds, Brown, Southon, Simms and MacDonald2015; Santana-Sagredo et al. Reference Santana-Sagredo, Schulting, Lee-Thorp, Agüero, Uribe and Lemp2017). Even where upwelling is a seasonal phenomenon, its influence can be observed in the surrounding regions. Marine organisms such as mollusks, fish, and corals grow by exchanging carbon with their environment, therefore recording the regional trends of the MRE. Oxygen stable isotopes measured in the carbonaceous remains of marine organisms provide an additional tool for resolving different water masses based on temperature. In complex coastal environments, such as estuarine systems, where there may be a competition between the upwelling and the freshwater influences, the combination of the δ13C and δ18O proxies can help to unravel the effect of such factors to the incorporation of 14C (Olsen et al. Reference Olsen, Rasmussen and Heinemeier2009).
The Study Region
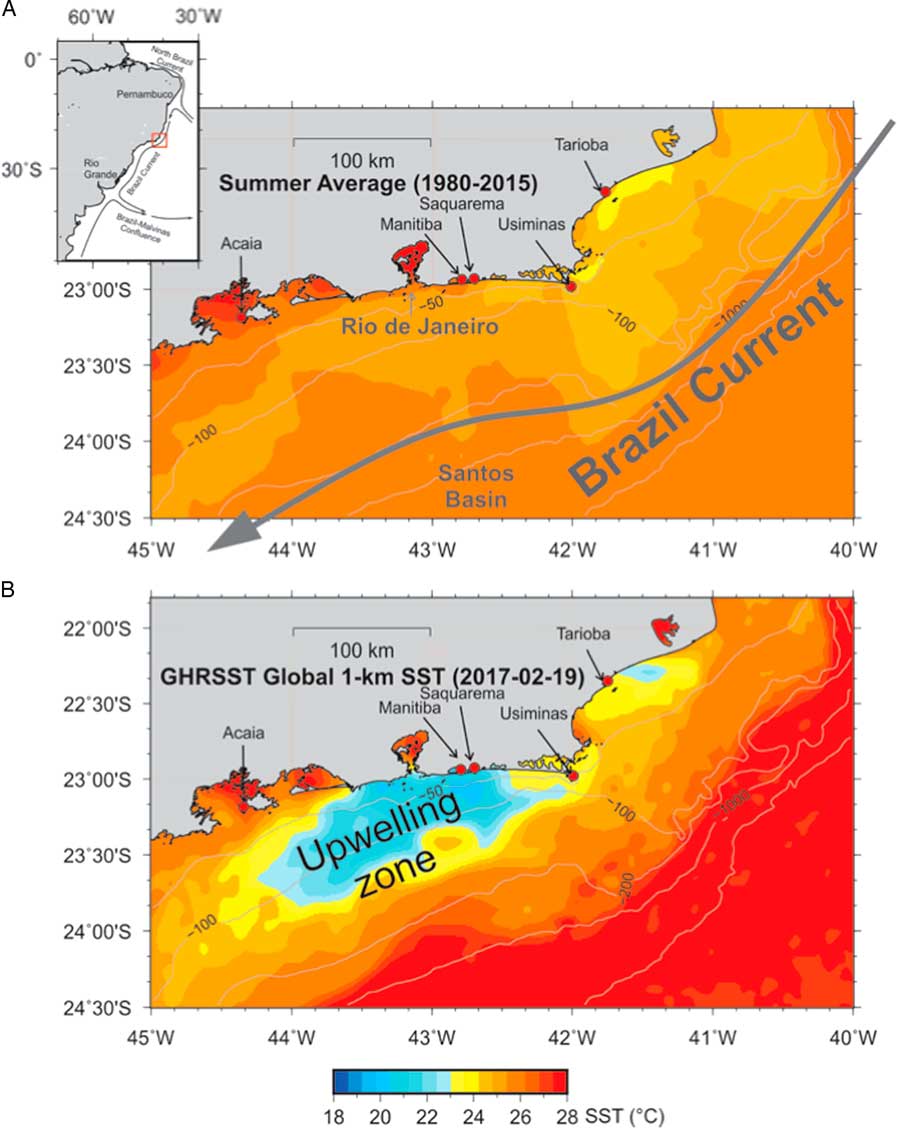
This study is focused on the coast of Rio de Janeiro State, located in the southeastern continental margin of Brazil to the Atlantic Ocean, with a latitude range from 23.3°S to 21.3°S over a distance of ca. 500 km (Figure 1). The very distinct physiographic features of the northern and southern portions of the state of Rio de Janeiro impact the environmental conditions along the coast (Ikeda et al. Reference Ikeda, Miranda and Rock1974; Franchito et al. Reference Franchito, Rao, Stech and Lorenzzetti1998; Rodrigues and Lorenzzetti Reference Rodrigues and Lorenzzetti2001; Castelao and Barth Reference Castelao and Barth2006; Castelao Reference Castelao2012; Belem et al. Reference Belem, Castelao and Albuquerque2013; Albuquerque et al. Reference Albuquerque, Belém, Zuluaga, Cordeiro, Mendoza, Knoppers, Gurgel, Meyers and Capilla2014; Venancio et al. Reference Venancio, Belem, dos Santos, Zucchi, Azevedo, Capilla and Albuquerque2014, Reference Venancio, Franco, Belem, Mulitza, Siccha, Albuquerque, Schulz and Kucera2016a). Most of the coast faces SSE, which is more susceptible to the action of the sea during the practically constant passage of cold fronts throughout the year. The northeastern portion of the coast has an NE-SW alignment (40° azimuth), more susceptible to the northeasterly winds, relatively intense during the summer, with its focal point on the Cabo Frio Island. Characterized by sandy bars and numerous coastal lagoons, the typical vegetation cover comprises restinga formations as well as other plant communities, such as humid coastal forests and sometimes mangroves (Scheel-Ybert Reference Scheel-Ybert2000, Reference Scheel-Ybert2014). Restinga, a typical Brazilian coastal vegetation, is a mosaic of plant associations with diverse physiognomies that occupies the sandy beach ridges. It varies from sparse, open plant communities, such as herbaceous and shrub formations (“open restinga”) to dense, evergreen forest (“restinga forest”).
(A) Summer average temperature of superficial waters from 1980 to 2015 and (B) values for February 19, 2017, on the coast of Rio de Janeiro, southeast of Brazil, showing the location of the shellmounds studied. The sea surface temperature data (SST) was obtained from yearly averaged monthly Pathfinder Version 5.2 dataset (obtained from NOAA ERDDAP portal).
Most of the Rio de Janeiro coast, contrary to the general trend of the Brazilian coast, extends itself in the east–west direction (Turcq et al. Reference Turcq, Martin, Flexor, Suguio, Pierre and Tasayaco-Ortega1999). Precambrian crystalline rocks are divided in blocks by the action of tectonic activity along the Cenozoic and surrounded by Quaternary deposits (Turcq et al. Reference Turcq, Martin, Flexor, Suguio, Pierre and Tasayaco-Ortega1999). Variability of relative mean sea level has dictated the resulting coastal forms along the sedimentary coast (Dias and Kjerfve Reference Dias and Kjerfve2009). While coastal barriers are related to transgressive sea levels, beach ridges, on the other hand, form during coastal progradation, related to fluvial sediment supply, or relative sea level fall. Rising of relative sea level during the Holocene, along the coast of Rio de Janeiro, reached the present mean sea level stand at 7.55 kBP based on dating of wood debris and shell samples, or at 6.50 kBP based on dating of fossil vermetid Petaloconchus varians (d’Orbigny 1839; Dias and Kjerfve Reference Dias and Kjerfve2009). Relative sea level then continued to increase 3–4 m to a Holocene sea level high stand between 5.8 and 5.0 kBP, then falling with a gently oscillating decline to the present-day mean sea level (Angulo et al. Reference Angulo, Lessa and de Souza2006; Dias and Kjerfve Reference Dias and Kjerfve2009; Jesus et al. Reference Jesus2017).
The region has a semi-humid tropical marine climate with an annual mean temperature of 24°C and austral summers reaching 40°C (Barbieri 1975; Dias and Kjerfve Reference Dias and Kjerfve2009). Most of the rain falls in the austral summer and typical rates vary from 1200 to 1400 mm per year. The exception is the arid region in the vicinity of Cabo Frio, where rainfall averages only 800 mm per year as a result of an intense oceanic upwelling regime, which interacts to generate the arid local microclimate, cooling the atmosphere a few degrees when compared with other parts of the coast (Dias and Kjerfve Reference Dias and Kjerfve2009).
The Brazil Current (BC) flows southward parallel to the Brazilian coast from Pernambuco (latitude 8°S) to Rio Grande do Sul (latitude 35°S). The Brazilian coast is connected with a narrow shelf, except in the Abrolhos bank region (18°S), and shows a higher influence of the Tropical Water very close to the coast. In the Rio de Janeiro region, as shown in Figure 1, the BC flows in the southwestern direction up to the border of the continental shelf at Cabo Frio Island (ca. 80 km wide) and diverges to the Santos Basin with the abrupt change of coastal direction in that point, keeping an average distance of 100–150 km from the coast (Franchito et al. Reference Franchito, Rao, Stech and Lorenzzetti1998). This creates favorable conditions for an upwelling area along the coast at Cabo Frio (Belem et al. Reference Belem, Castelao and Albuquerque2013). The South Atlantic Central Water (SACW) occurs in the photic zone from the coast to the uppermost continental slope and both wind-driven and current-driven upwelling are present (Belem et al. Reference Belem, Castelao and Albuquerque2013; Albuquerque et al. Reference Albuquerque, Meyers, Belem, Turcq, Siffedine, Mendoza and Capilla2016; Lessa et al. 2016). The upwelling region frequently extends as far west as the city of Rio de Janeiro, with surface ocean temperatures reaching 12–16°C in regions where the ambient surface temperature is 24–30°C. Winds along the coast of Rio de Janeiro blow mostly from the northeast, as a result of persistent high pressure systems in the South Atlantic, especially during the austral summer. These winds blow mostly at 3–6 m.s–1 but frequently exceed 10 m.s–1 (Bastos and Silva Reference Bastos and Silva2000). Strong winds from the northeast intensify the coastal and oceanic upwelling at Cabo Frio.
Despite the large area presently influenced by the cold waters, previous studies have shown a trend for negative ∆R values, in most of the northeastern part of Rio de Janeiro, possibly related to the freshwater input in the lagoons area (Alves et al. Reference Alves, Macario, Souza, Aguilera, Goulart, Rita Scheel-Ybert, Bachelet, Carvalho, Oliveira and Douka2015a; Carvalho et al. Reference Carvalho, Macario, Oliveira, Oliveira, Chanca, Eduardo Alves, Souza, Aguilera and Douka2015; Macario et al. Reference Macario, Souza, Aguilera, Carvalho, Oliveira, Alves, Chanca, Silva, Douka, Decco, Trindade, Marques, Anjos and Pamplona2015a). Such values deviate from the range of those available for the coast of Brazil obtained from pre-bomb marine shells (Angulo et al. Reference Angulo, Souza, Reimer and Sasaoka2005; Alves et al. Reference Alves, Macario, Souza, Pimenta, Douka, Oliveira, Chanca and Angulo2015b). In this paper, we discuss the results for the marine reservoir effect in Ilha Grande, in the southern part of Rio de Janeiro, based on paired otolith, mollusk shells and charcoal samples from the Acaiá shellmound and compare them with previous data from literature.
MATERIALS AND METHODS
We have included previous data values derived from marine and terrestrial mollusk shells, charcoal and otoliths from the Brazilian National Museum collection, prepared and analyzed at the Radiocarbon Laboratory of the Fluminense Federal University (LAC-UFF) (Macario et al. Reference Macario, Gomes, Anjos, Carvalho, Linares, Alves, Oliveira, Castro, Chanca, Silveira, Pessenda, Moraes, Campos and Cherkinsky2013). These include Usiminas, Saquarema, Manitiba and Tarioba shellmounds, all of them on the northeastern coast of Rio de Janeiro (Figure 1). In the present work, we have studied the Acaiá shellmound, at Ilha Grande, an island on the southwestern coast of Rio de Janeiro facing the city of Angra dos Reis on the continent.
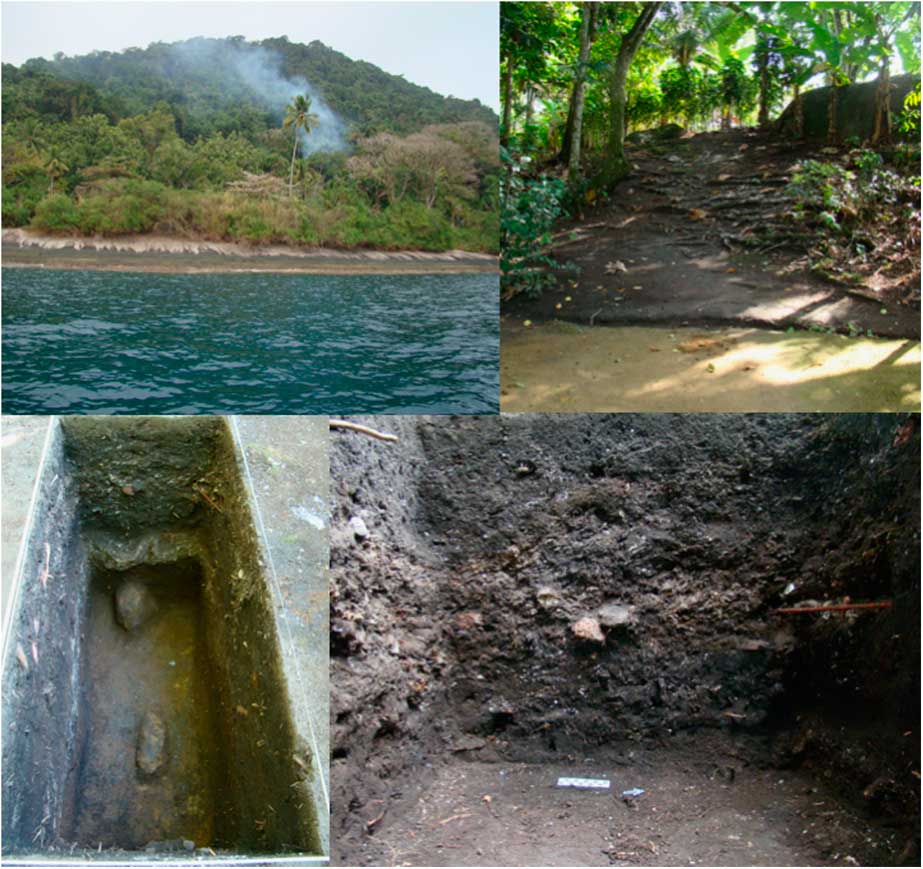
The excavation of the Acaiá shellmound was coordinated by the archaeologist Maria Cristina Tenório between 2011 and 2013. The site is located on a rocky coast, in the southwestern limit of Ilha Grande bay (Figure 2, top). The island has an area of 190 km² with 47 beaches along 155 km perimeter. The Acaiá site has an area of approximately 9000 m2 and the excavation took place at coordinates 23.17°S, 44.37°W (Datum WGS84). The site is characterized by black soil due to the large quantity of decomposed organic matter and charcoal. The archaeological remains are found on the surface, in depth (varying from 20 to 120 cm deep), and inside a grotto. The areas with the thickest packages correspond to the oldest occupations, where stratigraphy is marked by the presence of malacological layers intercalated with black soil. These sectors have also the highest concentrations of artifacts and human bones. The samples used in this study are from sector 47 where a trench of 1×2 m was excavated (Figure 2, bottom). Charcoal, marine mollusk, and fish otolith samples were collected from the base of the occupation (80–110 cm deep) within the same archaeological context.
Photos by Maria Cristina Tenório showing the Ilha Grande coast (top left), Acaiá shellmound (top right), and the trench in sector 47 (bottom).
Anthracological analysis took place at the National Museum of the Rio de Janeiro Federal University (UFRJ). Charcoal pieces were manually broken, exposing transverse, longitudinal-tangential and longitudinal-radial sections, so that anatomical features could be identified. Samples were examined under a reflected light brightfield/darkfield microscope and compared to a reference collection (charcoal collection from the National Museum, UFRJ – Scheel-Ybert, Reference Scheel-Ybert2016) and the use of specialized literature (e.g. Metcalfe and Chalke Reference Metcalfe and Chalk1950; Détienne and Jacquet Reference Détienne and Jacquet1983).
The otolith samples were 14C dated and two of them were analyzed for stable isotopes of oxygen and carbon. The use of otolith for such studies presents advantages over other proxies since they are very resistant remains, not as subject to diagenesis as other fish bones or some mollusk shells (Aguilera et al. Reference Aguilera, Belem, Angelica, Macario, Crapez, Nepomuceno, Paes, Tenório, Dias, Souza, Rapagnã, Carvalho and Silva2015, Reference Aguilera, Rocha, Lopes, Lima, Lopes, Machado, Guimaraes, Crapez, Tenório and Nepomuceno2017; Bertucci et al. Reference Bertucci, Aguilera, Vasconcelos, Nascimento, Marques, Macario, Albuquerque, Lima and Belém2018; Carvalho et al. Reference Carvalho, Macario, Lima, Chanca, Oliveira, Alves, Bertucci and Aguilera2018).
In this study, we focus on the use of Micropogonias furnieri (Demarest 1823) (common name: corvina/whitemouth croaker) otoliths. This species is an euryhaline migratory teleostean demersal fish, widely distributed in the brackish and coastal waters up to 100 m deep (Mianzan Reference Mianzan, Lasta, Acha, Guerrero, Macchi and Bremec2001) in the Atlantic Ocean from Veracruz, Mexico (20.33°N) to the the Gulf of San Matías (41°S), Argentina (Gonçalves and Passos Reference Gonçalves and Passos2010; Ferreira et al. Reference Ferreira, Freire, Souza, Cortez-Vega and Prentice2013). This seasonal fish spawns mainly at the bottom salinity front of the estuary, in the inner region, and is commonly found in the summer when it migrates for breeding (Militelli et al. Reference Militelli, Macchi and Rodrigues2013). It is carnivorous, with preference for benthic organisms, feeding on crustaceans, mollusks, and polychaetes (Patillo et al. Reference Patillo, Czapla, Nelson and Mónaco1997; Denadai et al. Reference Denadai, Santos, Bessa, Fernandez, Luvisaro and Turra2015).
Radiocarbon analyses of charcoal, marine mollusk shells, and otoliths were performed. Two charcoal samples were dated at Beta Analytic, two otoliths at LAC-UFF (Macario et al. Reference Macario, Gomes, Anjos, Carvalho, Linares, Alves, Oliveira, Castro, Chanca, Silveira, Pessenda, Moraes, Campos and Cherkinsky2013), and the other six samples were prepared at LAC-UFF and measured at the Center for Applied Isotope Studies (CAIS) in Georgia, USA (Cherkinsky et al. Reference Cherkinsky, Culp, Dvoracek and Noakes2010).
Charcoal samples were prepared following regular acid-base-acid treatment, combustion, purification of carbon dioxide and conversion to graphite, at Beta Analytic and at LAC-UFF.
Chemical treatment of the otolith and mollusk samples followed standard procedures with etching in 0.1M hydrochloric acid followed by hydrolysis in 85% phosphoric acid. The carbon dioxide produced was purified and graphitized in independently sealed Pyrex tubes at 550ºC (Macario et al. Reference Macario, Souza, Aguilera, Carvalho, Oliveira, Alves, Chanca, Silva, Douka, Decco, Trindade, Marques, Anjos and Pamplona2015b, Reference Macario, Alves, Moreira, Oliveira, Chanca, Jou and Diaz2017). Fossil calcite and C2 IAEA reference samples were prepared together with unknowns for quality control. The samples were measured in a 250 kV single stage accelerator mass spectrometry system (SSAMS) at LAC-UFF or at a 500 kV system at CAIS, both produced by the National Electrostatics Corporation (NEC).
Calibration was performed with the OxCal v4.3.2 calibration software (Bronk Ramsey Reference Bronk Ramsey2009; Bronk Ramsey and Lee Reference Bronk Ramsey and Lee2013). The model constrains the group of results to a single phase following Macario et al. (Reference Macario, Souza, Aguilera, Carvalho, Oliveira, Alves, Chanca, Silva, Douka, Decco, Trindade, Marques, Anjos and Pamplona2015a), considering that the samples belong to a common period of time. Results for the charcoal samples were calibrated with the SHCal13 curve (Hogg et al. Reference Hogg, Hua, Blackwell, Niu, Buck, Guilderson, Heaton, Palmer, Reimer, Reimer, Turney and Zimmerman2013), and mollusk and fish otolith dates were calibrated with the Marine13 curve (Reimer et al. Reference Reimer, Bard, Bayliss, Beck, Blackwell, Bronk Ramsey, Grootes, Guilderson, Haflidason, Hajdas, Hatté, Heaton, Hoffmann, Hogg, Hughen, Kaiser, Kromer, Manning, Niu, Reimer, Richards, Scott, Southon, Staff, Turney and van der Plicht2013), with an undetermined offset (ΔR), with a possible range from –500 to 500 14C yr.
Otolith isotopic analyses (δ18O and δ13C) were performed at the Stable Isotopes Laboratory of the Department of Earth Sciences, ETH Zürich. A microdrill was used in the central area, from the inner surface of the sagitta approximately to the otolith core, in order to cover the complete life history of the fish. For each isotope analysis, approximately 100–150 µg of powder sample was collected to react with 85% phosphoric acid at 70°C on a GasBench II gas handling system. The CO2 was analyzed on a DeltaPlusXP isotope ratio mass spectrometer. Isotope ratios are reported in per mil units (‰) relative to the international Vienna Pee Dee Belemnite (VPDB) scale using the standard δ notation: δsample=[(Rsample/Rstandard)–1]×1000, where R is 18O/16O or 13C/12C ratio. The results were calibrated to VPDB using NBS-10 standard and corrected for isotopic fractionation by normalising with two standards with well-known isotopic composition. To convert the delta values from VPDB to VSMOW it was used the equation δ18OVSMOW=(1.03092×δ18OVPDB)+30.92‰ (Kim et al. Reference Kim, Coplen and Horita2015). The precision of the data was less than or equal to 0.02 and 0.06‰ VPDB for δ18O and δ13C.
RESULTS AND DISCUSSION
The anthracological analysis of Acaiá charcoals revealed, in level 90–100 cm, 3 wood fragments, including 1 fragment of Myrtaceae (plant family comprising several genera and species, many of them frequent in the restinga environment) and 2 indeterminate fragments, including 1 knot, as well as 5 fragments of calcinated palm nuts. In level 100–110 cm, 6 wood fragments were identified, being 4 Fabaceae fragments (a very large plant family, frequent in both restinga and Atlantic forest) and 2 bark fragments, in addition to 17 fragments too small to allow identification. Nuts and bark do not leave doubt of very short-lived material. The nuts are palm trees fruits and barks are the most external layers of the trees, therefore the most recent material of trunk or branches. Myrtaceae are short-lived plants, especially in the restinga, never reaching significantly thick trunks. Fabaceae include long-lived species, but this is very unlikely in this case. Anatomical features suggest that all the analyzed fragments come from the same wood piece, in which case the bark and wood pieces would belong to the external portion (and therefore more recent part) of the same log.
The obtained results for the 14C ages of the samples from the Acaiá shellmound are presented in Table 1.
Results for 14C ages of samples from levels 80–110 cm.

The δ18O values obtained for two of the otoliths from the Acaiá archaeological site, –0.86 and –0.03‰, suggest the presence of cold waters near Angra dos Reis by 3 ka. Present-day water temperatures shown in Figure 3 attest the presence of cold waters in this region. The transects show that despite surface temperatures (Figure 3) are above 20ºC, the coldest waters are confined to the subsurface, below 20 m deep.
Transects of water temperature versus depth in Rio das Ostras, Saquarema, and Angra dos Reis. The average modern sea water temperature (°C) and salinity (gray lines in the transects) are taken from the World Ocean Database (WOD) (Boyer et al. Reference Boyer, Antonov, Baranova, Coleman, Garcia, Grodsky, Johnson, Locarnini, Mishonov, O’Brien, Paver, Reagan, Seidov, Smolyar and Zweng2013).

For the Rio das Ostras region, the δ18O-derived (–1.5 to –0.4‰) paleotemperature estimate was based on the shell of I. brasiliana (Lamarck, 1818) from the Tarioba shellmound and ranges from 18 to 24ºC, in agreement with present day temperatures (Aguilera et al. Reference Aguilera, Belem, Angelica, Macario, Crapez, Nepomuceno, Paes, Tenório, Dias, Souza, Rapagnã, Carvalho and Silva2015). Bertucci et al. (Reference Bertucci, Aguilera, Vasconcelos, Nascimento, Marques, Macario, Albuquerque, Lima and Belém2018) observed a wide range of palaeotemperatures in fish otolith (Micropogonias funieri) from the Saquarema region (Beirada, Manitiba, and Girau shellmounds), with values from 16 to 25ºC. All these sites show temperature anomalies, probably related to the coastal upwelling which could already be present a few thousand years ago.
On the other hand, SST is not a primary indicator for upwelling (it is a mixed signal that can be altered by several factors) and MRE data is scarce and temporally limited. In order to achieve a better understanding about the impact of factors such as upwelling and terrestrial runoff on the MRE, it is crucial to assess the relationship between ∆R values and factors such as SST, upwelling-favorable winds and salinity, which are proxies for upwelling and freshwater influence, respectively.
Considering the calibrated ages of the analyzed samples from the Acaiá shellmound and leaving the ∆R undetermined, we observed an offset of –80 ± 87 14C yr. Despite the large uncertainty of such result, due to the limited number of samples, the probability density distribution presented in Figure 4 displays a negative range, similar to most of the shell mounds on the coast of Rio de Janeiro studied so far (Macario and Alves Reference Macario and Alves2018). The few available results for ∆R values from prebomb samples (see Macario and Alves Reference Macario and Alves2018 and references therein) disagree with archaeological data. One can argue that the former is more representative of the oceanic MRE while the ones derived from shellmounds reflect the estuary. On the other hand, if the purpose of calculating ∆R values is to better calibrate archaeological samples 14C ages, the latter would be the most appropriate to be used.
Probability density distribution for the ∆R value estimated from the Acaiá shellmound samples.

Figure 5 shows a comparison between all the probability distributions: negative results in Saquarema, Rio das Ostras, where the influence of lagoons and rivers prevails, and the positive one in Cabo Frio. For the two sites in Saquarema, the results were negative distributions: Manitiba –82±71 14C yr (Carvalho et al. Reference Carvalho, Macario, Oliveira, Oliveira, Chanca, Eduardo Alves, Souza, Aguilera and Douka2015) and Saquarema –140±66 14C yr (Alves et al. Reference Alves, Macario, Souza, Aguilera, Goulart, Rita Scheel-Ybert, Bachelet, Carvalho, Oliveira and Douka2015a), showing freshwater influence at 4.1–3.7 cal kBP. This area has a large lagoon system, which could explain the obtained results. At the Tarioba shellmound in Rio das Ostras, the distribution is mostly negative with a mean of –127±67 14C yr (Macario et al. Reference Macario, Souza, Aguilera, Carvalho, Oliveira, Alves, Chanca, Silva, Douka, Decco, Trindade, Marques, Anjos and Pamplona2015a), at 3.7–3.5 cal kBP, possibly due to riverine discharge.
Probability density distribution for the ∆R values obtained for the studied shellmounds on the coast of Rio de Janeiro, from North to South. A mostly positive distribution is shown in blue while the negative ones are shown in red (see digital version for colors). Dots represent mean values and uncertainties refer to 1-sigma ranges.
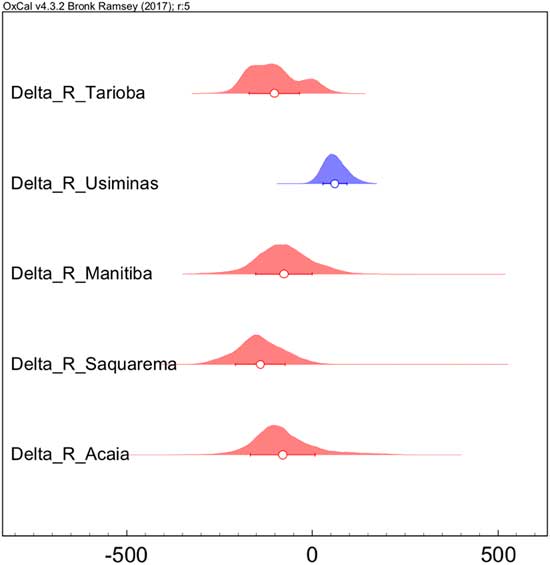
On the northeastern coast of Rio de Janeiro, a positive ∆R value of 67±33 14C yr was observed for the Usiminas shellmound, on Cabo Frio Island, which was understood to be evidence of the coastal upwelling at about 1.6–1.2 cal kBP (Macario et al. Reference Macario, Alves, Chanca, Oliveira, Carvalho, Souza, Aguilera, Tenório, Rapagnã, Douka and Silva2016). Like Cabo Frio Island, Ilha Grande is a rock island, but more influenced by freshwater drainage, close to the Ilha Grande bay and with a few lagoons. Moreover, the obtained results for Ilha Grande seem to disclose a relevant continental input. In order to understand the observed ΔR distributions, it is important to discuss any possible bias, such as the anthropogenic influence by using otolith or shells, and both spatial and temporal patterns.
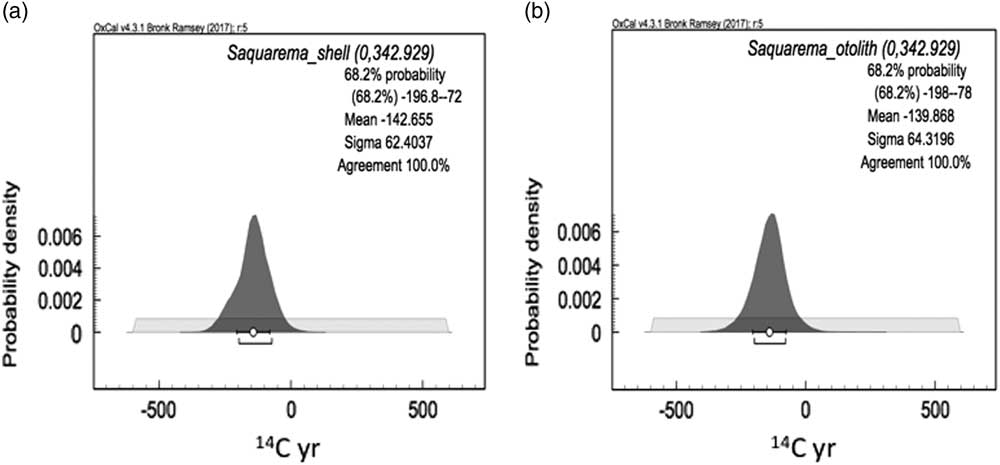
For comparing mollusk- and otolith-based results we have calculated separate ∆R values for the Saquarema shellmound. As shown in Figure 6, if we separate fish from shells, the ∆R remains statistically the same. In the case of the Saquarema area, despite being close to the upwelling region, the influence of the lagoon still prevails in the sample matrix, whether considering only the whitemouth croaker fish otolith or the mollusk shells.
∆R distribution for the Saquarema shellmound derived from paired samples: (a) shell (n=36) and charcoal (n=6); (b) otolith (n=8) and charcoal (n=6).
This fish species has been used for a MRE study in Lagoa dos Patos, in the south of Brazil, where another kind of archaeological site allows the comparison of aquatic and terrestrial materials within the same context. In the work of Milheira et al. (Reference Milheira, Macario, Chanca and Alves2017), otoliths from Pogonias cromis (Linnaeus 1766) and Micropogonias furnieri (Demarest 1823) were compared to charcoal samples, resulting in a mostly terrestrial signal, with 14C reservoir offset R from the SHCal13 atmospheric curve estimated in 63±53 14C yr. Similar to what happens in the lagoon region on the northeastern coast of Rio de Janeiro, even though this fish species migrate from the lagoon to the open sea, the continental influence still prevails in this region.
Concerning the local MRE on the coast of Rio de Janeiro, the opposite effects of coastal upwelling and freshwater discharge interplay in a complex way. As would be expected, the resulting ∆R will reflect the 14C signal of both contributions as well as their respective magnitudes. The whitemouth croaker has been reported to spend different stages of its life spam at different depths in the water column (Costa et al. Reference Costa, Muelbert, Moraes, Vieira and Castello2014), which implies a mixed signal recorded in its otoliths. It seems reasonable to assume that in regions presenting 14C gradients in the water column, only sedentary species would be able to illustrate such differences in 14C concentrations. Studies comparing both sedentary and vertically moving species in the same region need to be performed in order to evaluate how sensitive the MRE is to changes in living habits.
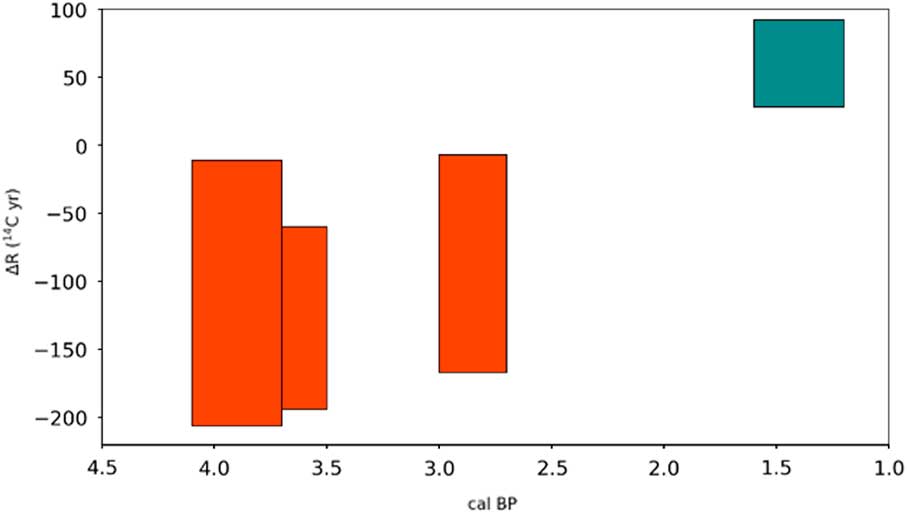
So far, evidence of paleo-upwelling was observed only for the Usiminas shellmound on Cabo Frio Island. As discussed before, this result implies that upwelling influence was limited to the Cabo Frio Island region. On the other hand, if we take into account the occupational periods of the studied archaeological sites (from the ages of the samples used for ∆R calculation), we notice that the occurrence of positive ΔR is also limited to 1.6–1.2 kBP (Macario et al. Reference Macario, Alves, Chanca, Oliveira, Carvalho, Souza, Aguilera, Tenório, Rapagnã, Douka and Silva2016). Negative results cover the periods from 4.1–3.5 kBP (Alves et al. Reference Alves, Macario, Souza, Pimenta, Douka, Oliveira, Chanca and Angulo2015b; Carvalho et al. Reference Carvalho, Macario, Oliveira, Oliveira, Chanca, Eduardo Alves, Souza, Aguilera and Douka2015; Macario et al Reference Macario, Souza, Aguilera, Carvalho, Oliveira, Alves, Chanca, Silva, Douka, Decco, Trindade, Marques, Anjos and Pamplona2015a) and from 3.0–2.7 kBP (Figure 7). New studies are needed to evaluate whether such difference in ΔR values is due to temporal or spatial variations. As shown in Figure 8, by 4.1–3.5 kBP sea level was approximately 1.5–2.0 m higher than at 1.6–1.2 kBP (Jesus et al. Reference Jesus2017).
∆R (1-sigma range) values for the 4 sites studied on the coast of Rio de Janeiro over the last thousand years.
Sea-level variation during late Holocene on the Rio de Janeiro coast.

The literature on sea-level reconstructions for the southern and southeastern portions of the Brazilian coast is somewhat controversial. Corrêa (Reference Corrêa1996) has studied the Rio Grande do Sul (South Brazil) littoral through 15 transversal bathymetric profiles based on 18 uncalibrated 14C dates of bioclastic material. Although he concluded that a regression of –7.5 m took place between 5.0 and 3.5 kBP during the transition from warm and humid to a colder climate, only 3 dates were available for this period. Moreover, the use of bulk carbonate material and the lack of a proper calibration weaken such interpretations. More recent works show regressive movement up to +2 m above present sea-level at 3.5 cal kBP following the transgressive maximum of +3.0 m at 5.0 cal kBP (Milne et al. Reference Milne, Long and Bassett2005; Jesus et al. Reference Jesus2017). These works were based predominantly on 14C dating of vermetid, which are space-temporal indicators, allowing a precision of 0.1–1.0 m depending on the wave pattern of the region. Angulo et al. (Reference Angulo, Lessa and de Souza2006) present a review of the available curves for the Brazilian coast.
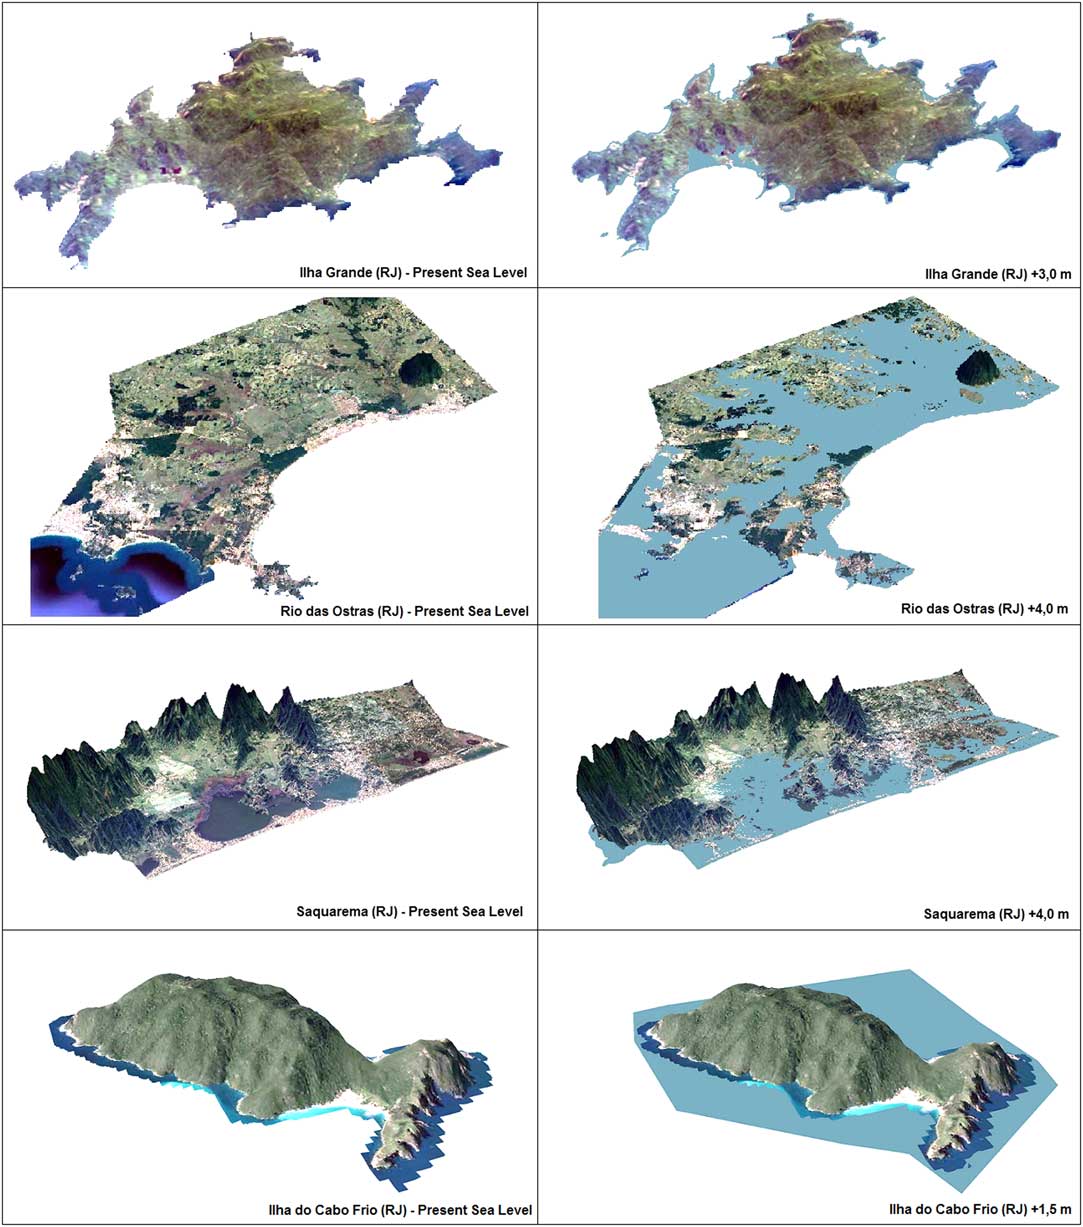
The present sea level simulations (Figure 9) were made with cartographic material available at NASA and IBGE (Instituto Brasileiro de Geografia e Estatística) websites. Altitudes reached by the ocean surface (based on ArcGis software) are presented. In Cabo Frio Island, no variation can be observed on the costal landscape with an increase in sealevel of +1.5 m estimated for 1.6–1.2 cal kBP. On the other hand, the other areas show drowning of coastal lowlands and the expansion of water bodies of lagoon systems at 3.0–2.7 cal kBP in Ilha Grande and at 4.1–3.5 cal kBP in Saquarema and Rio das Ostras. For Saquarema, as for other coastal lagoons, a sand barrier was already present, with partial erosion of the facies and drowning of its rear end. In all these scenarios biologic and geomorphologic records can be found, adding up to the archaeological data to support such paleoenvironmental representation. As pointed out by other studies, during Late Holocene, sea-level variations and climatic changes are strongly correlated to the intensity of upwelling and its influence on the coastal system.
Scenario of past sea level in the studied region.
The work of Sylvestre et al. (Reference Sylvestre, Sifeddine, Turcq, Gil, Albuquerque, Lallier-Verges and Abrao2005), who analyzed a core from a hypersaline lagoon on the coast of Rio de Janeiro, diatom analysis supported by sedimentological data revealed a varying high water level from 4.5 to 2.2 kBP induced by successive freshwater inputs in to the lagoon, when the central part of the Brazilian coast was mostly subjected to south to southeasterly winds and weaker trade winds. They concluded that from 2.2 kBP on, trade winds dominated, implying drier conditions at the easternmost part of the Rio de Janeiro coastline, and suggest a late Holocene increase in El Niño activity. However, a regional drier condition is well related to upwelling intensity, as suggested by Lessa et al. (2016) and Albuquerque et al. (Reference Albuquerque, Meyers, Belem, Turcq, Siffedine, Mendoza and Capilla2016). Nagai et al. (Reference Nagai, Sousa, Burone and Mahiques2009) studied the inner shelf of Cabo Frio by analyzing sedimentology and benthic foraminifera from a core and associated stronger hydrodynamic conditions and a higher productivity regime after 3.0 cal kBP to the establishment of the upwelling process in Cabo Frio, with an enhancement after 2.5 cal kBP, resulting from the combined action of NE winds and the intensification of the meandering pattern of the BC. Lessa et al. (2016) used δ18O, Mg/Ca, and assemblages of planktonic foraminifera from cores and observed large oceanographic and climatic changes between 5.0 and 3.5 BP. The internal front of the BC became warm and subsurface SACW upwelling was stronger. At 3.5–2.5 kBP, the BC acquired its modern dynamics, but weak NE winds weakened the SACW’s contribution to upwelling events. During the last 2.5 kBP, the NE winds reintensified, promoting frequent episodes of upwelling.
Although all these evidences reinforce the hypotheses of this study, it is still essential to assess the most recent occupation of the archaeological sites of Ilha Grande, as well as the oldest ones on the Island of Cabo Frio, to understand the impact of the upwelling in the east and west zones of the coast of Rio de Janeiro during the last thousand years.
CONCLUSIONS AND FUTURE PERSPECTIVES
From the results obtained so far, it was possible to observe that otoliths from the whitemouth croaker can be used as a proxy to distinguish the influence of freshwater discharge from the presence of 14C depleted upwelling waters. For the Saquarema shellmound, ΔR values obtained from mollusk shells or from whitemouth croaker otolith resulted in similar distributions. Studies comparing both sedentary and vertically moving species in the same region need to be performed in order to evaluate how sensitive the MRE is to changes in living habits. As for the other sites in the lagoon region (Saquarema, Manitiba and Tarioba) in the northeast of Rio de Janeiro, negative ∆R values are likely related to the terrestrial input in the Acaiá shellmound, on Ilha Grande island. Despite being a rocky island, Ilha Grande gives a negative ΔR at about 3–2.7 kBP. The next step in this research is to evaluate whether the upwelling influence observed in the Cabo Frio region was already present at 3 kBP and whether more recent occupations of Ilha Grande sites would be associated with negative ΔR. The relation between the range of influence of the upwelling in the past and variations in ocean dynamics over the last millennia are aspects to be considered.
ACKNOWLEDGMENTS
The authors would like to thank Brazilian financial agencies CNPq (Conselho Nacional de Desenvolvimento Científico e Tecnológico, 305079/2014-0 and INCT-FNA 464898/2014-5) and FAPERJ (Fundação Carlos Chagas Filho de Amparo à Pesquisa do Estado do Rio de Janeiro, E-26/110.138/2014 and E-26/111.278/2014) for their support. We thank the editor Tim Jull, Jesper Olsen, and an anonymous reviewer for comments and suggestions that helped to improve this paper.



