I. INTRODUCTION
The elucidation of the mechanism of loss in hot ductility of carbon steels in the austenite region, especially in the lower temperature range, is important because loss in ductility leads to several defects or transverse cracking in continuous casting slabs, the consequence of which is poor workability during hot rolling. Reference Lankford1,Reference Suzuki, Nishimura and Yamagnchi2 The thermo-mechanical conditions that promote transverse cracking have been analyzed in a variety of steel grades as a function of composition. Reference Mintz, Yue and Jonas3,Reference Mintz4 However, the introduction of new technologies and design of new alloys require further understanding of the origin of loss in ductility such that the defects and cracking can be minimized.
A number of experimental results have indicated that grain boundary segregation of impurity is a key factor responsible for loss in hot ductility. Reference Nagasaki, Aizawa and Kihara5–Reference Matsuoka, Osawa, Ono and Ohmura8 Nagasaki et al. Reference Nagasaki, Aizawa and Kihara5 had observed that grain boundary segregation of sulfur (no precipitation) leads to embrittlement in carbon steel. Matsuoka et al. Reference Matsuoka, Osawa, Ono and Ohmura8 found that Sn segregates at the interface between austenite and proeutectoid ferrite or at the grain boundaries of austenite, and the segregation of Sn promotes loss in hot ductility by encouraging the formation of cavities. Liu et al. Reference Liu, Abiko and Tanino6 found in high purity Fe–S alloys that the embrittled specimens failed by intergranular mode and were characterized by nucleation, growth, and coalescence of cavities. Cavities can nucleate on S-segregated grain boundaries and may not be related to second-phase particles.
Intergranular segregation can either be equilibrium or nonequilibrium. Equilibrium segregation (EGS) is a thermodynamic process, on the other hand, nonequilibrium segregation (NGS) is a kinetic process taking place during or after cooling from a high solution treatment temperature. Nagasaki et al. Reference Nagasaki, Aizawa and Kihara5 experimentally showed through Auger electron spectroscopy (AES) analysis that more intensive embrittlement occurs at higher solution treatment temperature and that precipitates are not observed in carbon steels. The embrittlement is enhanced with increase in solution treatment temperature because of increase in segregation. Furthermore, sulfur segregation disappeared at lower cooling rate, and ductility was recovered. Only NGS can increase with increase in solution treatment temperature and disappear by lowering the cooling rate, when it is lower than the critical cooling rate. Reference Xu and Song9,Reference Xu and Cheng10
NGS includes thermally induced nonequilibrium grain boundary segregation (TNGS) and stress induced nonequilibrium grain boundary segregation (SNGS). Reference Xu and Cheng10,Reference Xu, Zheng, Wang and Misra11 It must be pointed out that SNGS is an important additional contributor to loss in hot ductility of C–Mn steels. Reference Xu, Zheng, Wang and Misra11 In this study, we will only focus on the effects of TNGS and propose a mechanism of nonequilibrium grain boundary segregation of impurity elements to explain loss in hot ductility. The theoretical models and the calculated results will be shown and discussed in this paper. This mechanism of nonequilibrium grain boundary segregation of impurity elements will be further verified with the experimental results of hot ductility in C–Mn steels.
II. THEORETICAL MODELS
A. Critical time and healing effect
The mechanism of TNGS relies on the formation of vacancy–solute atom complexes. Within the matrix, solute atoms, vacancies, and their complexes are in equilibrium. Reference Williams, Stoneham and Harries12–Reference Faulkner15 If a sample is solution treated at an elevated temperature and subsequently cooled to a lower temperature and held at this temperature, there must be an isothermal holding time (Ht), at which the grain boundary segregation concentration reaches a maximum value, this Ht is called the critical time of TNGS. The fact that a critical time exists is a characteristic aspect of TNGS. Reference Xu and Song9,Reference Xu and Cheng10,Reference Xu, Song, Shi, Gust and Yuan16 The critical time is given by Reference Xu and Song9,Reference Xu and Cheng10,Reference Faulkner13 :
 $${t_{\rm{c}}} = {{\left[ {{r^2}\ln {{{D_{\rm{c}}}} \mathord{\left/ {\vphantom {{{D_{\rm{c}}}} {{D_{\rm{i}}}}}} \right. \kern-\nulldelimiterspace} {{D_{\rm{i}}}}}} \right]} \mathord{\left/ {\vphantom {{\left[ {{r^2}\ln {{{D_{\rm{c}}}} \mathord{\left/ {\vphantom {{{D_{\rm{c}}}} {{D_{\rm{i}}}}}} \right. \kern-\nulldelimiterspace} {{D_{\rm{i}}}}}} \right]} {\left[ {\delta \left( {{D_{\rm{c}}} - {D_{\rm{i}}}} \right)} \right]}}} \right. \kern-\nulldelimiterspace} {\left[ {\delta \left( {{D_{\rm{c}}} - {D_{\rm{i}}}} \right)} \right]}}\quad ,$$
where D i and D c are the diffusion coefficients for solute atom and complexes, respectively. r is the grain radius and δ is the critical time constant. The critical time was verified for different solutes in a number of alloy systems. Reference Xu17–Reference Xu22
When the Ht at a temperature after quenching from an elevated temperature is longer than the critical time at the holding temperature, the TNGS concentration of impurities decreases and the loss in hot ductility induced by impurities is improved by prolonging the Ht at the temperature, referred as the healing effect. Reference Xu, Zheng, Wang and Misra11
B. Peak temperature
When samples are maintained at a solution treatment temperature T 0 and then rapidly cooled to a lower temperature T, the relationship between the maximum concentration of TNGS at T and the cooling temperature difference T 0 − T was formulated as Reference Xu and Cheng10,Reference Xu, Zheng, Wang and Misra11,Reference Xu23 :
 $${C_{\rm{m}}}\left( T \right) = {C_{\rm{g}}}\left( {{{{E_{\rm{b}}}} \mathord{\left/ {\vphantom {{{E_{\rm{b}}}} {{E_{\rm{f}}}}}} \right. \kern-\nulldelimiterspace} {{E_{\rm{f}}}}}} \right)\exp \left\{ {\left[ {\left( {{{{E_{\rm{b}}} - {E_{\rm{f}}}} \mathord{\left/ {\vphantom {{{E_{\rm{b}}} - {E_{\rm{f}}}} {k{T_0}}}} \right. \kern-\nulldelimiterspace} {k{T_0}}}} \right)} \right] - \left[ {\left( {{{{E_{\rm{b}}} - {E_{\rm{f}}}} \mathord{\left/ {\vphantom {{{E_{\rm{b}}} - {E_{\rm{f}}}} {kT}}} \right. \kern-\nulldelimiterspace} {kT}}} \right)} \right]} \right\}\quad ,$$
where C g is the concentration of solute within the grains, E b is the formation energy of vacancy–impurity complex, and E f is the vacancy formation energy.
The TNGS isothermal kinetic equations were derived for samples aged at temperature T i+1 after quenching from a higher temperature T i . Reference Xu and Song9–Reference Xu, Zheng, Wang and Misra11 When the aging time is shorter than the critical time t c(t ≤ t c) at temperature T i+1, then
 $${C_{\rm{b}}}\left( t \right) - {{{C_{\rm{m}}}\left( {{T_i}} \right)} \mathord{\left/ {\vphantom {{{C_{\rm{m}}}\left( {{T_i}} \right)} {\left( {{C_{\rm{m}}}\left( {{T_{i + 1}}} \right) - {C_{\rm{m}}}} \right)}}} \right. \kern-\nulldelimiterspace} {\left( {{C_{\rm{m}}}\left( {{T_{i + 1}}} \right) - {C_{\rm{m}}}} \right)}} = 1 - \exp \left( {{{4{D_{\rm{c}}}t} \mathord{\left/ {\vphantom {{4{D_{\rm{c}}}t} {\mathop {{a_{i + 1}}}\nolimits^2 {d^2}}}} \right. \kern-\nulldelimiterspace} {\mathop {{a_{i + 1}}}\nolimits^2 {d^2}}}} \right)erfc\left[ {{{2{{\left( {{D_{\rm{c}}}t} \right)}^{1/2}}} \mathord{\left/ {\vphantom {{2{{\left( {{D_{\rm{c}}}t} \right)}^{1/2}}} {{a_{i + 1}}d}}} \right. \kern-\nulldelimiterspace} {{a_{i + 1}}d}}} \right]\quad ,$$
where C m(T) is from Eq. (2), C b(t) is the grain boundary concentration at time t, α i+1 = C m(t i+1)/C g, d is the width of the concentrated layer. When the aging time is longer than the critical time (t ≥ t c) at temperature T i+1, then
 $${C_{\rm{b}}}\left( t \right) - {C_{\rm{g}}} = \left( {{1 \mathord{\left/ {\vphantom {1 2}} \right. \kern-\nulldelimiterspace} 2}} \right)\left[ {{C_{\rm{b}}}\left( {{t_{\rm{c}}}} \right) - {C_{\rm{g}}}} \right] \times \left( {erf\left\{ {{{{{\left( {{d \mathord{\left/ {\vphantom {d 2}} \right. \kern-\nulldelimiterspace} 2}} \right)} \mathord{\left/ {\vphantom {{\left( {{d \mathord{\left/ {\vphantom {d 2}} \right. \kern-\nulldelimiterspace} 2}} \right)} {\left[ {4{D_{\rm{i}}}(t - {t_{\rm{c}}})} \right]}}} \right. \kern-\nulldelimiterspace} {\left[ {4{D_{\rm{i}}}(t - {t_{\rm{c}}})} \right]}}}^{{1 \mathord{\left/ {\vphantom {1 2}} \right. \kern-\nulldelimiterspace} 2}}}} \right\}\exp \left( {{{4{D_{\rm{c}}}t} \mathord{\left/ {\vphantom {{4{D_{\rm{c}}}t} {\mathop {{a_{i + 1}}}\nolimits^2 {d^2}}}} \right. \kern-\nulldelimiterspace} {\mathop {{a_{i + 1}}}\nolimits^2 {d^2}}}} \right) - erf\left\{ { - {{{{\left( {{d \mathord{\left/ {\vphantom {d 2}} \right. \kern-\nulldelimiterspace} 2}} \right)} \mathord{\left/ {\vphantom {{\left( {{d \mathord{\left/ {\vphantom {d 2}} \right. \kern-\nulldelimiterspace} 2}} \right)} {\left[ {4{D_{\rm{i}}}(t - {t_{\rm{c}}})} \right]}}} \right. \kern-\nulldelimiterspace} {\left[ {4{D_{\rm{i}}}(t - {t_{\rm{c}}})} \right]}}}^{{1 \mathord{\left/ {\vphantom {1 2}} \right. \kern-\nulldelimiterspace} 2}}}} \right\}} \right)\quad ,$$
where C b(t c) is the grain boundary concentration at critical time t c. Eqs. (3) and (4) analytically describe the variation of grain boundary concentrations of solute C b(t) with aging time at temperature T i+1.
For such a thermal cycle, when the sample is held for a certain time at various temperatures after cooling quickly from a higher temperature, a holding temperature must exist at which the TNGS concentration of the solute attains a maximum (peak). The critical time at this holding temperature is equal or close to the Ht at various temperatures and this holding temperature is called the TNGS peak temperature. Reference Xu, Zheng, Wang and Misra11 This characteristic of TNGS was verified for P in steels Reference Wang, Wang, Si and Xu24–Reference Briant26 and S and Mg in a Ni–Cr–Fe alloy. Reference Xu22,Reference Wang, Xu, Song and Shao27,Reference Wang, Xu, Wang and Du28 Such a characteristic of TNGS provides a primary reason for the occurrence of ductility trough in C–Mn steels.
C. Effect of temperature difference
The relationship between the maximum concentration of TNGS and cooling temperature difference T 0 − T was calculated using Eq. (2) and was shown in Fig. 1 of Ref. Reference Xu, Zheng, Wang and Misra11. It is seen that the maximum concentration of TNGS increases monotonically with increase in cooling temperature difference T 0 − T, which is called effect of temperature difference. Reference Xu, Zheng, Wang and Misra11 This is another characteristic of TNGS and is a thermodynamic property, which is not related to the cooling rate. The difference between the solution treatment temperature and the aging temperature acts as a prerequisite for the occurrence of TNGS. This effect was confirmed by a number of researchers. Reference Xu, Zheng, Wang and Misra11,Reference Williams, Stoneham and Harries12,Reference Karlsson, Norden and Odelius30 It is envisaged from this effect that the depth and width of ductility trough will increase when the solution temperature is increasing during tensile test at the elevated temperature.
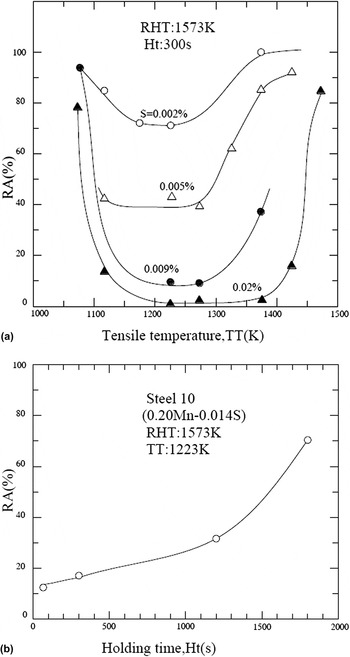
(a) Influence of TT and sulfur content on RA at a RHT of 1573 K for Ht of 300 s. (b) Influence of Ht on RA for steel 10. RHT and TT are 1573 and 1223 K, respectively. Reference Kizu and Urabe29

D. Critical cooling rate
As discussed in Refs. Reference Xu and Cheng10,Reference Xu17, when a sample continuously cooled from temperature T j to T i , the diffusion effect of solute atoms (or complexes) during cooling process is equal to that during holding for the effective time, t e, at temperature T i . The effective time is given by Reference Xu and Cheng10,Reference Xu17 :
 $${t_{\rm{e}}} = \mathop\sum_{j = 1}^n {{t_j}\exp \left[ {{{ - {E_{\rm{A}}}\left( {{T_i} - {T_j}} \right)} \mathord{\left/ {\vphantom {{ - {E_{\rm{A}}}\left( {{T_i} - {T_j}} \right)} {k{T_i}{T_j}}}} \right. \kern-\nulldelimiterspace} {k{T_i}{T_j}}}} \right]} \quad ,$$
where E A is the average diffusion activation energy for diffusions of complexes and solute atoms in matrix.
According to the concept of effective time and Eq. (5), there will be a cooling rate, if a sample is cooled to a lower temperature, there is an effective time for this cooling rate, which is equal to the critical time at the lower temperature. This corresponding cooling rate is called the critical cooling rate of the sample. If the samples are cooled at the critical cooling rate, a maximum amount of TNGS will be obtained. Accordingly, the hot ductility will reach the minimum if the sample is cooled at the critical cooling rate. Reference Xu and Cheng10 The existence of critical cooling rate was experimentally demonstrated for Sn segregation in low-carbon steel Reference Yuan, Jia, Guo, Shen and Song31–Reference Yuan, Jia, Guo, Shen, Song and Liu33 and B segregation in interstitial free steel. Reference El-Kashif, Asakura and Shibata34
III. EXPERIMENTAL RESULTS AND ANALYSIS
A. Ductility trough and calculations of critical time
Kizu and Urabe Reference Kizu and Urabe29 have systematically investigated hot ductility of low carbon steels with different Mn and S contents. The specimens were heated to 1573 K (the solution temperature, reheating temperature, RHT) at a rate of 5 K/s and then soaked for 600 s in a vacuum. Subsequently, the specimens were cooled to tensile test temperature (TT) in the range of 1023 to 1473 K at a constant rate of 30 K/s in nitrogen gas. After holding for 300 s (Ht) at each tensile temperature, the specimens were deformed at a strain rate of 22 s−1 until final fracture. The thermal cycle prior to the tensile test is similar to the thermal cycle in Sec. II. B and therefore a segregation peak temperature and the relative ductility trough should occur. The influence of TT on reduction-in-area (RA) is shown in Fig. 1(a). It is clear that a ductility trough does occur near the tensile TT of 1223 K. Moreover, the influence of Ht at the TT of 1223 K on hot ductility was also investigated and the results are presented in Fig. 1(b). Reference Kizu and Urabe29 When the Ht prior to tensile test is increased from 300 to 1800 s at 1223 K, the RA increases from 20 to 70%.
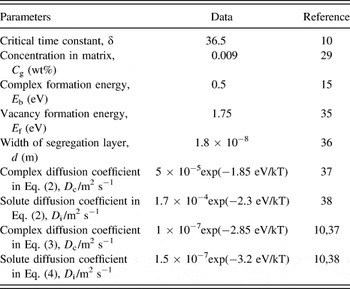
In Fig. 1(a), the RA decreases with increase in S concentration at all the tensile TTs. This means that sulfur in the steel is the key factor that induces embrittlement. It is suggested from the peak temperature and healing effect of TNGS in Fig. 1 that the critical time of S in this steel is about 300 s at 1223 K. The grain size of tested steel, which is absent in their study, is calculated to be 63 μm with a critical time of 300 s at 1223 K from Eq. (1). The data and references used for calculations are listed in Table I. The diffusion coefficient of sulfur–vacancy complex D c was calculated using the method described in Ref. Reference Song and Xu37. The grain size in ultra-low carbon steels measured by Kizu et al. Reference Kizu, Nagakati, Inazumi and Hosoya39 is in the range of 100–300 μm after a Ht of 6000 s at 1623 K and about 50 μm in ultra-low carbon steel measured by Zhang et al. Reference Zhang, Lin and Yu40 when the samples were austenitized at 1473 K for 600 s. Comparing the measured grain sizes with our calculated one, it is concluded that the suggestion is reasonable that the critical time of S TNGS is about 300 s at 1223 K in these steels studied by Kizu and Urabe. Reference Kizu and Urabe29
The parameters used for calculations.

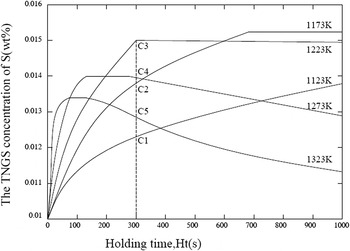
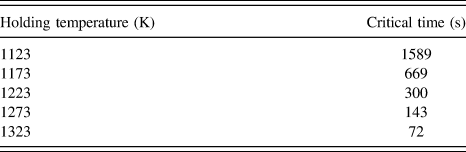
According to the calculated results of grain size of 63 μm, both the critical time and the isothermal kinetics were calculated for S TNGS in C–Mn steel which is held at 1123, 1173, 1223, 1273, and 1323 K, respectively, after cooling from the same RHT of 1573 K. The data and references used for calculations are also listed in Table I. The isothermal kinetics was calculated using Eqs. (1)–(4) (shown in Fig. 2) and the critical time was calculated using Eq. (1) (shown in Table II).

The critical time calculated at different holding temperatures.

It can be seen from Fig. 2 and Table II that both the critical time and the maximum TNGS concentrations increase with decreasing holding temperatures. These characters are consistent with the predictions from Eqs. (1) and (2). In addition, the rate of segregation to grain boundaries at higher temperatures is faster than that at lower temperatures when the Ht is shorter than the critical time. Thus, the curves of the isothermal kinetic at higher temperatures intersect those curves at lower temperatures. The intersected Ht is longer than the critical time at higher temperatures and shorter than the critical time at lower temperatures. This is also one of the important characteristics of TNGS.
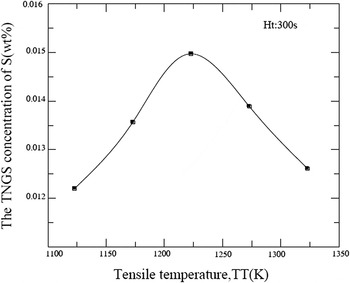
The vertical line in Fig. 2 indicates the Ht of 300 s, which is close to the critical time at a temperature of 1223 K. The TNGS concentration of S for a Ht of 300 s at 1123, 1173, 1223, 1273, and 1323 K is the concentration of the intersecting points of the vertical broken line with the isothermal kinetic curves, C1, C2, C3, C4, and C5 respectively. They are shown in Fig. 3 as a function of holding temperature. A maximum (peak) concentration is observed for C3 at 1223 K in Fig. 3. Therefore, a peak in embrittlement or hot ductility trough emerged at about 1223 K in Kizu and Urabe's experiments.
TNGS concentrations of S in C–Mn steel held for 300 s at 1123, 1173, 1223, 1273, and 1323 K, respectively, after cooling from 1573 K.

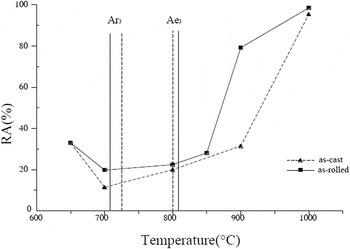
The ductility trough at intermediate temperatures in C–Mn steels was caused neither by the presence of thin film of deformation-induced ferrite enveloping the austenite grains or by grain boundary sliding in austenite. The evaluation of hot ductility in C–Mn steels was investigated by Calvo et al. Reference Calvo, Cabrera, Rezaeian and Yue41 and is presented in Fig. 4. For as-cast and as-rolled steels, the loss in ductility at high temperatures occurs in the austenitic range, i.e., at temperatures above Ae3 (austenite to ferrite transformation temperature under equilibrium conditions) of steels. Ductility remains low through the two phase austenite plus ferrite region and only at ∼650 °C the ductility begins to recover. Additionally, the segregation of sulfur on the surface of an interdendritic fracture was proven by AES. Reference Calvo, Cabrera, Rezaeian and Yue41 Thus, the loss in hot ductility in both the steels in the austenite range cannot be induced by localized strain in the ferrite film. Reference Calvo, Cabrera, Rezaeian and Yue41 Segregation can directly induce embrittlement of steels. The mechanism of grain boundary sliding is generally associated with creep, which occurs at strain rates typically below 10−4 s−1. Reference Mintz, Yue and Jonas3 However, the ductility trough in high temperature tensile test is frequently observed at high strain rates (2.3, 22, and 200/s). Reference Nagasaki, Aizawa and Kihara5,Reference Kizu and Urabe29,Reference Yasumoto, Maehara, Ura and Ohmori42 It is impossible for grain boundary sliding to occur at such high strain rates.
Hot ductility plots of the as-cast and as-rolled C–Mn steels after reheating treatment at 1330 °C. Reference Calvo, Cabrera, Rezaeian and Yue41

B. Ductility healing effect
In Fig. 1(b), the ductility was improved at a temperature of 1223 K on a prolonged Ht of 300–1800 s, which are longer than the calculated critical time of S, 300 s at 1223 K in the steel studied by Kizu and Urabe. Reference Kizu and Urabe29 Thus, the increase in RA on prolonged Ht at 1223 K [Fig. 1(b)] is the ductility healing effect and caused by the critical time of S TNGS.
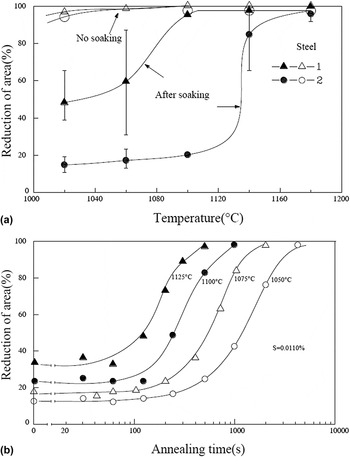
The ductility healing effect in C–Mn steels was also demonstrated by Kobayashi. Reference Kobayashi43 In Kobayashi's study, the steel of nominal composition (in wt%) Fe–0.015C–0.14Mn–0.011S–0.0385Al–0.0018O (steel 2) was solution treated at 1250 °C for 5 min and cooled to different TTs in the range of 1020–1180 °C at a cooling rate of 5 °C/s. The steel was held at this temperature for 60 s and then subjected to tensile test. The loss in hot ductility in steel 2 is presented in Fig. 5(a). The lowest ductility was observed in the temperature range of 1020–1120 °C.
(a) Hot ductility of steels 1 and 2 as a function of TT. (b) Isothermal hot ductility change in steel 2 at different TTs after solution treatment at 1250 °C in Kobayashi's study. Reference Kobayashi43

Before the commencement of tensile test with steel 2, increasing the annealing time at TT between 1050 and 1125 °C, where ductility minimum occurred, the ductility was considerably restored with increase in annealing time as shown in Fig. 5(b). From these results, it can be inferred that the critical time of S TNGS between 1050 and 1125 °C is about 60 s (the calculated critical time of S at 1050 °C shown in Table II is 72 s). According to the method of Kobayashi, prior to tensile test, the samples were held for 60 s. This means that when samples are annealed for 0 s as shown in Fig. 5(b), the real Ht of steel was 60 s for the entire tensile test. Thus, increasing the isothermal annealing time to more than 60 s at these temperatures led to decrease in TNGS of S and increase in RA at these temperatures. The phenomenon of peak temperature and healing effects in the above experiments confirmed the existence of critical time in C–Mn steels.
C. The effect of temperature difference on hot ductility
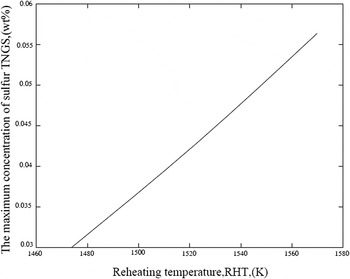
Figure 6 reported by Kizu and Urabe Reference Kizu and Urabe29 shows the influence of RHT on RA for different manganese contents in steels in the range of 0.014–0.017 wt% sulfur. For 0.14–0.20 wt% manganese steels, the RA is below 20% at the RHT of 1573 K and increases to greater than ∼70% at the RHT of 1473 K. For 0.29 wt% manganese steel, the RA increases from 50 to 85%, while the RHT decreases from 1573 to 1548 K. In Fig. 6, the TT is 1223 K and the Ht at TT is 300 s. According to the calculation results in Sec. III. A, when the samples are holding at 1223 K for 300 s, all of the concentrations of sulfur TNGS will reach to the maximums, irrespective of the difference of RHTs. The relationship between the maximum of S TNGS and the RHT is calculated using Eq. (2) and shown in Fig. 7. The data and references used for calculations are listed in Table I. The concentration of S in matrix C g is equal to 0.014 wt%. It is indicated in Fig. 7 that the maximum concentration of S TNGS is decreasing with decreasing RHT. Thus, the ductility is gradually improved with decreasing RHT.
Influence of RHT on RA at the tensile TT of 1223 K for a Ht of 300 s in 0.014–0.017 wt% sulfur steels. Reference Kizu and Urabe29

The relationship between the RHT and the maximum concentration of S TNGS.

The improvement in hot ductility at lower RHT in Fig. 6 cannot be attributed to a decrease in dissolved S during the reheating process, which decreases EGS. Such a dramatic increase in RA from 50 to 85% due to a decrease in RHT from 1573 to 1548 K for a short Ht of 300 s cannot be related to equilibrium precipitation phase, which decreases with dissolved S. On the other hand, while EGS of sulfur occurs, the amount of EGS not only decreases by decreasing the solubility of solute S, but also increases on decreasing the RHT. Reference Mclean44 Thus, the decrease in EGS should at least be indeterminacy with the decrease in RHT. Such a dramatic increase in RA can only occur because of the effect of temperature difference of TNGS.
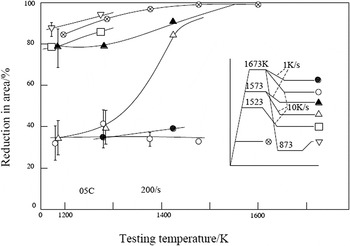
The effect of temperature difference on hot ductility in C–Mn steels has been frequently observed. As shown in Fig. 8, Reference Nagasaki, Aizawa and Kihara5 the distinct ductility loss is observed in C–Mn steels (0.26Mn–0.015S) after solution treatment, particularly at 1673 K. The ductility loss is reduced with decrease in solution treatment temperature. When the steel was heated directly to the TT without solution treatment, it exhibited consistently excellent hot ductility, regardless of the TT, as shown by the line in Fig. 8. It must be noted that in Fig. 5(a) the steels that were heated directly at different TTs without solution treatment also exhibited excellent hot ductility, irrespective of the TT, as shown by no soaking line in Fig. 5(a). Reference Kobayashi43 This means that there is no loss in hot ductility without temperature difference between solution temperature and TT. Clearly, these results confirmed that TNGS does not take place without the temperature difference between solution treatment temperature and TT and is discussed in Sec. II. C.
Hot ductility with various thermal histories for C–Mn steels. Reference Nagasaki, Aizawa and Kihara5

D. The effect of critical cooling rate on hot ductility
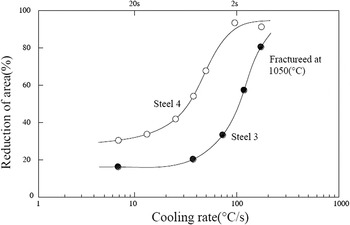
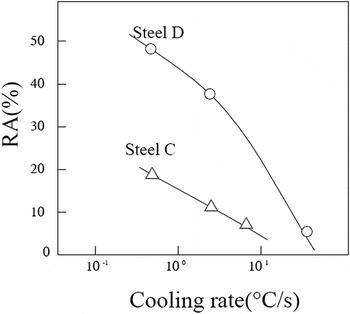
The ductility of C–Mn steels is significantly influenced by the cooling rate, prior to the tensile test from the solution treatment temperature to the TT. Kobayashi Reference Kobayashi43 reported that when the steels were cooled to the TT of 1050 °C from a solution treatment temperature of 1250 °C and the cooling rate was higher than 30 °C/s, the RA of C–Mn steels decreases with decrease in cooling rate (Fig. 9). However, as illustrated in Fig. 10, Yasumoto et al. Reference Yasumoto, Maehara, Ura and Ohmori42 observed that when the samples were cooled to the TT of 1050 °C from a solution treatment temperature of 1350 °C and the cooling rate is lower than 10 °C/s, the RA of steels C and D increased by lowering the cooling rate. Both Nagasaki Reference Nagasaki, Aizawa and Kihara5 and Kobayashi Reference Kobayashi43 have experimentally confirmed that it is grain boundary segregation of S which induces loss in hot ductility. But, according to the theory of EGS, Reference Mclean44 the concentration of EGS increases and becomes constant at thermodynamic equilibrium, when the cooling rate decreases. Decreasing the cooling rate must deteriorate hot ductility of the steels. Thus, they are only a consequence of S TNGS.
Effect of cooling rate on the hot ductility of steels 3 and 4 in Kobayashi's study. Reference Kobayashi43

Variation of RA with cooling rate from solution-treated temperature to TT of tensile test, for two C–Mn steels solution treated at 1350 °C and tested at 1050 °C. Reference Yasumoto, Maehara, Ura and Ohmori42

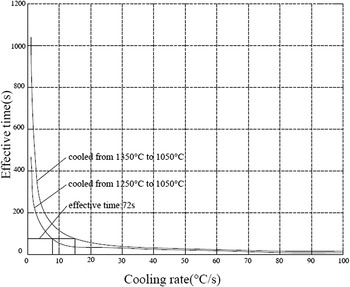
Figure 11 shows the calculated results of the effective time of S at 1050 °C with Eq. (5) when samples were cooled to 1050 °C from 1250 and 1350 °C, respectively. The average activation energy E A for diffusion of S–vacancy complexes in the matrix is equal to 1.85 eV, which is calculated by using the method described in Ref. Reference Song and Xu37. It can be seen that the effective time increases with the decreasing cooling rate. The horizontal line in Fig. 11 stands for the effective time of 72 s, which is the calculated results of critical time of S at 1050 °C in Sec. III. A. According to the theory of TNGS, the critical cooling rates of sulfur TNGS in C–Mn steels when the samples are cooled from 1350 and 1250 °C are about 15 and 8 °C/s, respectively.
The calculated results of the effective time of sulfur in C–Mn steel at 1050 °C with different cooling rates.

If the samples are cooled from 1250 °C at the faster rates than the critical cooling rate of 8 °C/s (shown in Fig. 9), the concentration of S segregation decreases and the reduction of area increases when the cooling rate increases. This explains that why reduction of area increases with increasing cooling rate shown in Fig. 9. If the samples are cooled from 1350 °C at the slower rates than the critical cooling rate of 15 °C/s (shown in Fig. 10), the concentration of S segregation increases and the reduction of area decreases when the cooling rate increases. This explains that why reduction of area decreases with increasing cooling rate shown in Fig. 10. As mentioned above, the critical cooling rate is the key for ductility loss.
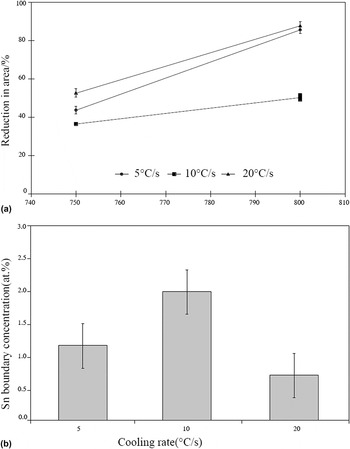
The critical cooling rate of TNGS and its effects on ductility of C–Mn steels were experimentally verified by Song et al. Reference Song, Yuan, Jia, Guo and Shen32 The Sn-doped C–Mn steels were solution treated at 1320 °C and cooled at 5, 10, and 20 °C/s, respectively, to different TTs from 700 to 900 °C, and held for 10 s, prior to tensile test. The ductility at different cooling rates is presented in Fig. 12(a). At the temperature of 750–800 °C, the ductility of the specimen cooled at an intermediate cooling rate of 10 °C/s is lower than that cooled at the other two cooling rates. The grain boundary segregation level of Sn for different cooling rates from 1320 °C to a TT of 750 °C is presented in Fig. 12(b). The segregation of Sn is highest at a cooling rate of 10 °C/s for the three cooling rates of 5, 10, and 20 °C/s. Thus, the critical cooling rate for Sn TNGS is responsible for the difference in hot ductility for different cooling rates, presented in Fig. 12. Reference Song, Yuan, Jia, Guo and Shen32
(a) Effect of cooling rate on the hot ductility of the Sn-doped steel. (b) The grain boundary concentration of Sn in specimens cooled at different cooling rates, determined by AES (bars represent standard deviation). Reference Song, Yuan, Jia, Guo and Shen32

The transverse cracking in continuously cast slabs is closely related to hot ductility loss during the straightening process. Reference Mintz, Yue and Jonas3 During continuous casting, there is a secondary cooling zone during which steels are continuously cooled prior to straightening. The TNGS critical cooling rate of impurity must be present in the continuously cooled slabs. Thus, controlling the cooling rate in secondary cooling zone to avoid the critical cooling rate of steels may be an effective method for improvement of surface quality of continuously cast slabs.
E. Complexes diffusion inducing cavities
Figure 13 shows SEM micrographs of intergranular fracture surface of C–Mn steel (0.06Mn–0.0209S) at different magnifications. Reference Kizu and Urabe29 The fracture surface is uneven with dimples at high magnification. About half of the dimples contained small particles, while in others no particles were present. The particles were analyzed by EDS and identified as (Fe, Mn)S.
SEM micrographs of the intergranular ruptured surface at a RA of 3% for C–Mn steel. RHT, TT, and Ht are 1573, 1273 K, and 300 s, respectively. Reference Kizu and Urabe29

According to the mechanism of TNGS, Reference Xu and Cheng10 the vacancies combine with S atoms to form complexes, which diffuse to grain boundaries to induce TNGS and voids. The following assumptions are made: (i) One complex contains statistically one vacancy and one solute atom; (ii) almost all the increase in solute and vacancy in the grain boundary region are produced by the diffusion of complexes to grain boundaries. Thus, the increase of vacancies induced by TNGS is equal to that of solute atom in Eq. 2 (Refs. Reference Xu and Song9–Reference Xu, Zheng, Wang and Misra11). As a consequence, an increase in vacancy through TNGS, above the equilibrium concentration, localizes at grain boundaries to form cavities. When TNGS occurs, the concentration of S increases and promotes the accumulation of (Fe, Mn)S in the center of the cavities.
A number of mechanisms have been proposed to describe the growth of cavities and loss in hot ductility. They can be classified as either cavity growth by deformation mechanisms or cavity growth by vacancy diffusion mechanisms. Reference Mintz, Yue and Jonas3 Kizu and Urabe Reference Kizu and Urabe29 considered that sulfur is segregated at grain boundaries, such that sulfides precipitate at grain boundaries, and a precipitation free zone (PFZ) is formed around the grain boundaries. When stress is applied, strain is localized around the grain boundaries, because PFZ is soft. Thus, when stress increases, microvoids are formed at precipitates present along the grain boundaries. When the voids coalesce, intergranular nonductile rupture occurs. Such a fact was ignored that many cavities are nucleated without precipitates at the TT. Reference Kizu and Urabe29 On the other hand, the specimens were deformed at a strain rate of 22 s−1 until final fracture occurs. At a high strain rate, it is difficult to nucleate microvoids. Thus, microvoids must be nucleated during the Ht of 300 s at each tensile temperature, prior to the start of tensile test. If the microvoids at crystal boundary are induced by deformation without the transformation of vacancies, the energy change can be calculated through grain boundary microvoid volume multiplied by applied stress. The energy change of the whole system caused by diffusion mechanism is equal to the difference in vacancy volume at grain boundaries and the matrix multiplied by applied stress. It is obvious that the energy change in the former is significantly higher than the latter. The formation of cavities at grain boundaries is realized in terms of diffusion of vacancies with low activation energy. Thus, the uneven fracture surface with dimples at an elevated TT was induced by the TNGS of S nucleating cavities rather than by the deformation.
IV. CONCLUSIONS
It is expressed in this paper that the hot ductility loss in C–M steels was mainly induced by the TNGS of impurity. The calculated results and the experimental evidence for the proposed mechanism are visited and discussed from the viewpoint of following five aspects:
-
(1) The ductility trough associated with loss in hot ductility is induced by the peak temperature of TNGS.
-
(2) The ductility healing effect in tensile test is induced by the critical time of TNGS.
-
(3) The effect of temperature difference of TNGS induces the effect of temperature difference on loss in hot ductility.
-
(4) The critical cooling rate of TNGS induces an effect of critical cooling rate on loss in hot ductility.
-
(5) The vacancy–solute complexes diffuse to grain boundaries and decompose there to form cavities and TNGS of impurity elements in C–Mn steels.
ACKNOWLEDGMENTS
The work was supported by the National Nature Science Foundation of China (Grant No. 51171050). R.D.K. Misra acknowledges support from Center for Structural and Functional Materials.