I. INTRODUCTION
The BaO–SnO2 binary system is known to have three compounds: BaSnO3, Ba3Sn2O7, and Ba2SnO4. The first of the three is the best known, most researched, and most useful. Barium stannate, BaSnO3, has a cubic perovskite structure.Reference Megaw1 It is the most widely used oxide for technological applications due to its dielectric properties, standing out as a capacitor, varistor, transparent electrocatalytic conductive electrode, and photovoltaic cell, in photocatalytic applications, and as a gas sensor.Reference Cerda, Arbiol, Dezanneau, Díaz and Morante2–Reference Zhigang and Gang4 Ceramic powders of BaSnO3 are usually obtained by a solid state reaction between BaCO3 and SnO2 at 1000–1400 °C.Reference Huang, Nakamura, Itoh, Inaguma and Ishiyama5,Reference Upadhyay, Parkash and Kumar6 Other techniques that have been used include hydrothermal,Reference Lu and Schmidt7,Reference Lu and Schmidt8 considering the effect of different solvents,Reference Lu and Schmidt9 sol–gel,Reference Lu and Schmidt10 self-heat-sustained route,Reference Azad, Shyan, Pang and Nee11 modified combustion,Reference Deep, Vidya, Manu, Solomon, John and Thomas12 and reverse micelle method.Reference Ahmed, Blakely, Bruno and Poltavets13
The interest in this perovskite is mainly due to the easy modification of its electrical properties and its stability at high temperatures. For gas sensing, BaSnO3 is a very promising material for high-temperature detection of gases,Reference Cerda, Arbiol, Dezanneau, Díaz and Morante2 particularly those gases generated in combustion processes. It has been reported that BaSnO3 has a 3.4 eV band gap, which is within the range generally desired for gas sensor materials.Reference Larramona, Gutierrez, Pereira, Nunes and Da Costa14,Reference Madou and Morrison15
In polycrystalline materials, it is widely accepted that barriers formed between particles or grains have a Schottky-type nature and this governs their electrical behavior. Adsorption of gaseous species at the grain boundaries can induce changes in barrier heights and in donor concentrations. Many oxide semiconductors are considered by the majority of researchers in the field to have a large number of oxygen vacancies, conferring their n-character. Barium stannate is an example of this.Reference Shimizu, Fukuyama, Narikiyo, Arari and Seiyama16,Reference Ostrick, Fleischer and Meixner17
It is known that oxygen is chemisorbed on the grain surface, increasing the barrier height and the width of surface barriers. This is a rapid process, so that equilibrium with atmospheric oxygen would be reached quickly. Subsequently, in the second process, it was found for metal oxide semiconductors that oxygen diffuses slowly into the grains (at temperatures above 200 °C), annihilating vacancies and reducing the donor concentration. Conversely, if oxygen diffuses out of the grains, vacancies are generated. Electron Spin Resonance measurementsReference Yamazoe, Fuchigami, Kishikawa and Seiyama18,Reference Chang19 indicate that adsorbed oxygen is responsible for the transfer of electrons from the grains to the chemisorbed oxygen. The relevant reactions from the gas phase to the bulk of the grain for oxygen areReference Yamazoe, Fuchigami, Kishikawa and Seiyama18:
 $${{\rm{O}}_{2\left( {{\rm{gas}}} \right)}} \leftrightarrow {{\rm{O}}_{2\left( {{\rm{ads}}} \right)}} \leftrightarrow {\rm{O}}_{{\rm{ads}}}^ - \leftrightarrow {\rm{O}}_{{\rm{ads}}}^{ - 2} \leftrightarrow {\rm{O}}_{{\rm{int}}}^{ - 2} \leftrightarrow {\rm{O}}_{{\rm{latt}}}^{ - 2}\quad ,$$
where O2(gas) refers to oxygen in the environment, O2(ads) to an oxygen molecule adsorbed at the grain surfaces,  ${\rm{O}}_{{\rm{ads}}}^ -$ and
 ${\rm{O}}_{{\rm{ads}}}^{ - 2}$ to singly and doubly ionized monatomic oxygen at the grain surface,
 ${\rm{O}}_{{\rm{int}}}^{ - 2}$ to interstitial oxygen, and
 ${\rm{O}}_{{\rm{latt}}}^{ - 2}$ to oxygen in the lattice.
The operating principle of this type of sensor is based on the comparison of the electrical resistance of a semiconductor oxide film in the presence of detectable gases (carbon monoxide and oxygen, in this case). The change in the resistance depends on the gas concentration and temperature. In this work, BaSnO3 thick films were made using the screen-printing method onto alumina substrates on which electrodes with an interdigitated shape were deposited by sputtering. Measurements of capacitance and resistance were used to characterize the intergranular potential barriers. Two different BaSnO3 synthesis methods were tested (controlled precipitation and Pechini) in search of films with a good response to CO. Electrical measurements showed that both methods have a similar temperature range of responses for CO and O2 but their sensitivities are different. The most interesting feature of films made with the Pechini method is that the maximum sensitivity is obtained at a lower temperature range for both gases than that previously reported.Reference Cerda, Arbiol, Dezanneau, Díaz and Morante2,Reference Lampe, Gerblinger and Meixner20
II. EXPERIMENTAL
To obtain BaSnO3 with the Pechini method, a mixture of ethylene glycol and citric acid was first heated to 70 °C, as indicated in a previous paper.Reference Ochoa-Muñoz, Ponce and Rodríguez-Páez21 The precursors C4H6BaO4 and SnCl2·2H2O, in the amounts 8.4 and 7.4 g, respectively, were added to the ethylene glycol and citric acid solution. At room temperature, the resulting solution was brought to a basic pH and heated to 140 °C, stirring constantly until a resin was formed. The resin was then precalcined at 350 °C and the precalcined material was heat treated within a range of temperatures (T ≤ 1000 °C) to obtain the BaSnO3. The powders obtained at the end of the synthesis processes were characterized by x-ray diffractograms (XRD) and SEM.
To obtain BaSnO3 by the controlled precipitation method, SnCl2·2H2O and C4H6BaO4 were used as precursors. These were dissolved separately in 0.1 M aqueous HNO3 solutions and the pH value was increased up to a basic pH by adding NH4OH. The obtained suspensions were then mixed and left to age for 24 h. Finally, the suspension was washed with an aqueous solution of diethylamine. The wet solid obtained was dried at 100 °C and subsequently treated at 1250 °C for 2 h. After the synthesis process, the powders were characterized using IR Spectroscopy, XRD and SEM (JEOL 5910LV; JEOL Ltd., Tokyo, Japan). To obtain the IR Spectrum, a Thermo Nicolet IR200 (Thermo Fisher Scientific, Pittsburgh, Pennsylvania) was used. The x-ray diffractograms were obtained using the X TEL-X-OMETER TEL-580 with a Cu source (λ = 1.54 Å) and a 30 kV voltage (Tel-Atomic, Jackson, Michigan).
A paste was then prepared using an organic binder (glycerol) and the powders were synthesized. Porous thick film samples were made by painting onto a 96% dense insulating alumina substrate and were placed in a vacuum chamber at its base pressure of 10−6 mm Hg. Electrodes of platinum or gold, with an interdigitated shape, were then deposited by sputtering. The electrode was a platinum 200 nm film and was deposited over a previously deposited 25 nm Ti layer.Reference Aldao, Schipani, Ponce, Joanni and Williams22 For defining the electrodes, the substrates with the metal films were placed in a homebuilt micromachining system with a 20 W, frequency tripled Nd:YVO4 laser (λ = 355 nm). The interelectrode distance was 20 μm. After painting, samples F p (Pechini sample) and F cp (controlled precipitation) were heat treated for 1 h in air at 100 °C. This treatment was carried out to evaporate the organic binder and to improve the film adhesion to the alumina substrate. Later, the samples were preheat treated up to 380 °C using a heating rate of 1 °C/min. The average thickness of the films was 0.1 mm. According to the geometry of our sensors, and taking into account that the electrical path in the interelectrode distance is shorter than that present everywhere else, an increase in the sensor thickness will only increase the response time, since it will take longer for gases to reach the interdigitated path.
The BaSnO3 film was placed in the sample holder cell of a static flow system (Fig. 1). The electrical conductivity behavior of the films, as function of temperature, was determined with a multimeter (Agilent 34401A; Keysight Technologies, Palo Alto, California). Conductivity versus temperature measurements were carried out (for the F p and F cp films) raising and then decreasing the temperature of the samples in the range 25–200 °C at a rate of ∼1 °C/min with the sample first kept in vacuum (10−4 mm Hg). To gain confidence in sensor properties, resistance (at 20 Hz) versus time curves were measured while changing the vacuum (10−4 mm Hg) to an O2 or CO atmosphere (at different O2 and CO concentrations of 2, 4, 6, 8, 10, 20, and 40 mm Hg) and, after having reached quasisaturation, impedance was measured in a frequency interval of 20 Hz–1 MHz using an impedance analyzer HP4284A. Later, the samples were exposed again to vacuum. The sensitivity of the BaSnO3 films was determined from 230 to 540 °C. It was calculated as, the resistance of the sensors in a gaseous atmosphere divided by their resistance in vacuum.
Diagram of the equipment used to determine the gas sensing capacity of sensing films.

III. CHARACTERIZATION OF SYNTHESIZED POWDERS
A. XRD measurements
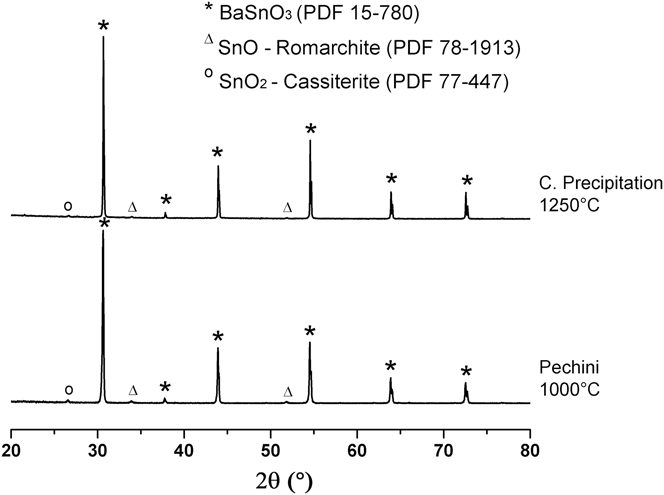
The diffractograms of Fig. 2 correspond to the solids obtained with the Pechini method, treated at 1000 °C, and to the samples obtained by controlled precipitation method, treated at 1250 °C for 2 h, since for treatments below 1000 °C these samples have primarily the crystalline phase of SnO2 but, when treated at higher temperatures, specifically at 1250 °C, crystallization yields pure BaSnO3 as the main phase.Reference Ochoa-Muñoz, Ponce and Rodríguez-Páez21 Both samples show BaSnO3 (PDF 15-780) as the main crystalline phase.
XRD diffractograms of Ba–Sn system solid samples synthesized by the controlled precipitation and the Pechini methods, heat treated at 1250 and 1000 °C, respectively, for 2 h.
B. SEM images
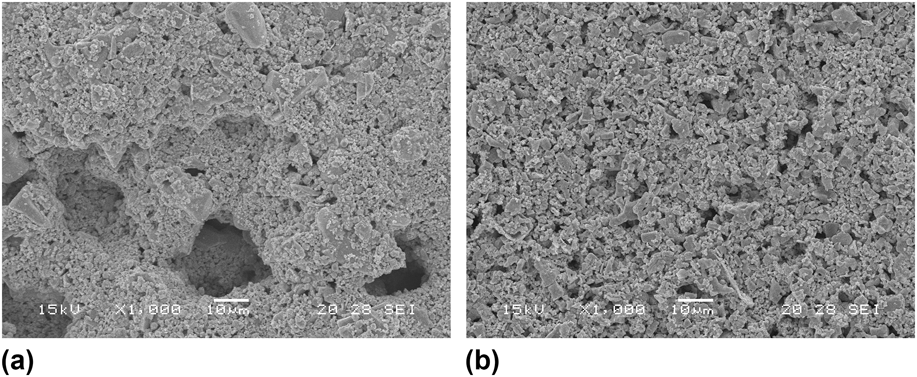
Figure 3 shows SEM micrographs corresponding to BaSnO3 thick films formed with ceramic powders obtained using controlled precipitation (a), and the Pechini method (b). Both samples were heat treated at 380 °C. In the case of the F cp film there is a very wide distribution in the grain size, and the images demonstrate the presence of grains larger than 5 μm [Fig. 3(a)]. With the F p film, the grains are more uniform in grain size [Fig. 3(b)]. It can also be seen that the F cp film has a grain size of ∼3.5 μm, greater than the ∼1.5 μm for the F p film.
SEM photographs of BaSnO3 thick porous films at different magnifications. (a) F cp film and (b) F p film. Both films were made by the screen printing technique.
C. Fourier transform infrared spectroscopy (FTIR)
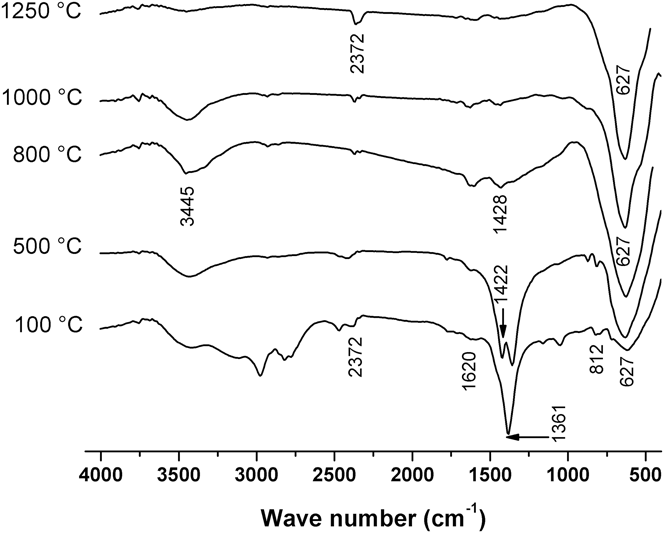
To obtain information on the evolution of the functional groups during crystallization of the ceramic powder, the dry powders from each synthesis method were characterized using IR spectroscopy. Figure 4 shows IR spectra corresponding to samples obtained by the controlled precipitation method, heat treated at 100, 500, 800, 1000, and 1250 °C. The results indicate the presence of hydroxyls in the solid, bands around 3445 cm−1 showing the presence of absorbed water in the samples, and  ${\rm{N}}{{\rm{O}}_3}^ -$, a band located at 1361–1395 cm−1.Reference Ochoa-Muñoz, Ponce and Rodríguez-Páez21,Reference Socrates23 The most evident band is that located at ∼630 cm−1, corresponding to a vibrational mode of the Sn–O group of the
 ${\rm{Sn}}{{\rm{O}}_{\rm{3}}}^{2 - }$,Reference Ochoa-Muñoz, Ponce and Rodríguez-Páez21,Reference Amalric-Popescu and Bozon-Verduraz24 and that might be used to demonstrate the existence of BaSnO3. The band at 1422 cm−1 is associated with BaCO3,Reference Ochoa-Muñoz, Ponce and Rodríguez-Páez21,Reference Socrates23,Reference Nakamato25 so that its intensity decreased at high temperatures. This band appeared in most of the spectra indicating that the BaCO3 was found in the samples as an unwanted additional phase, which was required to be removed.
IR spectra corresponding to solid samples of the SnCl2–Ba(CH3COO)2–H2O–NH4OH system, controlled precipitation method, heat treated at different temperatures.Reference Ochoa-Muñoz, Ponce and Rodríguez-Páez21
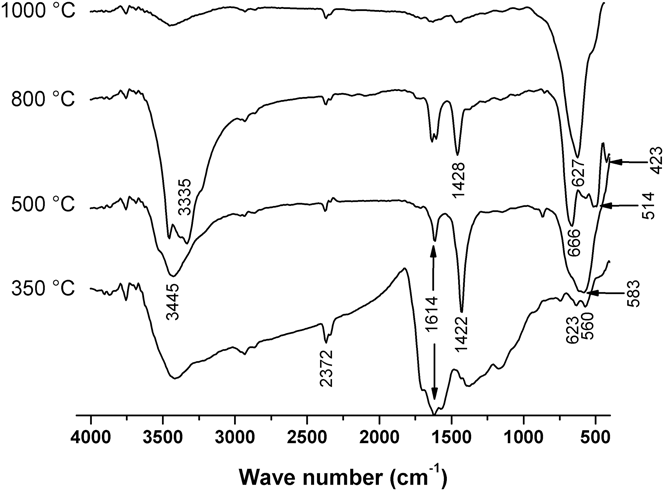
Figure 5 shows the IR spectra corresponding to solid samples obtained by the Pechini method, calcined at 350 °C and then heat treated at 500–1000 °C. The spectra show a band at 3440 cm−1 that can be attributed to the vibrational mode of the tension in the H–OH, while the band at 1630 cm−1 corresponds to the flexing mode of the water. The band at 1430 cm−1 may be associated with the vibration of residual organic C–H groups.Reference Socrates23,Reference Nakamato25 The band at ∼630 cm−1 seen in the spectra corresponds to Sn–O.Reference Amalric-Popescu and Bozon-Verduraz24 This band, considered to be a characteristic of BaSnO3, is most evident in the treatment at 1000 °C.
IR spectra corresponding to solid samples of the SnCl2–Ba(CH3COO)2–H2O–NH4OH system, Pechini method, heat treated at different temperatures.
IV. MEASUREMENTS AND RESULTS
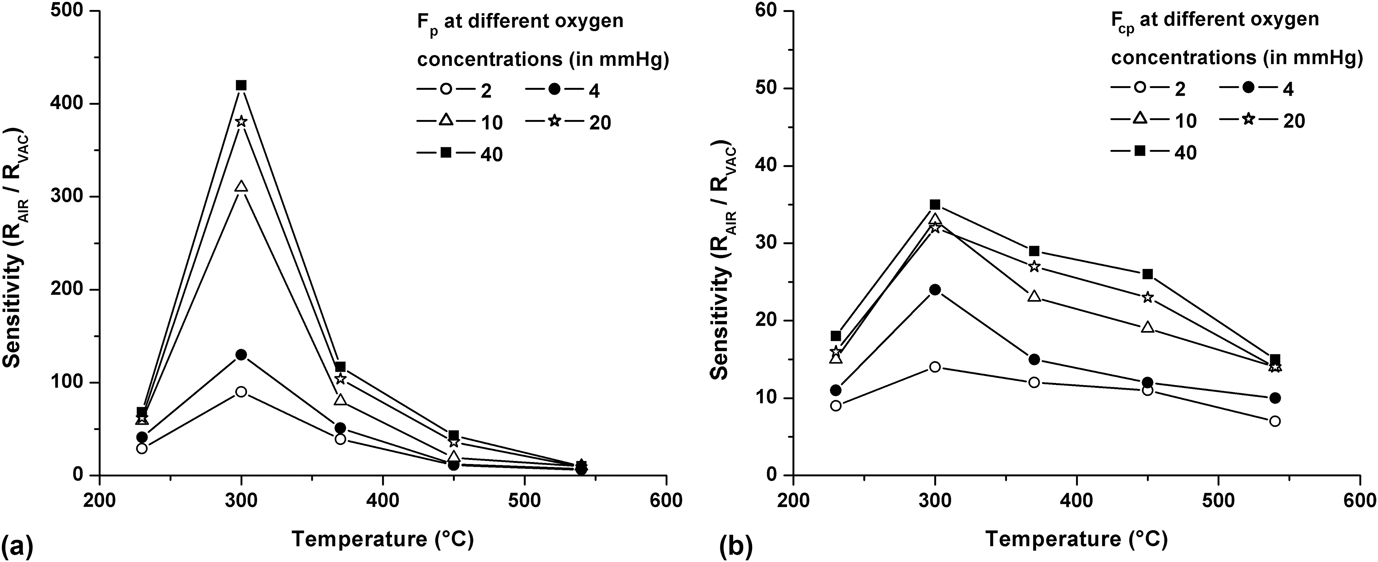
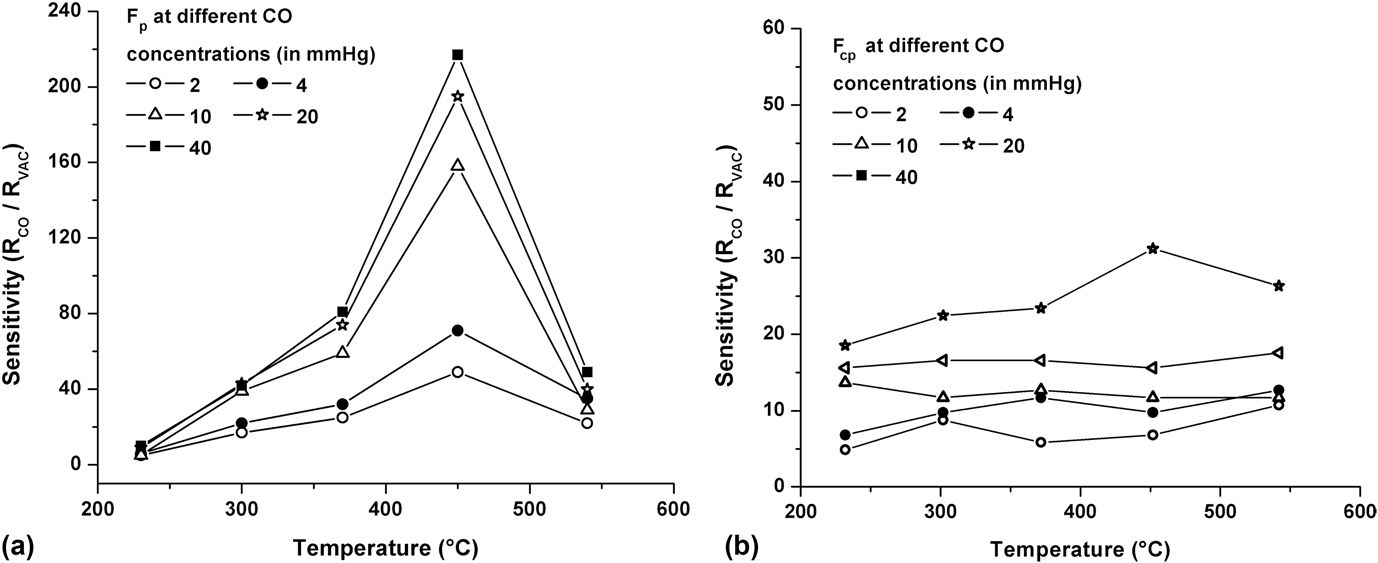
The sensitivity of BaSnO3 thick films was determined from 230 to 540 °C. Sensitivity was calculated as, the resistance of the sensors in a gaseous atmosphere divided by their resistance in a vacuum. The concentrations of O2 and CO were varied between 2 and 40 mm Hg for both types of samples, F p and F cp. No further changes in the electrical behavior were found during exposure to gas concentrations greater than 40 mm Hg, thus 40 mm Hg was chosen to be the highest concentration studied. Figures 6 and 7 show the sensitivity of the sensors to O2 and CO, respectively. Although, both samples show a good sensitivity to O2 at 300 °C, F p presents a better response (an order of magnitude greater than that of F cp). For the F p samples the sensitivity increases with the gas concentration in the range of 230–540 °C.
Sensitivity curves of different oxygen concentrations, (a) F p film and (b) F cp film.
Sensitivity curves for different CO concentrations, (a) F p film and (b) F cp film.
From Fig. 6, we can conclude that the films made with powders obtained using the Pechini method present a better reproducibility, while the best operating temperature, for oxygen detection, is around 300 °C. This represents a notable difference found with respect to other authors who have reported higher temperatures for maximum sensitivity to O2.Reference Cerda, Arbiol, Dezanneau, Díaz and Morante2,Reference Aldao, Schipani, Ponce, Joanni and Williams22
To analyze the electrical behavior of the F p samples, it will be assumed, as is generally accepted, that barrier formation between grains is responsible for sensor conductivity and that these barriers have a Schottky-type nature. As a first approach, for barrier height calculations, researchers have regularly considered a thermionic mechanism that leads to a conductivity of the type
 $$G = {G_0}\,{\rm{exp}}\left( {{{e\varphi } \mathord{\left/ {\vphantom {{e\varphi } {kT}}} \right. \kern-\nulldelimiterspace} {kT}}} \right)\quad ,$$
where eφ is the barrier height, T is the temperature, and k is the Boltzmann constant. This equation reflects an activated process due to intergranular barriers. As is commonly done, barrier height is estimated by plotting conductance (ln G) versus the reverse function of temperature (1/T). Thus, an activation energy (E a) can be obtained from the slope of a fitting straight line.
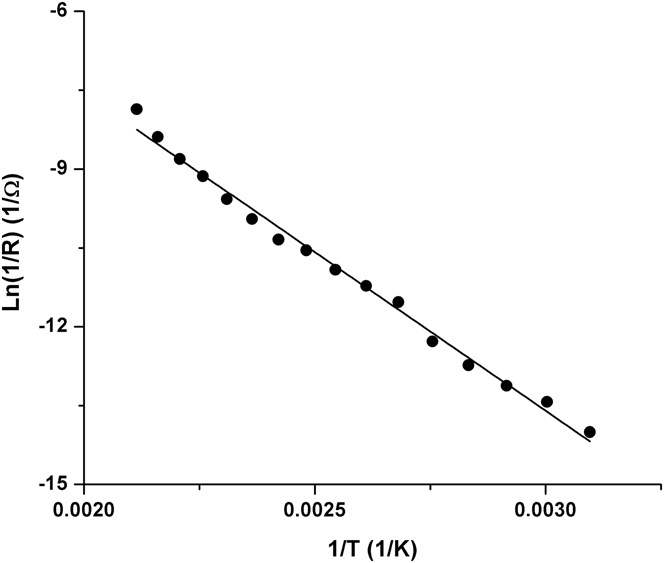
Figure 8 shows the conductance in vacuum conditions of F p samples versus the inverse of temperature, in cycling experiments. Specifically, conductance was measured by raising and then decreasing the temperature in vacuum, reaching about 200 °C. In this temperature range, the room temperature conductance value is recovered after the cycle implying that no oxygen adsorption/desorption takes place during the heating and cooling processes.
Arrhenius plot for conductivity of the film in vacuum. The sample was heated to 200 °C and then cooled in vacuum to ensure no diffusion into the grains. An effective activation energy of 0.52 eV was calculated.
At high enough working temperatures, gas in–out diffusion can take place.Reference Batzill and Diebold26 Indeed, it has been detected by the authors in previous works that an oxygen rich atmosphere alters the density of vacancies in tin oxide for temperatures greater than 300 °C.Reference Ponce, Aldao and Castro27–Reference Malagu, Carotta, Giberti, Guidi, Martinelli, Ponce, Castro and Aldao29 As a result of this diffusion process, the density of vacancies changes and from this point the slope of the conductivity curve can no longer be associated with the barrier height.Reference Schipani, Aldao and Ponce30,Reference Ponce, Castro and Aldao31 Accordingly, the effective activation energy obtained was  ${E_{{F_{\rm{p}}}}} = 0.52\;{\rm{eV}}$ for the F p sample. The activation energy value was found with the sample in vacuum and considering that (i) no gas adsorption/desorption takes place during the heating and cooling processes, and that (ii) no oxygen diffusion into or out of the grains occurs during the heating or cooling within the temperature range of the study.
For nonoverlapped potential barriers, the intergrain capacitance is that of two Schottky barriers in series. In a one-dimensional approximation, the resulting capacitance when barriers are nonoverlapped, C no, related to that corresponding to a sample with overlapped barriers, C o, can be expressed as
 $${{{C_{{\rm{no}}}}} \over {{C_{\rm{o}}}}} = {z \over {2\Lambda }}\quad ,$$
where z is the grain size and Λ is the depletion layer width. This capacitance enlargement can be interpreted, using Eq. (3), as the consequence of depletion widths that are narrower than the grain radius due to a higher doping.
To gain confidence in the present studies, capacitance measurements were carried out at 550 °C in an oxygen atmosphere and in vacuum. An atmosphere rich in oxygen will decrease the amount of oxygen vacancies, widening the potential barriers. This can lead to overlapped potential barriers. In this case, capacitance is lower and has a mild dependence with bias, as observed. Thus, from Eq. (3) and for an average grain size of 1 µm, the depletion layer can be estimated as
 $$\Lambda = {z \over 2}\left( {{{{C_{\rm{o}}}} \over {{C_{{\rm{no}}}}}}} \right) \cong 1.63 \times {10^{ - 7}}\;{\rm{m}}\quad {\rm{.}}$$
On the other hand, in a Schottky barrier, the height (ϕ) and width (Λ) are directly relatedReference Sze32,Reference Kao33 :
 $$\phi = {{e{N_{\rm{d}}}} \over {2\varepsilon }}{\Lambda ^2}\quad ,$$
where N d is the donor density. Using the activation energy previously calculated and the depletion layer width, donor density can be estimated, N d = 3.9 × 10²² 1/m3.
The conductance under vacuum was measured for F cp samples. The conductance of the sample was much lower compared to that of F p; this is not expected as grains are three times bigger on average than in the F p sample, so the conductance should have been higher. We present below a possible explanation for this finding. Even so, samples F p and F cp were both exposed to a CO atmosphere. Only films formed using powders obtained with the Pechini method (F p) responded appreciably to CO. The maximum sensitivity was reached at different times, depending on the working temperature. The response time at the highest sensitivity point was reached in 3–4 min.
To analyze the sensor behavior when samples were exposed to a CO atmosphere, measurements with different concentrations were obtained for samples F p and F cp from 230 to 540 °C. In the following step, CO (from 2 to 40 mm Hg) was incorporated into the gas chamber. Only the samples prepared using the Pechini method presented an appreciable sensitivity and reproducible responses. The maximum sensitivity value was detected at 450 °C with no change for CO concentrations greater than 40 mm Hg.
It is known that carbon monoxide reacts with the oxygen adsorbed on the tin oxide surface according to these equations,Reference Ponce, Malagu, Carotta, Martinelli and Aldao34
 $${{\rm{O}}_2}\left( {\rm{g}} \right) + 2( \equiv {\rm{S}}) + 2{\rm{e'}} \leftrightarrow 2{{\rm{O'}}_{{\rm{ads}}}}\quad ,$$
 $${{\rm{O'}}_{{\rm{ads}}}} + {\rm{CO}}\left( {\rm{g}} \right) \leftrightarrow {\rm{C}}{{\rm{O}}_{{\rm{2ads}}}} + {\rm{e'}}\quad {\rm{,}}$$
 $${\rm{C}}{{\rm{O}}_{{\rm{2ads}}}} \leftrightarrow {\rm{C}}{{\rm{O}}_2}\left( {\rm{g}} \right) + ( \equiv {\rm{S}})\quad ,$$
where (≡S) corresponds to a site on the surface where oxygen can be adsorbed. This reduction in the amount of oxygen makes the sample conductivity higher. This means that the barrier height and the depletion width (Λ) decrease if oxygen is previously adsorbed on the surface.
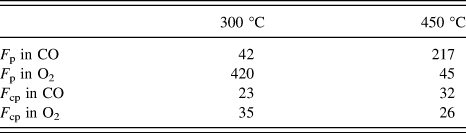
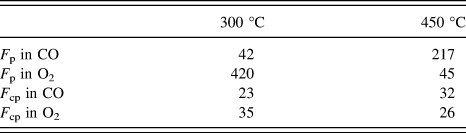
In Table I, a clear distinction can be seen between sensitivities corresponding to F p and F cp samples. For the Pechini-made films (F p), the high sensor response to oxygen at 300 °C contrasts with the low response to CO at that temperature. Conversely, at 450 °C the high sensitivity is observed to CO and the low one to oxygen. The F cp sensor meanwhile shows almost no difference in sensitivity between gases at these temperatures. This lack of selectivity and low sensitivity could be explained taking account of the fact that the controlled precipitation, having a 3.5 μm average grain size, could not allow grain boundaries to reach complete equilibrium with the atmosphere, even at the highest temperatures. Oxygen could not in/out-diffuse to reach the grain boundary completely, in a way that the inner part of the interface would remain unaltered in spite of a changing atmosphere. This “trapped oxygen” hypothesis can also explain the lower conductance of the F cp sample.
Sensitivity comparison between F p and F cp samples at 40 mm Hg of oxygen and CO.
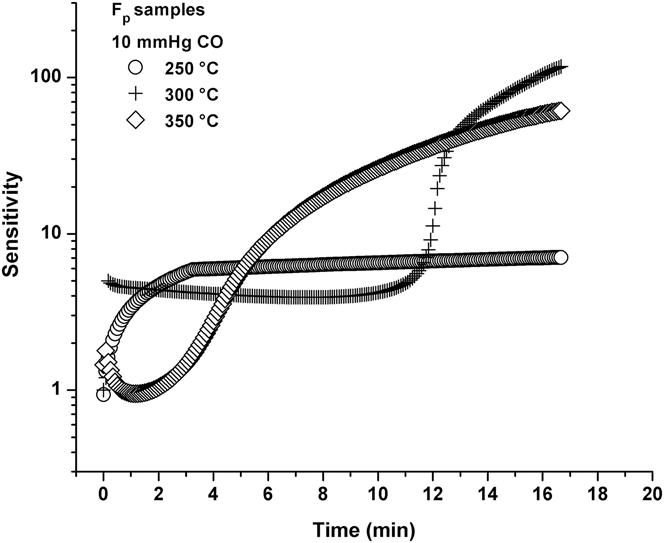
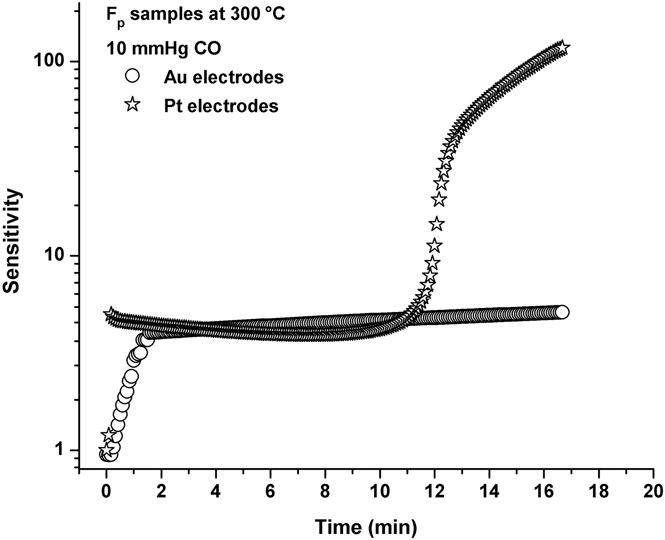
Interestingly, an anomalous response was found at temperatures greater than 250 °C for F p samples exposed to CO. A great increase in the electrical resistance value for exposure times greater than 10 min was observed, as shown in Fig. 9. This striking resistance response could be due to a catalytic reaction of CO produced by the platinum in contact with the film. To test this hypothesis, substrates with Au contacts were prepared by following the same procedure as that used for Pt contacts. The anomalous effect was not found in samples prepared with Au contacts (Fig. 10).
Sensitivity curves at three different temperatures for F p samples with platinum electrodes. This anomalous effect was observed above 250 °C at all CO concentrations tested. At 300 °C, the film resistance remains almost constant for 10 min, and then it increases very rapidly.
Sensitivity curves of F p samples with gold and platinum electrodes. The anomalous response only appears when platinum electrodes are used.
During the CO exposure for Au electrodes, no changes in the resistance were found for films prepared with either the controlled precipitation method or the Pechini method. Figure 10 shows the electrical resistance behavior when F p samples (interdigitated electrodes of Au and Pt) were exposed to 10 mm Hg at 300 °C.
V. CONCLUSIONS
In this work, BaSnO3 powders were obtained using two different methods, Pechini and controlled precipitation. BaSnO3 grains obtained with the controlled precipitation method were larger than the grains obtained with Pechini's method. Powders were screen printed on substrates and tested as gas sensors. Both films showed the maximum sensitivity to oxygen at the same temperature, but the response to oxygen was stronger for films obtained using Pechini powders. The electrical resistance of the controlled precipitation films (F cp) was consistently higher than for Pechini's method films (F p). This could be a consequence of the trapped oxygen in the interfaces that could not diffuse out of the grains. The use of the Arrhenius equation and impedance spectroscopy measurements permits to obtain the barrier height and the donor concentration in a vacuum atmosphere.
Regarding the response to carbon monoxide, only films prepared with the Pechini method had an appreciable sensitivity. It can be concluded that samples prepared with the Pechini method perform better as CO and oxygen sensors. It is important to note that the maximum gas response with the F p samples was reached at 300 °C for oxygen and 450 °C for carbon monoxide. These temperatures are lower than those reported by other authors. Using sputtered platinum as interdigitated electrodes, an enhancement in the CO response was observed.
ACKNOWLEDGMENTS
We are grateful to the VRI of the University of Cauca for the funding of project ID 3587 and for providing logistical support. We are also grateful to Colin McLachlan for suggestions relating to the English text.