1. INTRODUCTION
In real-time kinematic (RTK) systems and space/ground-based GPS augmentation systems (SBAS/GBAS, respectively), it is common to find a third-order digital phase-lock loop (DPLL) along with a frequency-lock loop (FLL), also known as automatic frequency control (AFC). Without interruption, third-order phase-lock loops (PLLs) can track the residual phase and rate, while FLLs support acquisition, data synchronization, and reacquisition. An FLL can also track phase acceleration and jerk, or equivalently frequency rate and acceleration. The steady-state phase-error trajectory of third- or even higher-order analogue and digital PLLs has been well developed (Stephens, Reference Stephens2002), (van Dierendonck, Reference Van Dierendonck1996). However, the non-linear high-order DPLL behaviours such as cycle slips and acquisition are still difficult to model and their design and analysis require intense computer simulations. Importantly, it has been shown that using the fixed-point theorem and numerical computer evaluation, the second- and third-order DPLLs have inherent differences from analogue PLLs, such that DPLLs could cycle slip indefinitely for certain initial phase offsets while there are gain-dependent limitations to the frequency offsets (Osborne, Reference Osborne1980). These restrictions of higher-order DPLLs that cannot detect frequency ramps or acceleration by themselves imply the necessity of on-line monitoring of DPLL residual phase trajectory using an FLL or other external aid, such as an inertial navigation system (INS) that can survive various loop stress conditions.
Costas and conventional PLLs are both sensitive to dynamic stress and frequency error while providing more accurate measurements than either a delay-lock loop (DLL) or an FLL (Ward et al., Reference Ward, Betz and Hegarty2006). For high-precision differential RTK receivers, it is important to detect cycle slips quickly to resolve cycle ambiguities. For safety-of-life GNSS receivers, it is advantageous to distinguish harmful PLL cycle losses from cycle slips, because PLL cycle losses mislead the carrier-aided code tracking beyond the recoverable DLL correlation limit. Upon detecting a PLL cycle loss, the carrier-aided code tracking should stop and another available estimate from a carefully calibrated external carrier must assist the DLL before the carrier-phase tracking can resume. Tracking thresholds for DLLs are usually more than 3dB higher than those for PLLs, such that DLLs can maintain a lock through carrier cycle slips unless a channel has a very low signal-to-noise ratio (SNR).
However, the robust real-time detection of carrier cycle slip and loss remains a challenge in a single-frequency stand-alone GNSS receiver design. There have been numerous studies of robust signal tracking and cycle slip detection. For Wide Area Augmentation System (WAAS) carrier tracking, a modified FLL scheme was proposed such that it improves WAAS carrier tracking to at least as good as a PLL, yet retains the superior dynamic tracking capabilities of FLLs (McGraw and Schnaufer, Reference McGraw and Schnaufer1995). The effect of ionospheric scintillation, one of the main sources of instantaneous cycle slip, on tracking performance was analysed (Humphreys et al., Reference Humphreys, Psiaki, Kintner and Ledvina2005) and a mitigation method by applying adaptive tracking loop bandwidth was proposed (Ganguly et al., Reference Ganguly, Jovancevic, Brown, Kirchner, Zigic, Beach and Groves2004), (Skone et al., Reference Skone, Lachapelle, Yao, Yu and Watson2005). For cycle slip detection methods, many studies using L1/L2 dual-frequency measurements or/and inertial navigation system (INS) were proposed (Hofmann-Wellenhof et al., Reference Hofmann-Wellenhof, Lichtenegger and Collins1994, p204), (Lee et al., Reference Lee, Wang and Rizos2003). Most cycle slip detection methods of single-frequency stand-alone GPS use carrier phase tracking error as an observable (Tateishi, Reference Tateishi1998). A method of cycle slip detection and estimation by watching the magnitude and shape of filtered phase error has been proposed (Thuringer and McGraw, Reference Thuringer and McGraw2001).
We develop the on-line robust detection of third-order DPLL cycle slip and loss in Costas loop formation (50 Hz GPS L1 C/A code demodulation). The original design objective is to provide safety-of-life aviation users with timely integrity alerts of irrecoverable cycle losses. Our method of detecting PLL cycle slip is based on frequency tracking error, not on the phase error that the common approaches use. We found that derivatives of frequency error could indicate the occurrence of cycle slip in carrier-phase tracking and the use of frequency error from FLL could take advantage of robust tracking performance of FLL. We use the moving average (MA) of frequency error time derivatives as a detection parameter. Some previous studies used filters on carrier phase error, but the filtering effect could cause group delay (Müller, Reference Müller1998). Our approach could compensate for the delay. We also develop combined cycle slip and loss detection by FLL. The supporting statistical analysis and the detection threshold decision criteria are provided. The cost-effective sharing of PLL and FLL accumulators is considered to simplify and enable pre-determinable detection threshold logic without calculating floating thresholds for easier integrity certification and integer ambiguity resolution. The loop stress environments include low C/N0 for the GPS L1 C/A code, airborne platform dynamics, and simulated ionospheric scintillation signal models that support SBAS PLL noise bandwidth analysis.
2. DIGITAL PLL AND FLL IMPLEMENTATIONS FOR SIMULATION
In this research, we implemented the joint construction of a PLL and an FLL. The PLL was ordinarily used for carrier tracking and the FLL was used for cycle slip detection and for substitution of the PLL when the PLL lost its tracking lock. This construction could be useful for continuous carrier tracking by changing the PLL to an FLL when the PLL could not work properly because of its weakness to noise. In this section, the PLL and FLL implementations used for the cycle slip detection are described.
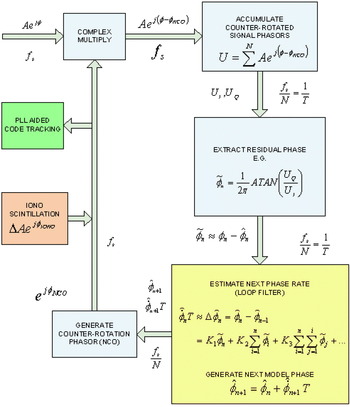
The PLL compares the phases of two signals and produces an error signal that is proportional to the difference between the two phases, while the FLL does for the frequencies what the PLL does for the phases. Because the multiplier beats the signal input and the voltage-controlled oscillator (VCO), or the numerically controlled oscillator (NCO) in a digital implementation, a low-frequency output proportional to the sine of the difference between the incoming and internal V/NCO-generated phase can be tracked. However, it is well known that the desired performance of such loops deteriorates rapidly if either the signal or the noise levels differ from the design levels, and if no compensating changes are made in the loop. This results in the modernized AGC design followed by a filter that holds the signal at a constant level. Assuming AGC and well-designed analogue-to-digital conversion (ADC) circuitry with small implementation loss, Figure 1 illustrates a high-level description of digital PLL (DPLL) analysis (Stephens and Thomas, Reference Stephens and Thomas1995). In addition, the figure includes the ionospheric scintillation signal model and the aiding output for carrier-aided code tracking that are analysed together in the cycle slip and loss detection described in this paper.
High-level illustration of DPLL with phase/frequency updates and no computation delay (Stephens and Thomas, Reference Stephens and Thomas1995).

As shown in Figure 1, the residual phase in unit of cycles and its estimate from an arctan discriminator can be described as:
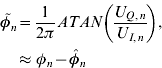
where:
ɸn: nth phase of incoming signal
 : nth phase estimate
- : nth residual phase
U I,n, U Q,n: nth accumulator in-phase and quad-phase outputs, respectively
 : nth phase estimate
A conventional DPLL loop filter uses the residual phase  to estimate the next (n+1)th phase or phase rate estimate by:

where:
T: update interval
- : phase change per update interval T
n c: computation delay
K 1, K 2, K 3: loop coefficients
 : phase change per update interval T
Our simulation assumed that the incoming signal is sampled in quadrature at a Nyquist sampling rate (f s) of the GPS L1 C/A signal at 40 MHz. The NCO models a phasor with its phase projected by a loop filter to counter-rotate the incoming signal, later contaminated by an ionospheric scintillation signal in amplitude attenuation ratio ΔA and phase delay in ɸIONO. In each delay lag, N complex samples for an accumulator interval T are gathered before input to a phase discriminator. Here, the quadratic atan function is shown, but sine and other nonlinear functions are also available (Ward et al., Reference Ward, Betz and Hegarty2006).
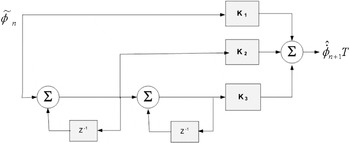
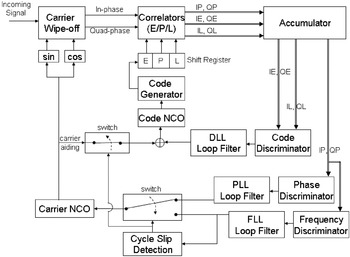
A simplified third-order DPLL loop filter description is shown in Figure 2. We used 10 Hz loop bandwidth to simulate an aviation user. The joint implementation of a second-order DPLL and first-order FLL with cycle slip detection logic and selection switch is shown in Figure 3. For code tracking, a selectable carrier-aided DLL was implemented.

Joint implementation of second-order DPLL and first-order FLL with cycle slip detection logic and selectable carrier-aided DLL.

3. SIMULATION OF CYCLE SLIP AND LOSS
To simulate the occurrence of cycle slip, a simulated noisy signal was generated by applying an ionospheric scintillation effect. Ionospheric scintillation, deep gradient changes and multipath have been continual challenges for satellite-based navigation and communication systems (Walter et al., Reference Walter, Datta-Baruna, Blanch and Enge2004). Their effects on the signal can be expressed as amplitude fading and phase fluctuation (Skone et al., Reference Skone, Lachapelle, Yao, Yu and Watson2005). Amplitude scintillation is characterized by the parameter S 4 in Equation (3) below, where I=(ΔA)2 is the intensity parameter of the multiplicative scintillation signal ΔAe jɸ to the received GPS signal, as shown in Figure 1.
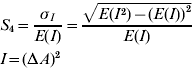
where:
I: intensity parameter
ΔA: fluctuation of signal amplitude caused by scintillation.
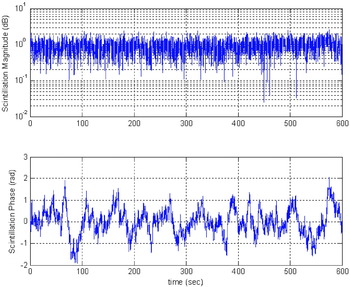
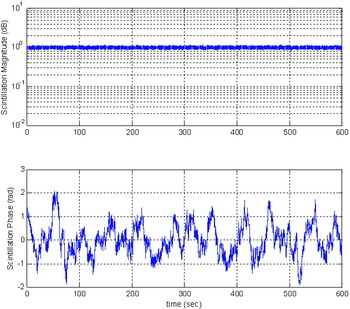
Phase scintillation is modelled as a Gaussian distribution with zero mean. The standard deviation of the phase fluctuation σɸ is used as a phase scintillation parameter. Both amplitude and phase scintillation follow a power-law, coloured-noise power spectral density (Kim et al., Reference Kim, Conker, El-Arini, Ericson, Hegarty and Tran2003). In this paper, two strong scintillation simulation datasets were used. They were generated using a frequency-domain power-law simulation that matched theoretical results well. The first dataset is strong in both amplitude and phase (S 4=0·75 and σɸ=0·6) fading as shown in Figure 4, while the second dataset is strong only in phase scintillation (S 4=0·1 and σɸ=0·65) as shown in Figure 5.
Simulated strong amplitude fading (upper plot in dB) and phase fluctuation scintillation (lower plot in radians) signals (S4=0·75 and σɸ=0·6).

Simulated amplitude fading (upper plot in dB) and phase fluctuation scintillation (lower plot in radians) signals (S4=0·1 and σɸ=0·65).

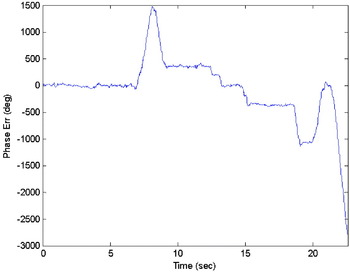
The scintillation signal examples in Figures 4 and 5 generated in 50 Hz are complex-multiplied with the simulated L1 C/A code at the rate of 40 MHz for 600 seconds while a single GPS satellite motion-induced range, Doppler, and rates at the L1 C/A frequency are simulated. Using a noise bandwidth B L of 10 Hz, various integration and dump times were tested including T=10 ms (i.e., B LT=0·1), while various carrier-to-noise (C/N0) levels were simulated. Figure 6 shows a series of simulated third-order Costas DPLL tracking results using the simulated signal. It shows recoverable cycle slips followed by an irrecoverable cycle loss at approximately 20 s in the strong scintillation simulation. The strong scintillation example in Figure 6 shows that part of the simulation occurs at the 30 dB-Hz C/N0 low-signal margin level. This case provides a useful combination of multiple recoverable cycle slips before irrecoverable cycle loss occurs within the 600 s simulation window. It is noteworthy that the cycle slip and loss behaviour at the low C/N0 level of 26 dB-Hz without the scintillation effects shows a very similar cycle slip and loss behaviour in Figure 6. This limited number of simulations indicates that the robust cycle slip detection of low C/N0 signals is feasible, based on the same moving average of FLL output methods described in the following section.
Cycle slip and loss simulation of third-order Costas DPLL at C/N0=30 dB-Hz using simulated scintillation signal.

4. CYCLE SLIP DETECTION USING FLL MOVING AVERAGE (MA)
4.1. The Concept of FLL Moving Average
As noted earlier, a third-order DPLL cannot detect frequency ramp or acceleration. Therefore, an FLL is implemented in parallel to detect DPLL phase tracking losses and substitute for the DPLL when cycle loss occurs. We developed a cycle slip detection scheme using the FLL loop filter output. The FLL outputs are shown in Equations (4) and (5) below. Equation (4) shows the residual frequency of the FLL that is the output from the frequency discriminator. The residual frequency is connected to the first derivative of the residual phase.
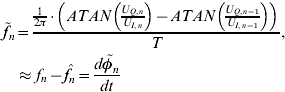
where:
- : residual frequency (Hz)
f n: frequency of incoming signal (Hz)
- : frequency estimate (Hz)
 : residual frequency (Hz)
 : frequency estimate (Hz)
Using the residual, the first-order FLL loop filter was used to derive the estimated frequency error using Equation (5). It is named the FLL output in this paper.
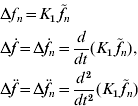
where:
Δf n: estimated frequency error (FLL output)
Δḟ: first-order FLL output
- : second-order FLL output
K 1: FLL loop filter coefficient
We found that the derivatives of the FLL output indicate the status of carrier phase tracking. To use them as cycle slip and loss detection observables, a moving average of their absolute values was taken. These observables allow detection and discrimination of cycle slip and losses.
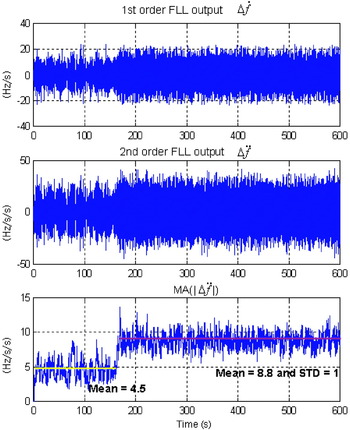
The observables are shown in Figure 7. Figure 7 (top) shows that the first-order FLL output representing the frequency ramp Δḟ under scintillation stress is very noisy. However, it indicates that when irrecoverable cycle loss occurred at approximately 160 s into this simulation, the envelope of the first-order FLL output clearly increased and stayed fixed at about ±20 Hz/s thereafter. Figure 7 (centre) shows the output of the second-order FLL output and reveals a similar pattern. As the second-order FLL output measures the frequency acceleration  , it is not surprising that a relatively sharper envelope ramp appears than that of the first-order FLL output at 160 s. Note that the 1 second moving average is equivalent to 100 10 ms samples in this simulation. The DPLL divergence detection can be faster, as shown in Figure 7 (bottom), where the envelope is sharper. The mean value of
 before the cycle loss was 4·5 while the mean value of after the cycle loss was higher, at 8·8 with a standard deviation of about 1. The absolute value was chosen as a reasonable approximation to the envelope ramp detection while being easy to implement in sign-bit number notation in the microprocessor.
Cycle slip detection: first-order FLL (top), second-order FLL (centre), and 1 s moving average of second-order FLL (bottom).

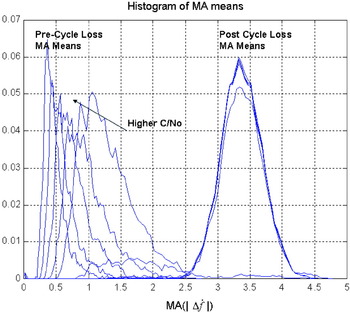
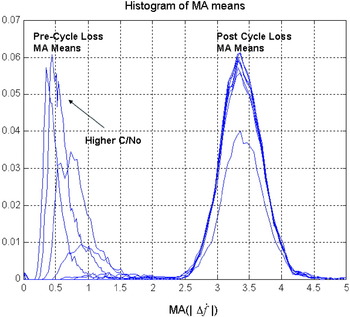
We tested the robustness of the moving average (MA) detection scheme under various C/N0 values and aviation dynamics, and under both amplitude-intensive and phase-intensive scintillation conditions. We found that the moving-average behaviour of |Δḟ| and after a divergence provide very similar discriminating factors, therefore the simpler |Δḟ| measurement statistics were used, as shown in Figure 8. In Figure 8, the histogram is the overlay of 1 second MA mean values of |Δḟ| over C/N0 in {28, 30, 32, 34, 36} dB-Hz. It is clear that the MA means of pre-cycle loss are clustered on the left side regardless of C/N0 while post cycle loss MA means are clustered on the right side with clear separation. We can infer that the post cycle loss MA mean values are likely to have a Gaussian distribution with a clear central mean near 3·3. It is also highly desirable that pre-cycle loss MA means that higher C/N0 values are more skewed to the left and have thinner tails to the right for robust separation. The statistical inference of these distributions will provide more theoretical background for the cycle loss and phase residual mechanisms. Figure 9 shows the effects of adding airborne maximum dynamics from SBAS Minimum Operational Performance Standard (MOPS) at v=250 knots (velocity), a=0·7658 g (m/s2) (acceleration), j=0·25 g/s (jerk). It is not surprising that more robust detection of cycle losses is possible as marginal recoverable cycle slips without vehicle dynamics become irrecoverable cycle losses from additional vehicle dynamics stress.
Histogram of mean {MA(); 1 s} from 100 simulations for C/N0 in {28, 30, 32, 34, 36} dB-Hz without vehicle dynamics.

Histogram of mean {MA(); 1 s} from 100 simulations for C/N0 in {28, 30, 32, 34, 36} dB-Hz with airborne vehicle dynamics.

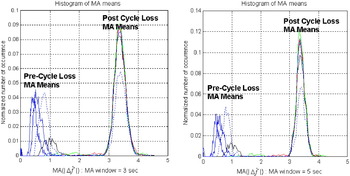
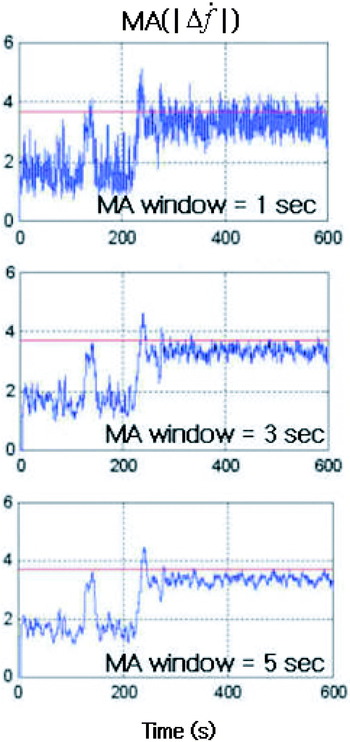
For cycle slip and loss detection, both the MA detection threshold and the window size, or equivalently the number of integrate-and-dump samples in the window, are important variables. As shown in Figure 10 for 3 and 5 s MA durations, MA mean values of |Δḟ| are more separable for longer MA window times compared to Figure 8. It is a classic dilemma, however, that longer averaging increases the probability of missed cycle slip and loss detection, as it is equivalent to narrowing the bandwidth of the detectable frequency offset. Another disadvantage of longer averaging is the amount of time required to refresh the moving average statistics after the cycle slip is detected and repaired. As shown in the next section, a 1 s average was robust with 0% misdetection rate when the MA threshold was properly set. The relationship between MA averaging duration, detection threshold for various C/N0 values, loop bandwidth and vehicle dynamics is a subject for further investigation.
Histogram of mean {MA(|Δḟ|); 1 s} for MA window 3 s (left) and 5 s (right) without airborne vehicle dynamics.

4.2. Selecting the FLL MA Cycle loss Detection Threshold
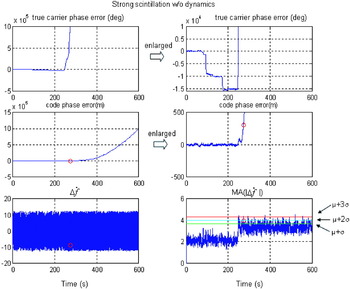
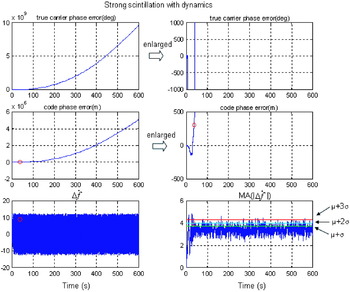
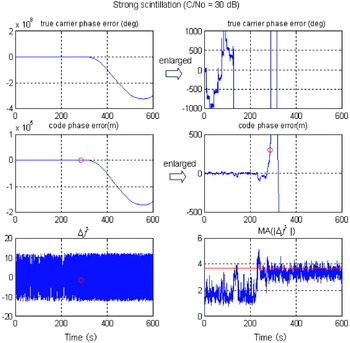
The consistent post cycle loss MA means in Figures 8 through 10 demonstrate robust statistical detection, even though the separation of the loop stress component may be more ambiguous. The robustness of the post cycle loss MA distribution indicates that a fixed preset threshold can be used without calculating the adaptive MA mean and the standard deviation. The preset fixed threshold possibility was tested as follows. Simulation results in Figures 11 through 13 show carrier tracking error at the top row, code tracking error in the middle row and the first-order FLL output, Δḟ, and MA of 1 second on its magnitude, MA(|Δḟ|), at the bottom row. In this simulation, the code tracking was performed by a PLL-aided DLL. The red circle on the simulation plots indicates the time that DLL loses its tracking lock caused by noisy PLL aiding. The purpose of this cycle loss detection is to provide safety-of-life aviation users with timely integrity alerts of irrecoverable cycle losses before DLL loses its tracking lock.
Cycle slip detection threshold decision with three thresholds. DPLL residual phase, cycle slip and tracking loss (top row). DLL tracking error and loss under carrier-aided code tracking (middle row). First-order FLL output and MA threshold (bottom row). (red: μ+3σ; cyan: μ+2σ; green: μ+σ).

Figure 11 shows the full cycle slip and tracking loss development under carrier-aided code tracking, whereas the bottom portion shows that the preset threshold for cycle slips and losses can be statistically meaningful from the histograms in Figure 8. The mean (μ) plus one, two or three times the standard deviation (σ) threshold candidates indicate irrecoverable cycle loss causing DLL lock loss at about 250 s before actual DLL lock loss (red circle). We can infer that the μ+σ threshold will increase the probability of cycle loss detection while increasing the probability of false cycle slip or losses. On the contrary, the μ+3σ cycle loss threshold could fail to detect cycle losses; therefore, it is not desirable. When SBAS MOPS maximum dynamics are added, as shown in Figure 12, the post cycle loss mean and sigma remain virtually the same. This confirms that the post cycle loss statistics are robust and explains the reliability of the thresholds shown in the tables in the next section.
Cycle slip detection threshold decision with three thresholds, SBAS MOPS maximum dynamics included. DPLL residual phase, cycle slip and tracking loss (top row). DLL tracking error and loss under carrier-aided code tracking (middle row). First-order FLL output and MA threshold (bottom row). (red: μ+3σ; cyan: μ+2σ; green: μ+σ).

Figures 13 and 14 show the improvement in discriminating cycle slip and losses for several MA window sizes. Figure 13 shows a misdetected cycle slip as a cycle loss at about 130 s with a 1 s MA window and μ+σ threshold in the C/N0=30 dB-Hz environment. Figure 14 shows simulation results with several MA windows in the same signal environment. As the window increases, the separation between cycle losses and slip becomes more discernable.
Cycle slip and loss detection with μ+σ threshold.

Improving cycle slip and loss detection separation using longer MA window sizes.

5. CYCLE LOSS DETECTION PERFORMANCE OF FLL MOVING AVERAGE (MA)
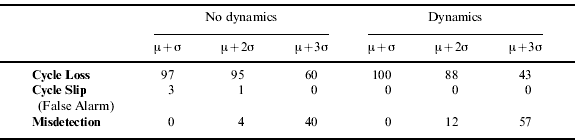
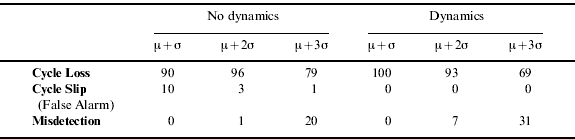
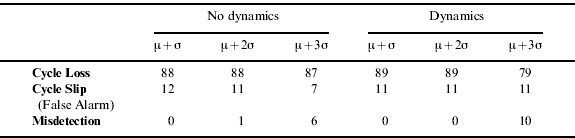
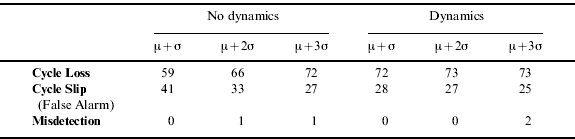
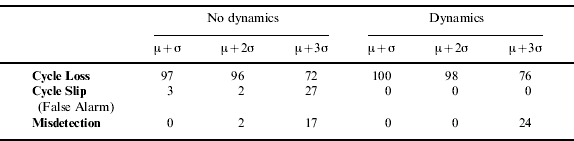
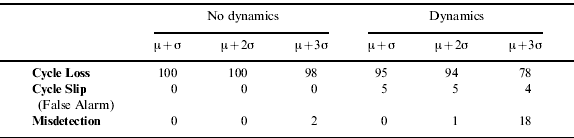
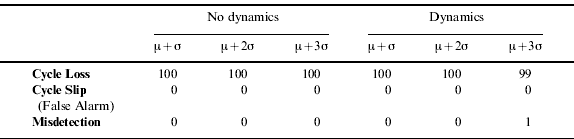
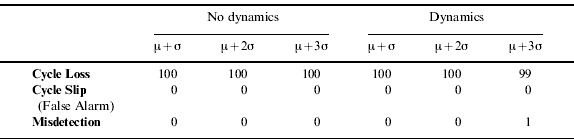
Tables 1 through 7 can be summarized by saying that for MA(|Δḟ|), the μ+σ detection threshold yields a very robust detection of joint cycle slip and losses in the challenging 26, 28, 30 and 32 dB-Hz C/N0 conditions, even with strong scintillation and vehicle dynamics. The cycle loss detection means MA(|Δḟ|) exceeds a preset threshold before DLL lock loss caused by irrecoverable cycle loss, while the cycle slip detection means MA(|Δḟ|) exceeds the threshold when recoverable cycle slip that does not cause DLL lock loss occurs. In the 26 dB-Hz C/N0 condition in Table 1, the μ+σ threshold yields 3% recoverable cycle slips and 97% irrecoverable cycle losses, but no misdetection of cycle losses. However, Table 4 shows that in the 32 dB-Hz C/N0 condition without dynamics, μ+σ yields 41% recoverable cycle slips that may be regarded as excessive DPLL loop-opening false alarms, while μ+2σ yields 33% cycle slips, and μ+3σ yields 27% cycle slips for potentially reduced false alarms. However, μ+2σ and μ+3σ misdetect 1% of critical irrecoverable cycle losses. Therefore, it is foreseeable that a two-step cycle slip and loss detection logic will be more effective using either first- or second-order FLL output trajectories with carefully controlled computational delay. The sequential trajectory search algorithms from Viterbi or Cahn (Cahn, Reference Cahn1974) can be re-evaluated in FLL as well. Both approaches benefit from statistical inference of pre- and post cycle loss MA probability densities and theoretical functional analysis of nonlinear loop dynamics in the joint time-frequency domain.
Threshold performance comparison in strong scintillation C/N0=26 dB-Hz (%).
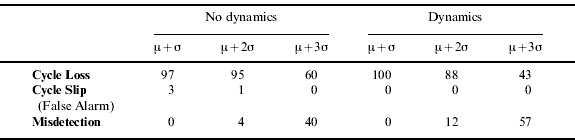
Threshold performance comparison in strong scintillation C/N0=28 dB-Hz (%).
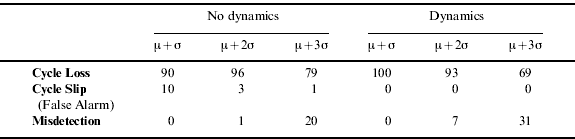
Threshold performance comparison in strong scintillation C/N0=30 dB-Hz (%).
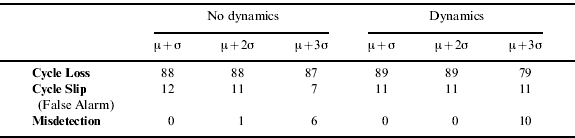
Threshold performance comparison in strong scintillation C/N0=32 dB-Hz (%).
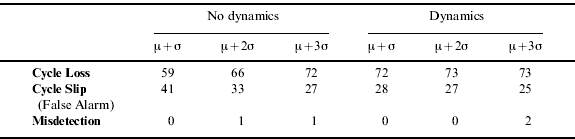
Threshold performance comparison in phase scintillation C/N0=26 dB-Hz (%).
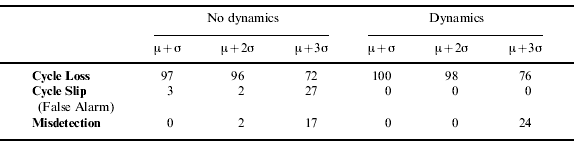
Threshold performance comparison in phase scintillation C/N0=28 dB-Hz (%).
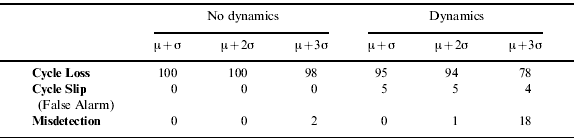
Threshold performance comparison in phase scintillation C/N0=30 dB-Hz (%).
6. CONCLUSIONS
We have developed hardware-oriented robust on-line cycle slip and loss detection logic for single-frequency stand-alone aviation receivers. The method is based on a joint implementation of PLL and FLL. By adding a reserved FLL to the conventional PLL, its frequency error was used as a cycle slip detection measurement. It was determined that the measurement shows the tendency of cycle slip and that its moving average could be used with a fixed threshold to indicate the occurrence of cycle slip or losses. The moving average could be useful because it could make up for the possibility that the filtering effect could cause group delay followed by positioning error. In this joint implementation, the reserved FLL also could be used as a substitution for the PLL when critical cycle loss was detected.
We demonstrated that the moving average of |Δḟ| or by either the first- or second-order FLL output provides robust detection of DPLL cycle losses to prevent the ensuing loss of code tracking for the integrity alert. The method is supported by intensive simulation of severe ionosphere, low C/N0 and maximum allowable airborne dynamic conditions. In all conditions, the detection of combined cycle slip and losses is shown to be robust by setting the threshold at mean plus one standard deviation (μ+σ) of post cycle loss moving averages of |Δḟ|. Even though the detection of recoverable cycle slips that may be regarded as false alarm could cause excessive DPLL loop-opening at some marginal signal to noise ratio (32 dB-Hz C/N0 for strong scintillation), two-step cycle slip and loss detection logic and longer MA window size would reduce it. It is expected that similar robust detection power is available from the second-order FLL output envelope, , but the computation may be unnecessary for such a small anticipated benefit under the slow-fading environments investigated in this paper. However, in fast-fading and higher vehicle dynamics conditions, the advantage of the second-order FLL output envelope is anticipated to be more significant. Several detection thresholds were investigated and their statistical confidence was evaluated. Regardless of the environment stresses, the 1 second MA of first- and second-order FLL output envelopes revealed stable Gaussian-type histograms that can be inferred from the non-linear theory of Doppler-rate dynamic systems. Our hardware-oriented MA method would be practical for implementation in aviation receivers.
For practical purposes, it is encouraging that a single pre-calculated or slowly varying detection threshold can be used instead of a more complicated floating threshold. The MA simulation revealed the classical design trade-off in any digital signal processing system between short averaging time (i.e., wider, noisier low-pass filter bandwidth) and longer averaging time (i.e., narrow noise filter bandwidth). However, it is anticipated that ensuring robust cycle slip detection while boosting the discrimination between cycle slip and losses is achievable by adding more DPLL trajectory memory registers that can be tapped differently by the DPLL and the FLL in non-uniform sampling and/or multiple circular buffer systems. Importantly, the time-domain approach in this paper does not introduce any undesirable signal group delay and is capable of faster cycle slip detection when cycle slip begins. Because this method does not depend on observing a full-blown carrier cycle and loss that could increase the integrity risk, it would be very easily implemented.
Further benefits in MA design will be investigated in tightening the loop delay and damping conditions under various loop stress conditions. The single-channel cycle slip detection and estimation logic developed in this paper will provide a benchmark to compare with more advanced vector tracking loops. In scintillation conditions, several channels can be fading together, and the performance advantage of VDLL, VDPLL and VFLL over the joint detection by single channels will quantify the advantage of vector tracking loop.
ACKNOWLEDGEMENT
The study was supported in part by the Brain Korea 21 (BK-21) Program for Mechanical and Aerospace Engineering Research, the Institute of Advanced Machinery and Design, the Institute of Advanced Aerospace Technology at Seoul National University and grant (I10700107A 150000120) from the Ministry of Maritime Affairs and Fisheries of the Korean Government.
The authors appreciate Dr. Taehwan Kim for his contribution and advice.