Introduction
Millet fonio (Digitaria exilis Stapf), an ancient African cereal, contributes to the fight against hunger and food insecurity for more than thousands of people, especially during a food lean period when early cultivars are used to control famine (Cruz et al., Reference Cruz, Béavogui and Dramé2011; Ballogou, Reference Ballogou2013; Taylor, Reference Taylor, Taylor and Awika2017). It is full of important nutritional, socio-cultural and even medicinal values. Rich in methionine and cysteine, fonio is mainly poor in gluten and has relatively low glycaemic index compared to other cereals (rice, maize, millet, sorghum) (Cruz et al., Reference Cruz, Béavogui and Dramé2011; Taylor, Reference Taylor, Taylor and Awika2017; Abdul and Jideani, Reference Abdul, Jideani, Al-Khayri, Jain and Johnson2019). Thus, it is recommended mainly to diabetics, pregnant and nursing women, and to people suffering from overweight and coeliac disease (Traore et al., Reference Traore, Ndoye, Hamaker, Stoecker, Betts and Guiro2009; Jideani and Jideani, Reference Jideani and Jideani2011). Fonio is herbaceous cereal with a high tolerance to drought stress thanks to its C4 metabolism and ensures good plant cover on fragile and poorly valued soils (Cruz et al., Reference Cruz, Béavogui and Dramé2011; Vall et al., Reference Vall, Andrieu, Beavogui and Sogodogo2011; Kamenya et al., Reference Kamenya, Mikwa, Song and Odeny2021). As a result, this orphan crop has great potential for organic and sustainable agriculture in cropping areas facing biotic and abiotic stresses, notably recurrent rainfall disturbances in recent years (Abrouk et al., Reference Abrouk, Ahmed, Cubry, Šimoníková, Cauet, Pailles, Bettgenhaeuser, Gapa, Scarcelli, Couderc, Zekraoui, Kathiresan, Čížková, Hřibová, Doležel, Arribat, Bergès, Wieringa, Gueye, Kane, Leclerc, Causse, Vancoppenolle, Billot, Wicker, Vigouroux, Barnaud and Krattinger2020; Kamenya et al., Reference Kamenya, Mikwa, Song and Odeny2021). It contributes to healthy and sustainable food systems, and emerges as a crop that can be promoted in agroecological cropping systems that safeguard both the soil and the environment (Mabhaudhi et al., Reference Mabhaudhi, Chimonyo, Hlahla, Massawe, Mayes, Nhamo and Modi2019; Kanlindogbè et al., Reference Kanlindogbè, Sekloka, Zinsou and Natta2020a).
The recent estimates of FAOSTAT (2019) showed a fonio production of 700 501 tonnes on 916 171 ha with an average grain yield of 764.6 kg/ha for whole West Africa, including 3806 tonnes on 5850 ha for Benin yielding 650.6 kg/ha slightly lower than global yield in West Africa. In Benin, fonio is an identity cereal for the Otammari peoples of Atacora, particularly in municipality of Boukombé, where it is heavily involved in their rituals and cultural practices (Ballogou, Reference Ballogou2013; Paraïso et al., Reference Paraïso, Zoclanclounou, Sekloka, Batamoussi, Akogbeto, Batawila, Glitho and Sanni2016).
Despite its potential, fonio has long remained marginal and neglected plant. Very little work is available on varietal breeding so that varieties grown until then are generally local populations resulting from the evolution of farmer selection (Adoukonou-Sagbadja et al., Reference Adoukonou-Sagbadja, Wagner, Dansi, Ahlemeyer, Daïnou, Akpagana and Friedt2007; Vall et al., Reference Vall, Andrieu, Beavogui and Sogodogo2011; Sekloka et al., Reference Sekloka, Kanlindogbè, Biaou, Adoukonou-Sagbadja, Kora, Motouama, Seidou, Zinsou, Afouda and Baba-Moussa2016; Animasaun et al., Reference Animasaun, Awujoola, Oyedeji, Morakinyo and Krishnamurthy2018). Likewise, access to seeds is traditional and does not come from any seed production centre (Adoukonou-Sagbadja et al., Reference Adoukonou-Sagbadja, Dansi, Vodouhe and Akpagana2006; Dansi et al., Reference Dansi, Adoukonou-Sagbadja and Vodouhe2010; Sekloka et al., Reference Sekloka, Adoukonou-sagbadja, Paraïso, Yoa, Bachabi and Zoumarou-wallis2015). In addition, fonio cropping techniques and practices have remained traditional and characterized by arduous nature of cultivation operations. It is the case of broadcast sowing, most common method of fonio sowing, resulting in several constraints including the tediousness of plots weeding by hand pulling (Cruz et al., Reference Cruz, Béavogui and Dramé2011; Kanlindogbè et al., Reference Kanlindogbè, Sekloka, Zinsou and Natta2020a). Consequently, fonio is generally practiced on small areas (<1 ha per farmer), unlike other cash crops often sown on several hectares (Kanfany et al., Reference Kanfany, Gueye, Sarr, Noba, Sall and Ndiaye2016). The lack of improved varieties and cultivation practices generally leads to often low yield (<1 tonne/ha) with 500–800 kg/ha on average of fonio paddy (Sekloka et al., Reference Sekloka, Adoukonou-sagbadja, Paraïso, Yoa, Bachabi and Zoumarou-wallis2015; Gueye, Reference Gueye2016; Kanlindogbè et al., Reference Kanlindogbè, Sekloka, Zinsou and Natta2020a). These difficulties are major concerns that scientific research must address given the prominent rule this cereal plays in food security and environment protection. It is in this context that a mass selection programme performed on collection of fonio accessions from Benin led to the development of homogeneous genotypes from the point of view of earliness, yield, grain colour, etc. (Kanlindogbè et al., Reference Kanlindogbè, Sekloka, Achigan-Dako and Kwon-Ndung2020b). This work aims at analysing the responses of these new genotypes to different sowing methods in order to identify the best combinations for increasing fonio production.
Materials and methods
Experimental site
The trials were conducted during the rainy season of 2018 and 2019 at the research station of the Faculty of Agronomy of the University of Parakou (09°20.283′N, 02°902′E, 362 m a.s.l). The municipality of Parakou is located in the Sudano–Guinean transition zone characterized by one dry season and one rainy season. The dry season lasts from November to April and the rainy season from May to October (Sinsin and Kampmann, Reference Sinsin and Kampmann2010).
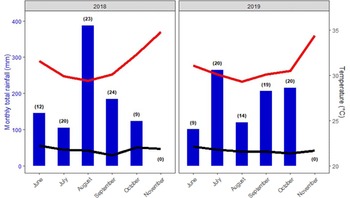
The rains were more or less regular and distributed during the trial periods (Fig. 1). August and July were the rainiest months in 2018 and 2019, respectively. Rainfall totals during the trial were 945.9 mm over 88 rainy days in 2018, and 908.0 mm over 82 days in 2019. Generally, the temperature varied little during the two cropping seasons. Thus, minimum temperatures ranged from 21 to 23°C and maximum temperatures from 29 to 35°C with the mean peaks of 28.35°C in 2018 and of 28.05°C in 2019 reached each time in November (Fig. 1).
Evolution of rainfall and temperatures during the trials (2018, 2019). The bar graph stands for ‘total rainfall' in mm. The values in parentheses above barplots stand for number of rainy days in each trial month. Red line indicates the ‘maximum temperature' while black line the ‘minimum temperature’.

Prior to implementation of each trial, a composite soil sample was taken from five points across trial, distributed on the two diagonals of experimental plot, of which one in centre and the others equidistant from the centre. Then, the individual soil samples collected from 0 to 20 cm horizon, the root development layer (Gueye, Reference Gueye2016), were mixed and a representative sample has been selected for physico-chemical analyses at the Laboratory of Soil Sciences, Water and Environment (LSSEE) of the National Institute of Agricultural Research of Benin (INRAB). The soil was a loamy sand in 2018, and of sand texture in 2019 (Table 1). Assessment of soil organic matter showed a relatively lower carbon to nitrogen (C/N) ratio in 2018 (<15) than in 2019 (<20) (Table 1). This indicates rapid mineralization and release of available soil nitrogen, which was somewhat more easily mobilizable in 2018 for plant nutrition v. 2019. In addition, the soils were rich in assimilable phosphorus (142–151 ppm) (Table 1).
Physico-chemical properties of experimental site soil in 2018 and 2019

Proportion (%), parts per million (ppm).
Source: LSSEE/INRAB.
Plant material
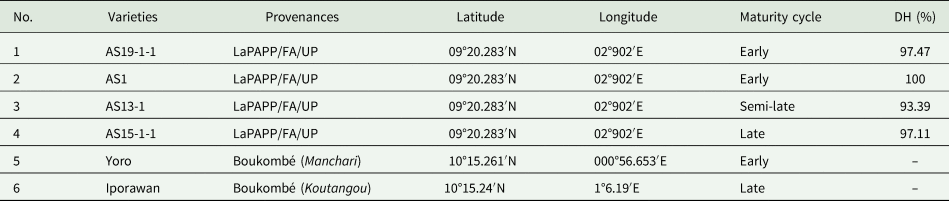
The plant material consisted of six varieties of fonio including four homogeneous genotypes (AS19-1-1, AS1, AS13-1, AS15-1-1) from mass selection programme (Kanlindogbè et al., Reference Kanlindogbè, Sekloka, Achigan-Dako and Kwon-Ndung2020b) and two local varieties widely grown in Boukombé, main area of fonio cropping in Benin (Dansi et al., Reference Dansi, Adoukonou-Sagbadja and Vodouhe2010; Sekloka et al., Reference Sekloka, Adoukonou-sagbadja, Paraïso, Yoa, Bachabi and Zoumarou-wallis2015; Paraïso et al., Reference Paraïso, Zoclanclounou, Sekloka, Batamoussi, Akogbeto, Batawila, Glitho and Sanni2016). Thus, the landraces ‘Yoro’ (Ditamari) of early cycle (≈3 months), and ‘Iporawan’ (Ditamari) of late cycle (≈4 months) were used as controls (Table 2).
Characteristics of plant material

LaPAPP, Laboratory of Phytotechny, Plant Breeding and Plant Protection; FA/UP, Faculty of Agronomy of University of Parakou; DH, intra-varietal homogeneity rate in percentage.
Source: Kanlindogbè et al. (Reference Kanlindogbè, Sekloka, Achigan-Dako and Kwon-Ndung2020b).
Experimental design
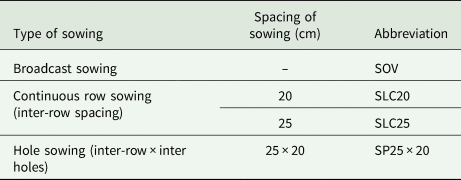
The trials were conducted during both growing seasons following split plot design with three replicates (Dagnelie, Reference Dagnelie2012). The main and secondary factors were ‘sowing methods’ and ‘variety’, respectively. The modalities of sowing methods were arranged in the large plots while the different varieties were installed in the small plots. Table 3 summarizes the studied modalities of sowing methods. Each replicate is subdivided into as many sub-blocks as the number of main factor modalities (sowing methods). The fonio varieties were randomly distributed in each sub-block. Each variety was sown on an elementary plot of 2 m long and 1.5 m wide (3 m2). The alley between two consecutive replicates, sub-blocks and elementary plots were 2, 1.5 and 1 m, respectively.
Presentation of factors and modalities of the sowing methods

Installation and crop management
Sowing was carried out on 25 June 2018 and on 28 June 2019 at the recommended rate of 30 kg of seeds per hectare (Cruz et al., Reference Cruz, Béavogui and Dramé2011; Fofana et al., Reference Fofana, Guèye, Kanfany, Tall and Djiba2017). A first manual weeding and hoeing was carried out 20 days after each sowing. Other additional weeding was carried out in order to control weeds until harvest. No fertilizer or pesticide treatment was applied. The harvest was carried out by mowing the mature stubble with scissors for each entire elementary plot of 3 m2. After drying, threshing and winnowing, the paddy grains were weighed using an electronic scale (precision 1 g, capacity 10 kg).
Data collection
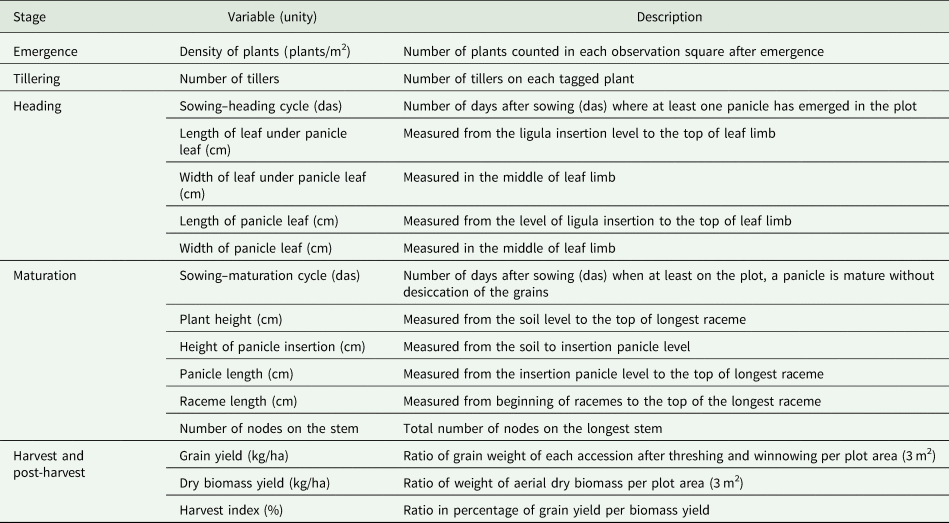
Growth and agronomic variables were collected (Bioversity International et al., 2007; Gueye et al., Reference Gueye, Kanfany, Fofana, Noba and Grove2015; Sekloka et al., Reference Sekloka, Kanlindogbè, Biaou, Adoukonou-Sagbadja, Kora, Motouama, Seidou, Zinsou, Afouda and Baba-Moussa2016). On each plot, three observation squares of 50 × 50 cm2 were installed on the diagonal, one in the centre and the other two equidistant from the central square. Growth variables were assessed on five plants randomly tagged in each square (i.e. 15 plants per plot). Agronomic variables were evaluated at the scale of each entire elementary plot (3 m2) (Table 4).
Description of assessed variables

Data analysis
Collected data were entered on an Excel spreadsheet 2016 and analysed with R software 4.1.2 (R Core Team, 2021). Combined graphs of rainfalls and temperatures were plotted using the R package ‘ggplot2’ (Wickham, Reference Wickham2016). The performances of varieties and sowing methods were assessed by determining for each quantitative trait, the means and the coefficient of variation. Models of pooled analysis of variance with interactions were generated and validated after checking the normality and homoscedasticity of residuals. Thus, the effects of varieties, sowing method and years as well as their interactions (varieties × sowing, varieties × year, sowing × year, varieties × sowing × year) have been tested. Whenever interaction was significant, post-hoc test of Tukey at 5% threshold was performed comparing ‘varieties’ for each level of ‘sowing methods’ or comparing ‘varieties’ and ‘sowing methods’ at each trial year using R-packages emmeans (Lenth, Reference Lenth2022) and multcomp (Hothorn et al., Reference Hothorn, Bretz and Westfall2008). Likewise, in the event of significant effects of studied factors ‘variety’ or ‘sowing method’ across years, theirs means were separated using honest significant difference post-hoc test of Tukey at 5% threshold. The models were generated with the Agricolae package (de Mendiburu, Reference de Mendiburu2019). Pearson correlation test was performed to assess the relationship between plant density and growth in number of tillers.
In addition, in order to identify best combinations amongst genotypes and sowing methods for yield improvement, growth and agronomic variables were subjected to standardized principal component analysis (PCA) followed by an ascending hierarchical clustering based on Euclidean distance according to Ward's method. In addition, one-way analysis of variance followed by Tukey's test was performed each time to compare the means of homogeneous combination groups. The packages ‘FactoMineR’ (Le et al., Reference Le, Josse and Husson2008) and Factoextra (Kassambara and Mundt, Reference Kassambara and Mundt2019) were used for these analyses.
Results
Growth responses of varieties to different sowing methods
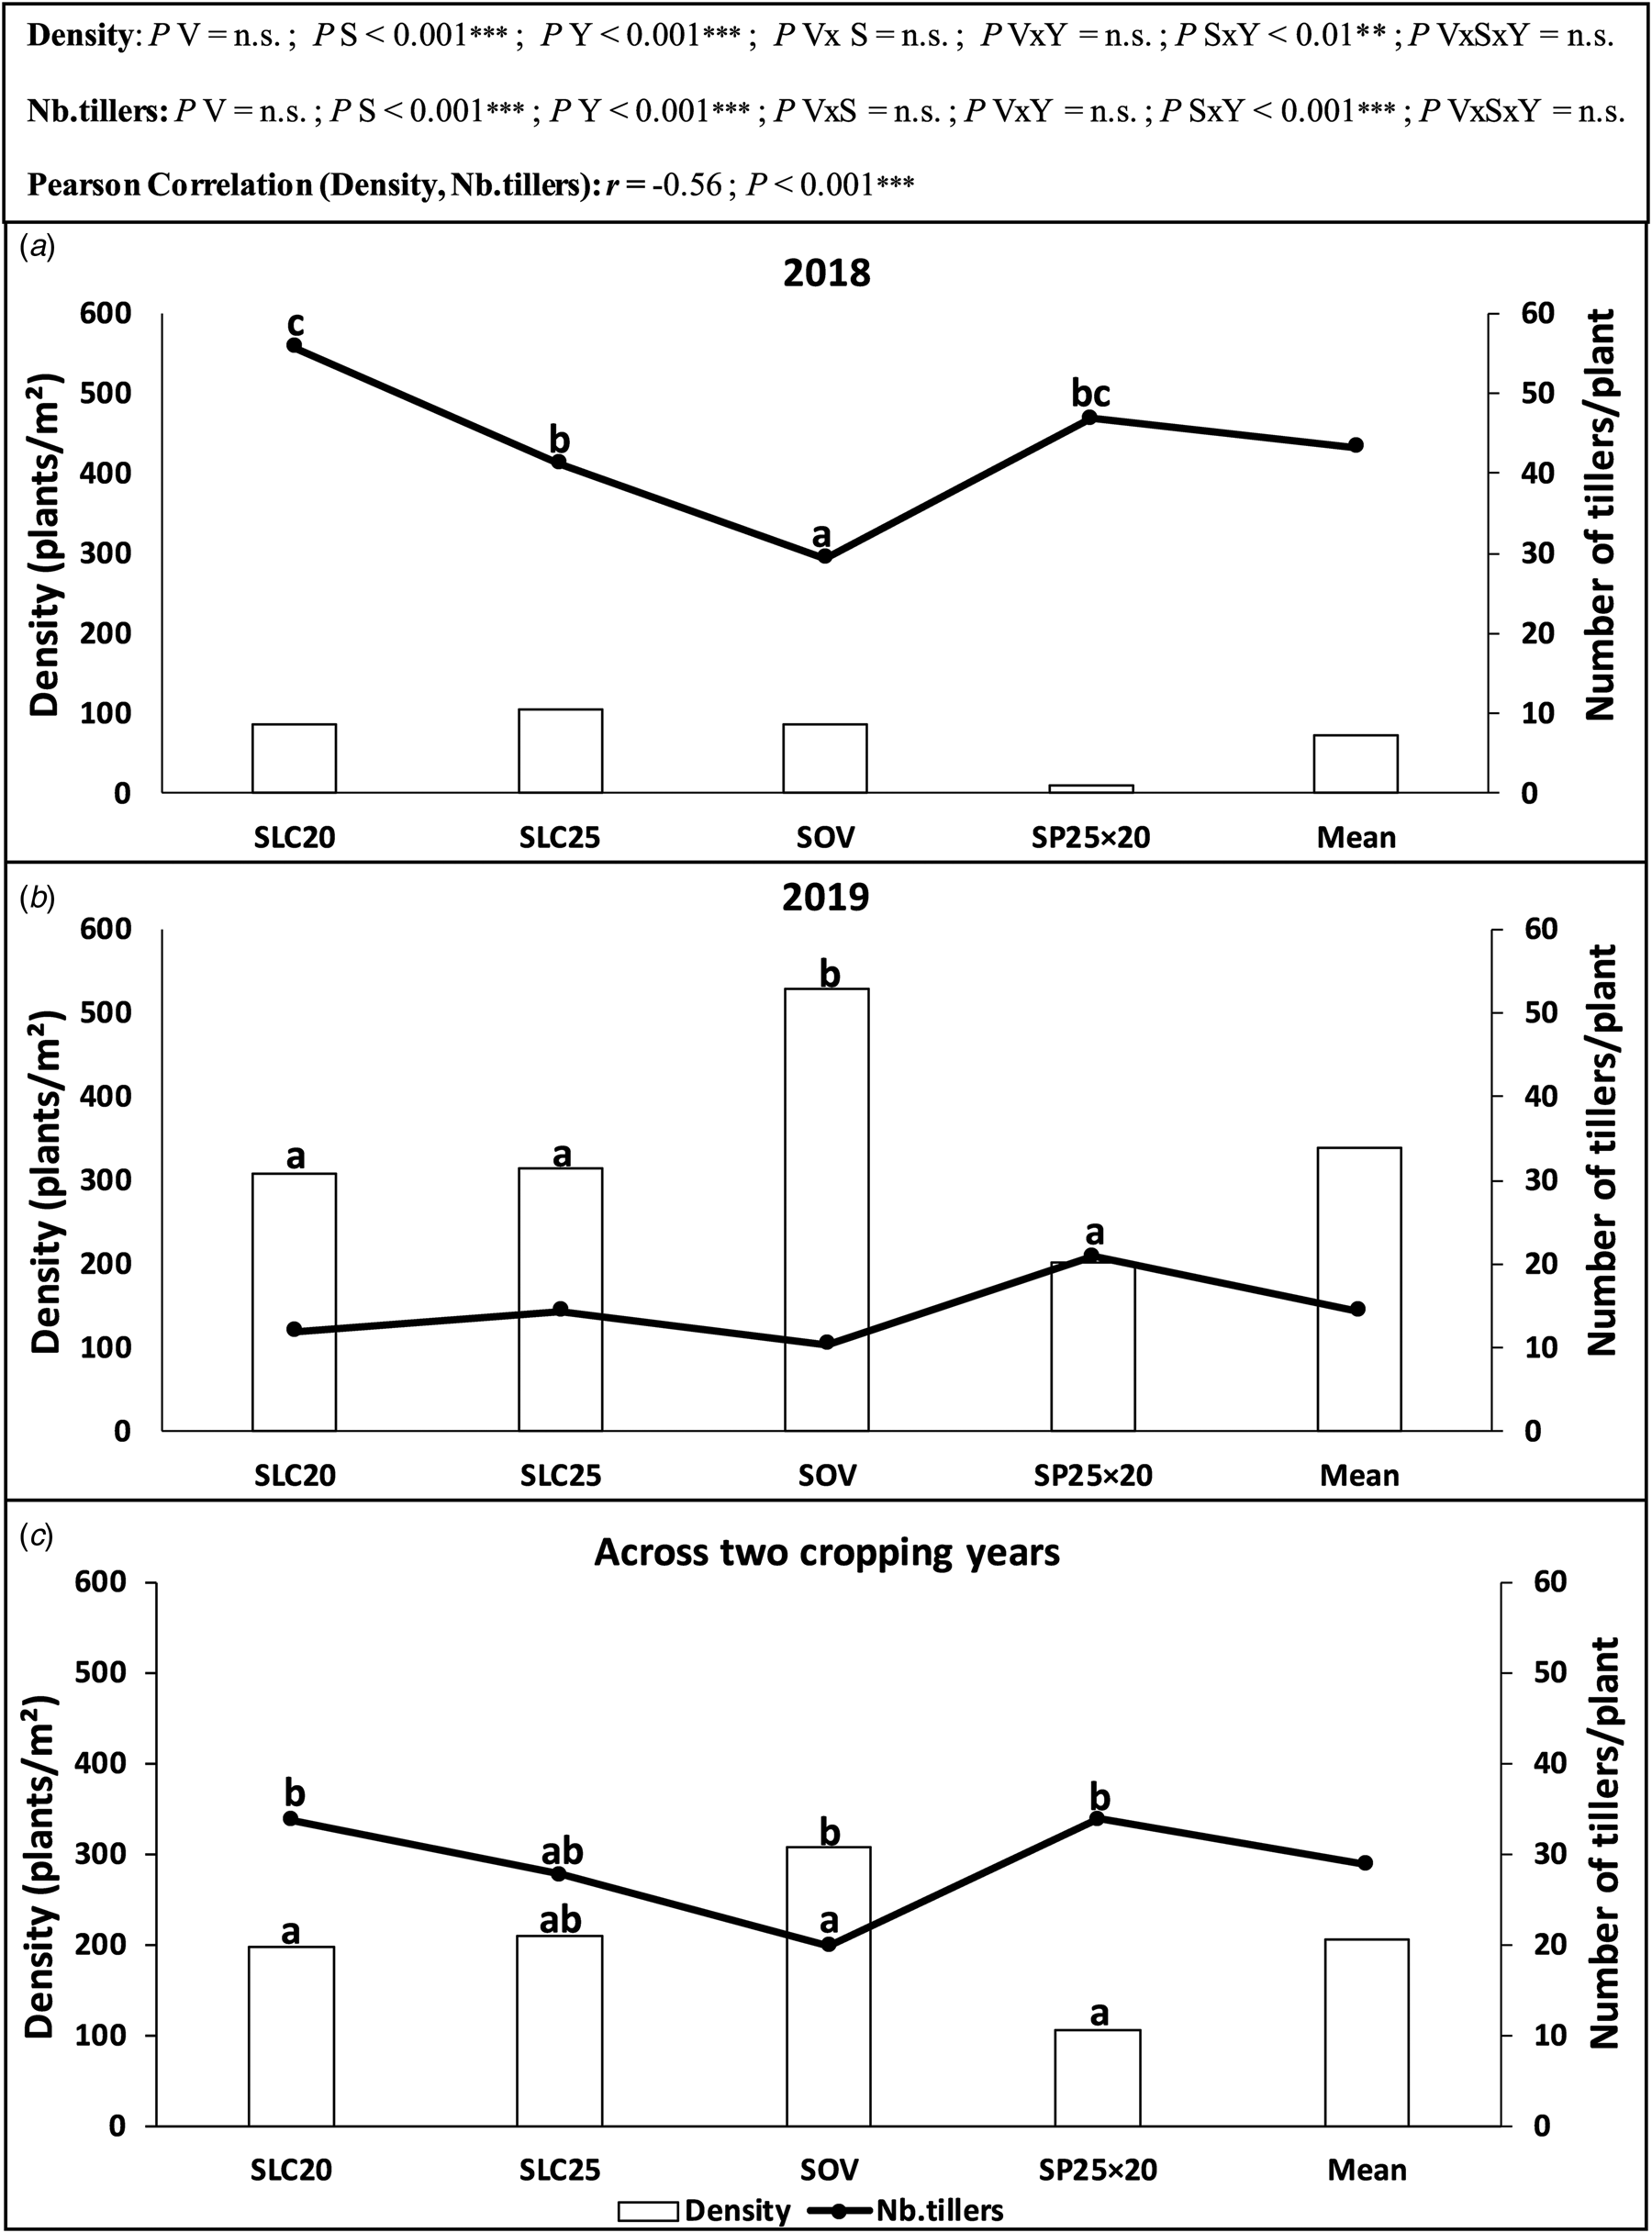
On plant density and number of tillers per plant, the pooled analyses showed only the interaction ‘sowing × year’ was highly significant (P < 0.01) (Fig. 2). As for individual factors, only the effects ‘sowing method’ and ‘year’ were significant on density and the number of tillers per plant. Thus, by cropping year, density differences amongst sowing methods were only significant in 2019 where ordinary broadcast sowing (SOV) recorded the highest plant density (Figs 2(a) and (b)). Likewise, the pooled analysis across the two cropping years showed overall plant densities were high in broadcast sowing plots (SOV), average in continuous row sowing (SLC20, SLC25) and low in seed hole sowing (SP25 × 20) (Fig. 2(c)). For tillers number, differences were only significant in 2018 where the plants developed the lowest number of tillers within the broadcast sowing plots and the highest one within continuous row sowing at 20 cm (SLC20) and hole sowing (SP25 × 20) (Figs 2(a) and (b)). The pooled analysis also showed unlike the broadcasting, numbers of tiller per plant were higher in continuous rows and seed hole sowing (Fig. 2(c)). Overall, based on year effect, the mean plant density was significantly high in 2019 (338 plants/m2) v. 2018 (72.2 plants/m2) (Figs 2(a) and (b)). A reverse trend was observed for mean number of tillers per year (43.3 tillers/plant in 2018 v. 14.4 tillers/plant in 2019) (Figs 2(a) and (b)). In addition, Pearson correlation analysis showed plant density was negatively correlated with the number of tillers (Fig. 2).
Plant density and tillering ability depending on genotypes and sowing methods. Ordinary broadcast sowing (SOV), continuous row sowing at inter-rows of 20 cm (SLC20) and 25 cm (SLC25), hole sowing at 25 cm × 20 cm (SP25 × 20), density of plants (Density), number of tillers (No. tillers). probabilities (P) of effects variety (V), sowing (S) and year (Y), interactions of variety × sowing (V × S), of variety X year (V × Y), of sowing × year (S × Y) and of variety × sowing × year (V × S × Y). Under sowing methods and for each variable, the plotted means assigned to different alphabetical letters are statistically different with the Tukey's test at 5% threshold. *Significant (P < 0.05), **highly significant (P < 0.01), ***very highly significant (P < 0.001), n.s., not significant (P > 0.05).

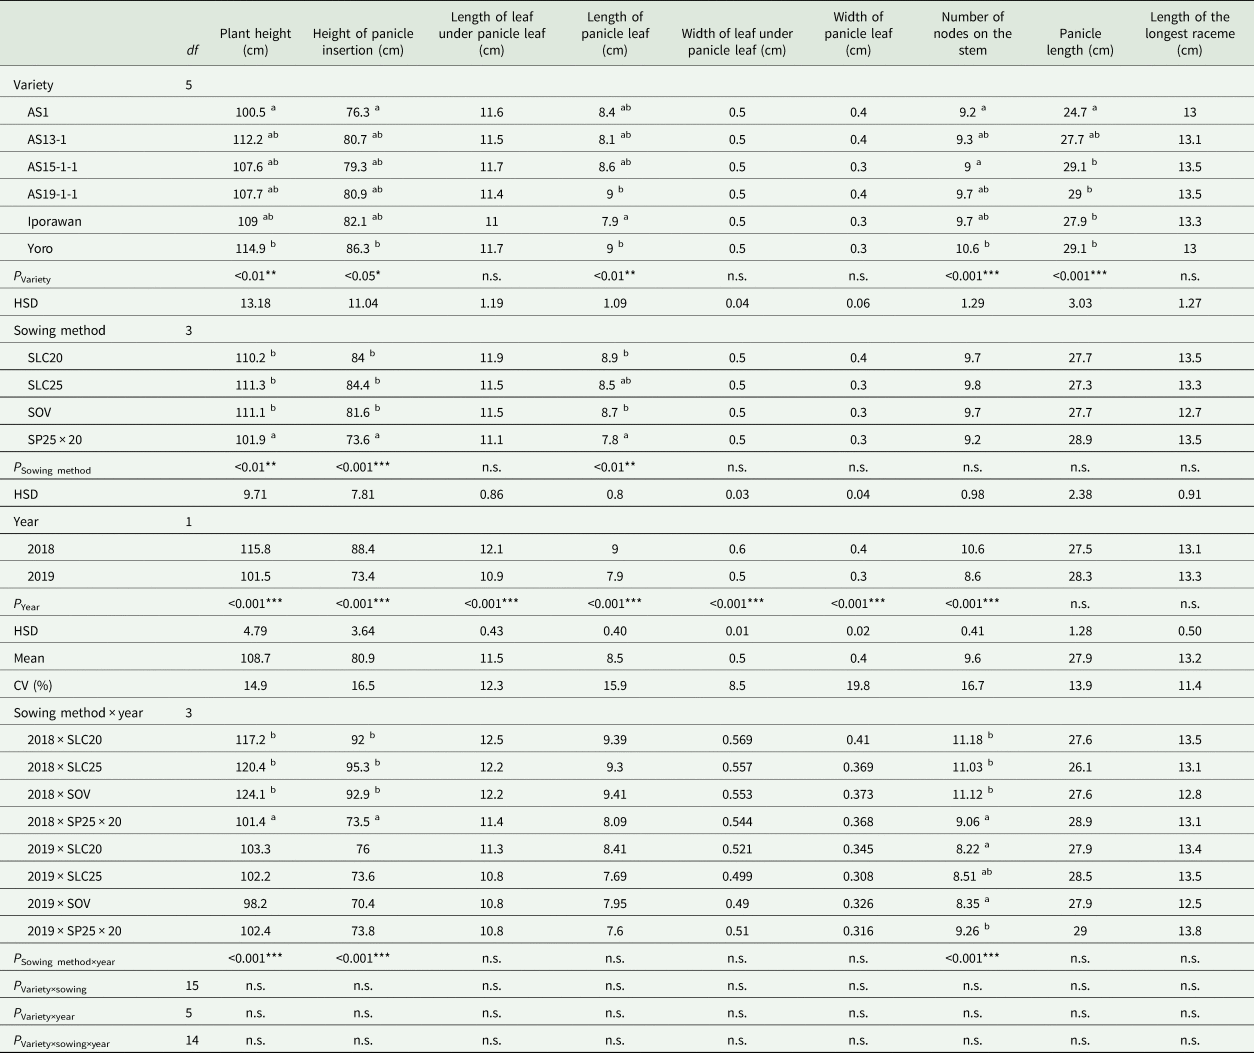
On all morphometric growth parameters, the pooled analyses of variance revealed the interactions ‘variety × sowing’, ‘variety × year’ and ‘variety × sowing × year’ have not been significant (P > 0.05) (Table 5). However, the interactions ‘sowing × year’ were highly significant on growth in heights of plant and of panicle insertion, and on the number of nodes (P < 0.001) (Table 5). The pooled analysis revealed significant effects of ‘variety’, ‘methods of sowing’ and ‘year’ factors on several morphological traits (Table 5). As for variety effect, significant differences were observed between varieties for growth in heights and in number of nodes, as well as for the lengths of panicles (Lg.pan) and of panicle leaf (LongFP) (P < 0.05) (Table 5). Thus, amongst varieties across two cropping years, the control ‘Yoro’ was the tallest (114.9 cm) and the genotype ‘AS1’ the shortest (100.5 cm). The other variables showed no significant difference between varieties (Table 5).
Growth performances depending on varieties, sowing methods, year and interaction

Ordinary broadcast sowing (SOV), continuous row sowing at inter-rows of 20 cm (SLC20) and 25 cm (SLC25), hole sowing at 25 cm × 20 cm (SP25 × 20). Degree of freedom (df), honest significant differences (HSD) and coefficient of variation (CV). For each variable and factor, the means assigned to different alphabetical letters are statistically different with the post-hoc of Tukey's method at 5% threshold.
*Significant (P < 0.05), **highly significant (P < 0.01), ***very highly significant (P < 0.001), n.s., not significant (P > 0.05).
In addition, the sowing method effect was highly significant on the height growth traits and on the panicle leaves length (P < 0.01) (Table 5). Moreover, except for the panicles and racemes lengths, the year effect was highly significant on the growth parameters where the plants performed better in 2018 v. 2019 (115.8 v. 101.5 cm for the example of plant height) (Table 5). As regard to ‘sowing × year’ interaction, the analyses by cropping year showed that the differences between sowing methods were significant only in 2018 for plant and panicle insertion heights where plants were shorter in size in hole sowing and longer in the other sowing methods (Table 5). However, the growth in number of nodes within hole sowing was significantly the lowest in 2018 and inversely the highest in 2019 v. other sowing methods. Across two cropping years, the best growth performances of plants were observed in continuous row sowing (SLC20, SLC25) and broadcast sowing (SOV), in particular SLC25 (Table 5). In general, most of morphological traits showed medium coefficients of variation (CV < 15%) (Table 5).
Agro-phenological responses to sowing methods
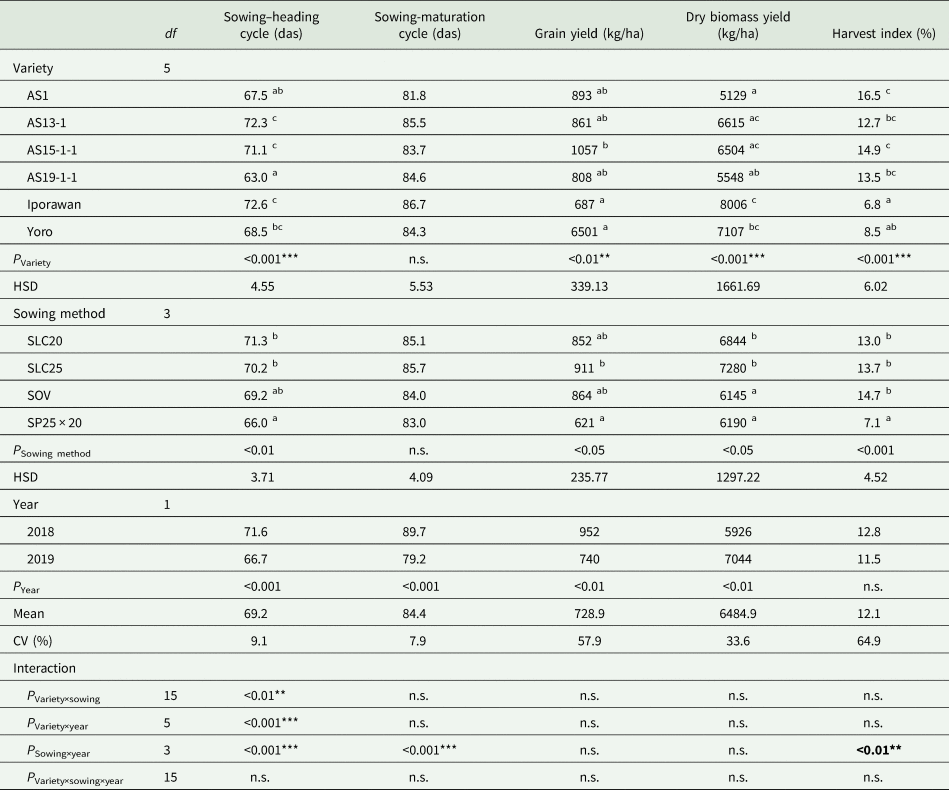
On all evaluated agro-phenological traits, the interactions ‘sowing × variety × year’ have not been significant (Table 6). Interactions ‘variety × sowing’ and ‘variety × year’ have been highly significant only on the sowing–heading cycle (P < 0.01). Interactions ‘sowing × year’ were also very significant on the sowing–heading and maturation cycles, and on the harvest index (P < 0.01). The interactions had no significant effect on grain and biomass yields.
Effects of sowing methods, varieties and interaction on agro-phenological performances

Ordinary broadcast sowing (SOV), continuous row sowing at inter-rows of 20 cm (SLC20) and 25 cm (SLC25), Seeding in hole planting of 25 cm × 20 cm (SP25 × 20), number of days after sowing (das), degree of freedom (df), honest significant differences (HSD) and coefficient of variation (CV). For each variable and factor, the means assigned to different alphabetical letters are statistically different with the Tukey's test at 5% threshold.
*Significant (P < 0.05), **highly significant (P < 0.01), ***very highly significant (P < 0.001), n.s., not significant (P > 0.05).
The individual factors ‘variety’, ‘methods of sowing’ and ‘year’ depicted significant effects on most of earliness and yield traits (Table 6). So, except for harvest index, the year effect was highly significant on all other agro-phenological traits where the plants performed better for grain yield in 2018 (952 kg/ha) v. 2019 (740 kg/ha) (Table 6).
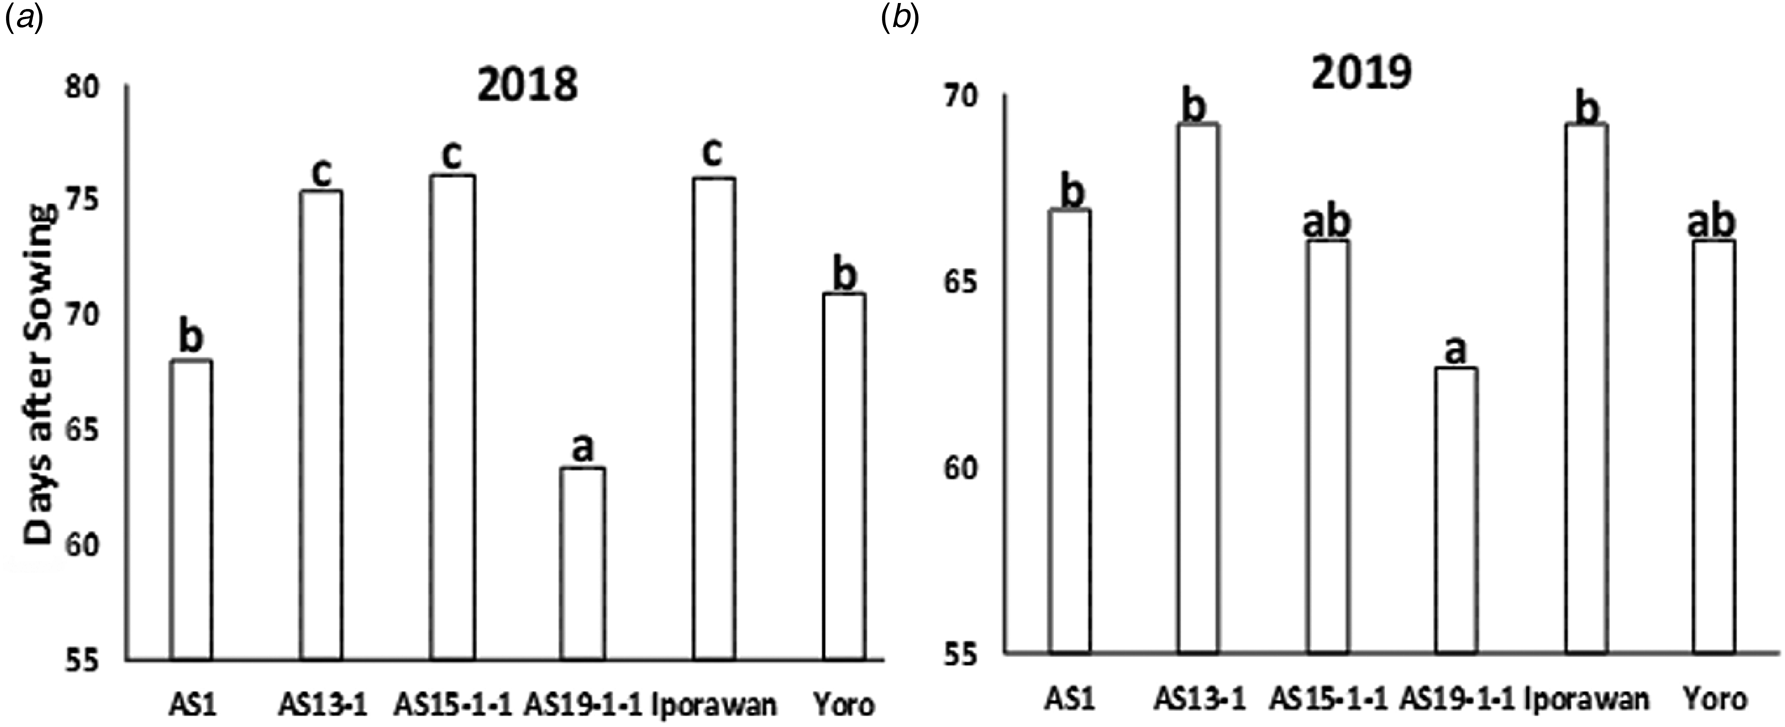
The pooled analysis revealed very highly significant differences between varieties (P < 0.01) as for sowing–heading cycle, grain and biomass yields and harvest index (Table 6). Given the significant interaction of ‘variety × year’ on sowing–heading cycle, analyses by year revealed three heading groups where genotype AS19-1-1 was the earliest in 2018 and 2019 (Figs 3(a) and (b)). All of the genotypes conserved their heading groups except for genotype AS15-1-1, which exhibited significantly shortened sowing–heading cycle by 10 days in 2019 (66.1 days after sowing (das)) compared to 2018 (76.1 das) (Figs 3(a) and (b)). Across two years, genotypes AS19-1-1, AS1 and control ‘Yoro’ were the earliest, mainly AS19-1-1 with sowing–heading cycle of less than 65 days. The other varieties AS13-1, AS15-1-1 and control ‘Iporawan’ were late. For yield, all the new genotypes had higher grain yield (>800 kg/ha) than the controls (Yoro and Iporawan) (<700 kg/ha). Thus, AS15-1-1 was the most grain yielding (1056.5 kg/ha) by presenting an excess yield of 405.9 kg/ha (i.e. 62.4%) compared to control ‘Yoro’ (650.9 kg/ha) with the lowest yield. Similar trends were observed for harvest index. However, the control varieties had the highest yield in biomass, in particular ‘Iporawan’ (>8000 kg/ha) (Table 6).
Comparison of sowing–heading cycle of genotypes by each cropping year. Assessed genotypes (AS1, AS13-1, AS15-1-1, AS19-1-1, Iporawan and Yoro). For each cropping year, the means plotted by barplots with different comparison letters are statistically different at 5% threshold thanks to post-hoc test of Tukey's method.

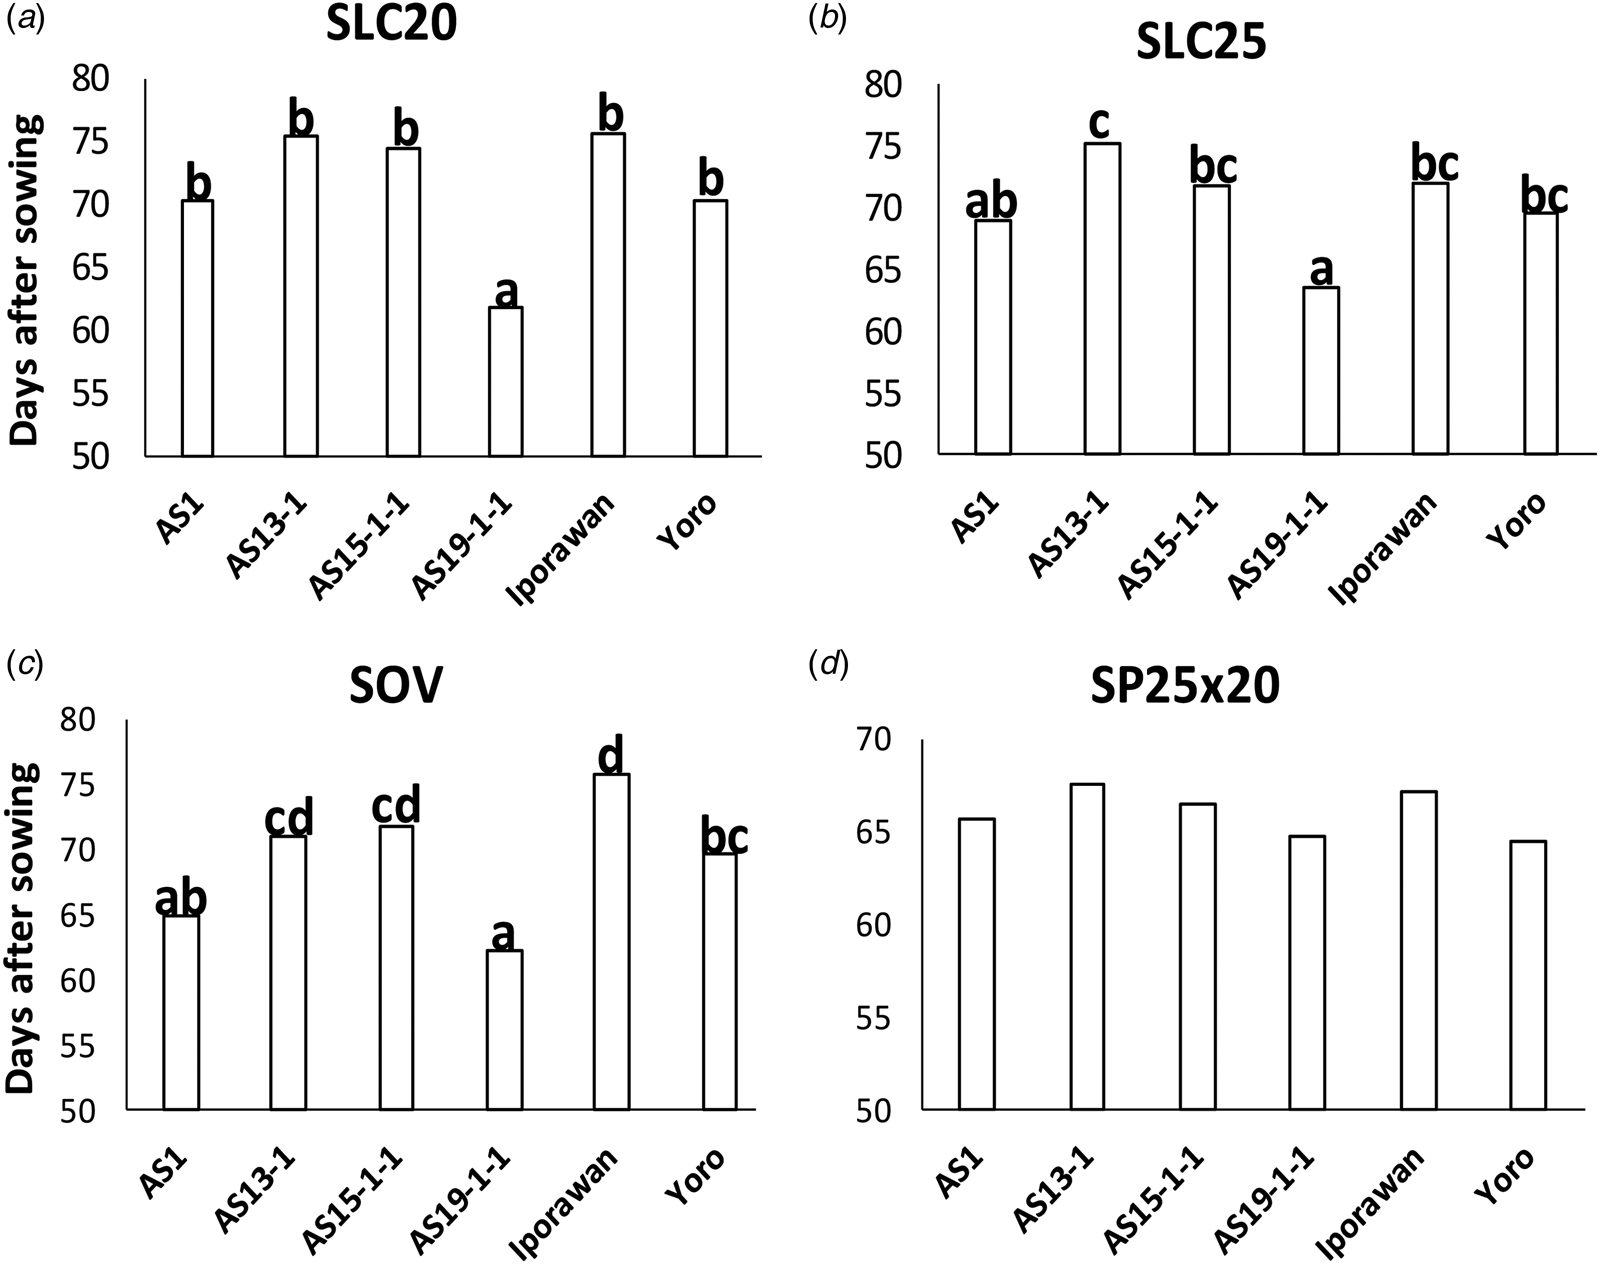
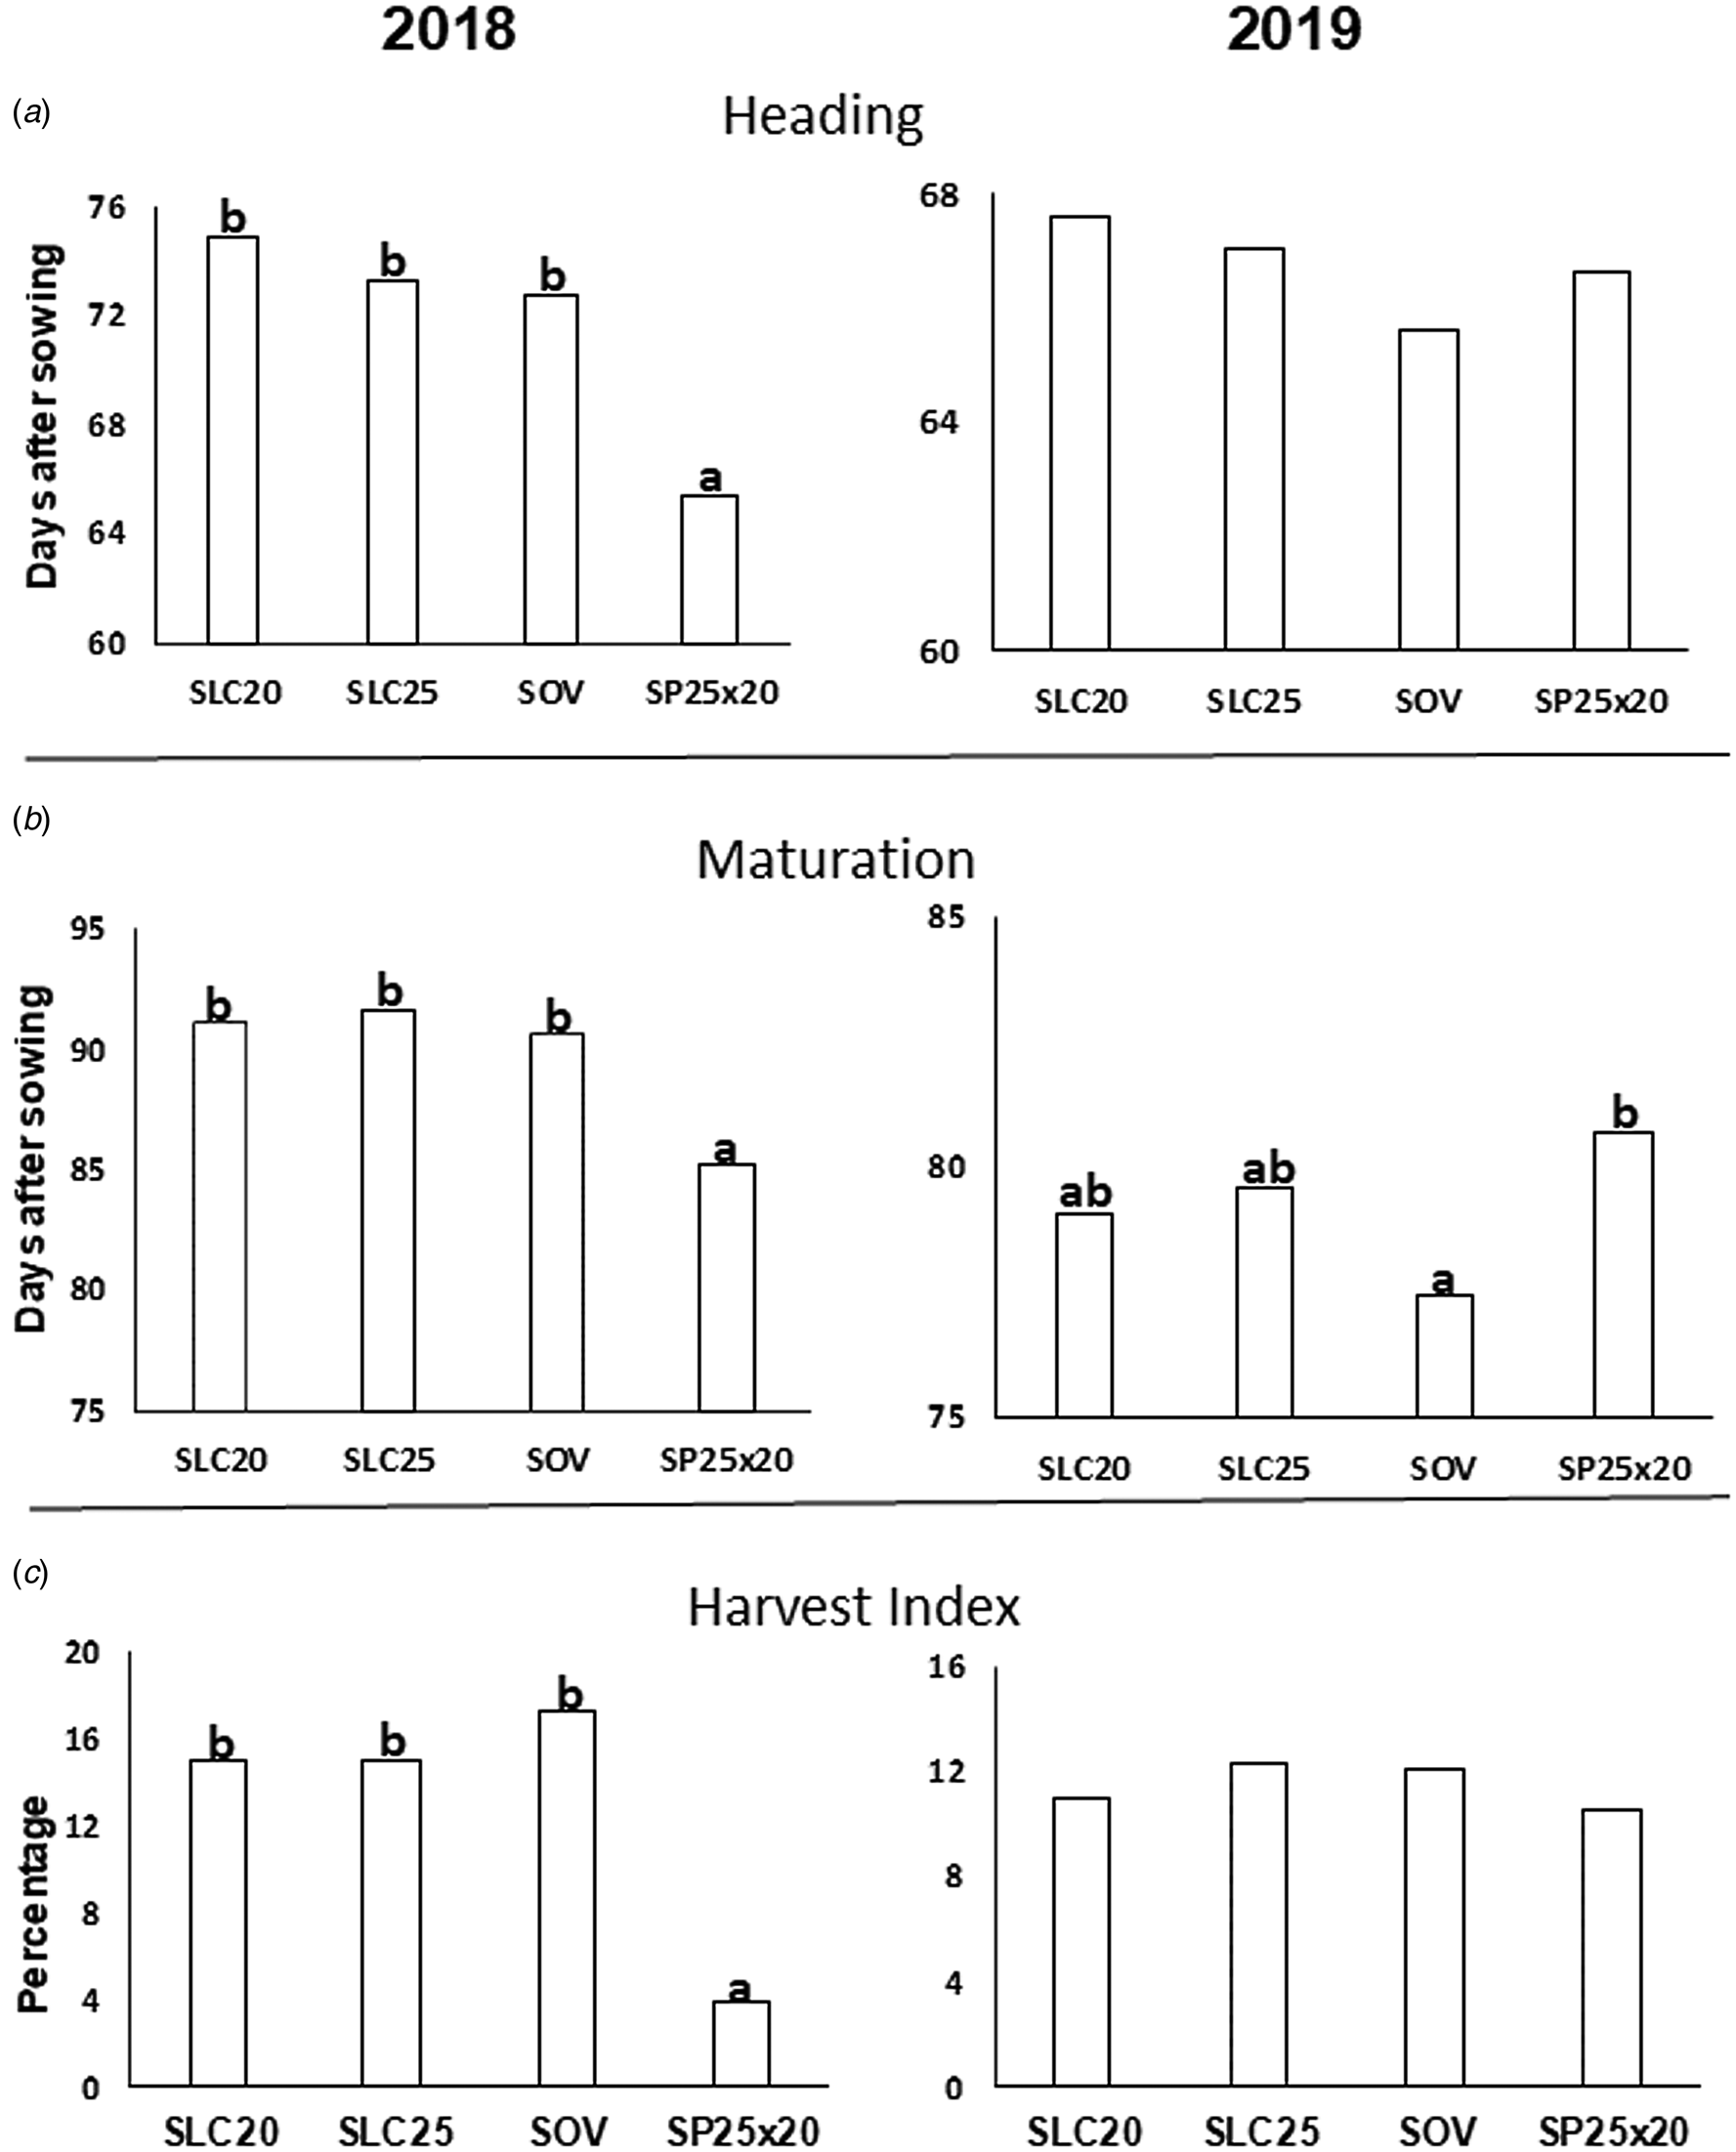
In addition, the sowing methods effect was significant on sowing–heading cycle and on yield components (P < 0.01) (Table 6). The pooled analysis highlighted heading was early in the hole sowing plots, intermediate in broadcast sowing and late in continuous row sowing. Grain and biomass yields were better in row sowing and lower in hole sowing plots. Grain yield was intermediate in broadcast sowing plots (Table 6). Considering significant ‘variety × sowing’ interaction on sowing–heading cycle, the post-hoc analysis comparing varieties for each sowing method displayed two heading groups for continuous row sowing at 20 cm (SLC20), three groups for continuous row sowing at 25 cm (SLC25), five groups for ordinary broadcast sowing (SOV) and one for hole sowing (SP25 × 20) (Figs 4(a)–(d)). Additionally, genotype AS19-1-1 was the earliest one in all sowing methods. From significant ‘sowing × year’ interaction on sowing–heading cycle, the compared analysis of sowing methods by year showed only significant effect in 2018 where the plants were earlier in hole sowing than other sowing methods (Fig. 5(a)). This trend is similar to that observed for harvest index (Fig. 5(c)). As for maturity cycle, the differences between sowing methods were significant for each year where the hole sowing presented earlier plants in 2018 and conversely later plants in 2019. Likewise, compared to other sowing methods, ordinary broadcast sowing exhibited late maturing plants in 2018 and reversely early maturing plants in 2019 (Fig. 5(b)). Eventually, apart from phenological traits where the CVs were relatively low (CV < 10%), the yield components showed very high variation (CV > 30%) (Table 6).
Post-hoc comparison of sowing–heading cycle of varieties for each sowing method. Assessed genotypes (AS1, AS13-1, AS15-1-1, AS19-1-1, Iporawan and Yoro), ordinary broadcast sowing (SOV), continuous row sowing at inter-rows of 20 cm (SLC20) and 25 cm (SLC25), hole sowing at 25 cm × 20 cm (SP25 × 20). Unlike hole sowing level (SP25 × 20) where no significant difference was observed, the means plotted by barplots with different comparison letters are statistically different at 5% threshold thanks to post-hoc test of Tukey's method within each sowing method.

Post-hoc comparison of sowing methods by year for sowing–heading and sowing–maturation cycles and harvest index. Ordinary broadcast sowing (SOV), continuous row sowing at inter-rows of 20 cm (SLC20) and 25 cm (SLC25), hole sowing at 25 cm × 20 cm (SP25 × 20). Unlike no significant difference observed between sowing methods in 2019 for heading and harvest index, sowing method means plotted each cropping year by barplots and assigned with different comparison letters are statistically different at 5% threshold thanks to post-hoc test of Tukey's method.

Identification of best combinations of varieties and sowing methods
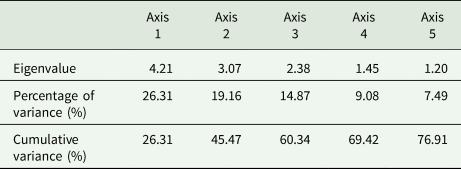
The standardized PCA performed on all the growth and yield variables showed the first five principal components explained 76.9% of the total variability with eigenvalues all greater than 1. The first two axes alone explained more than 45% of this variability (Table 7).
Characteristics of five main axes

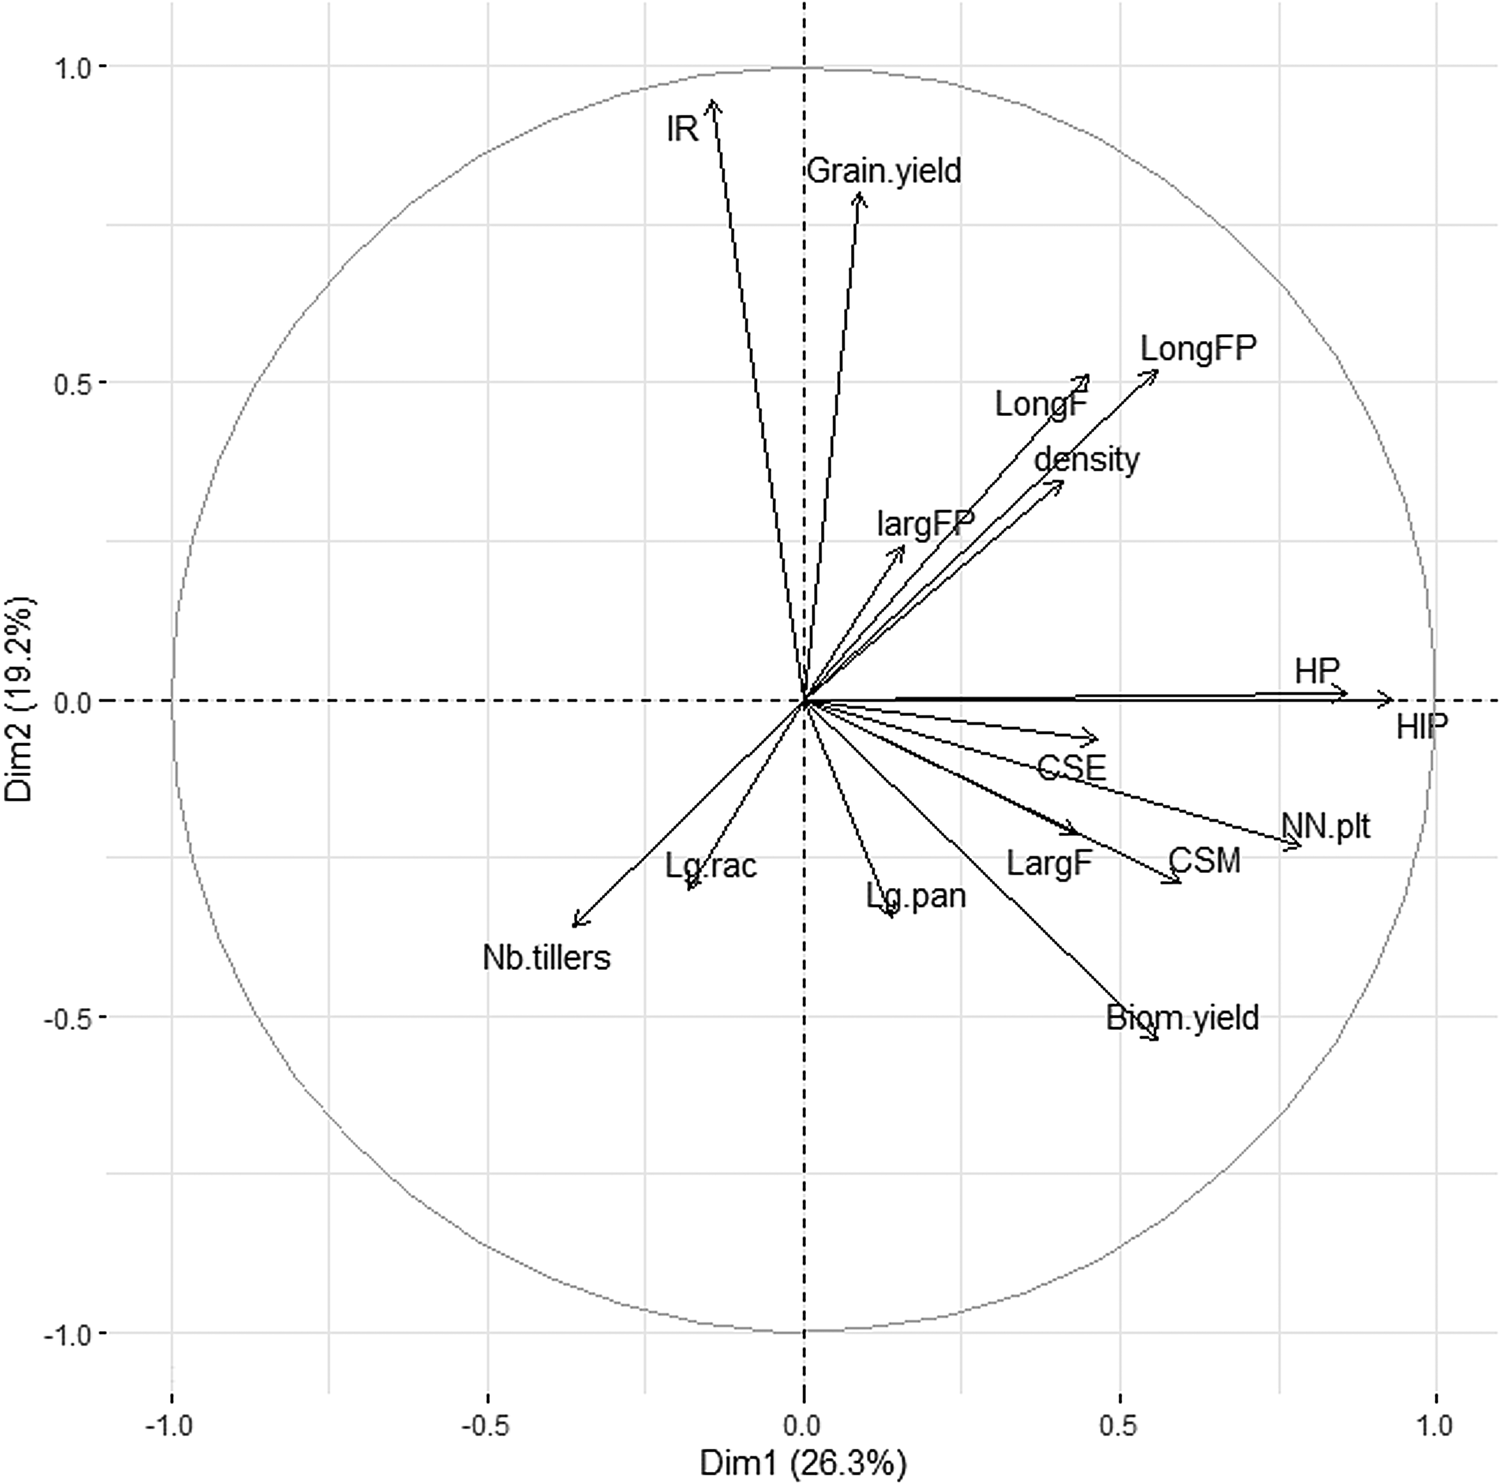
The correlation of the variables with factor axes revealed that the first axis is positively related to plants heights, to some extent to earliness traits, leaves lengths, growth in number of nodes and biomass yield (Fig. 6). This axis describes plants growth, earliness and biomass production. The second axis is positively correlated with grain yield and harvest index (Fig. 6). This axis characterizes grain production.
Correlation circle showing relations amongst variables in the first factor plane. Plant density (density), length (LongFP) and width (LargFP) of the panicle leaf, length (LongF) and width (LargF) of the leaf under panicle leaf, height of the plant (HP) and of insertion panicle (HIP), number of tillers (Nb.tillers) and node on the longest stem (NN.plt), panicle length (Lg.pan) and of raceme (Lg.rac), sowing–heading (CSE) and maturation (CSM) cycles, grain yield (Grain.yield) and dry biomass yield (Biom.yield), harvest index (IR).

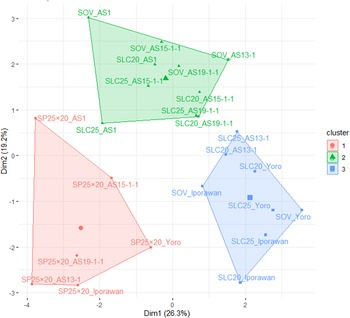
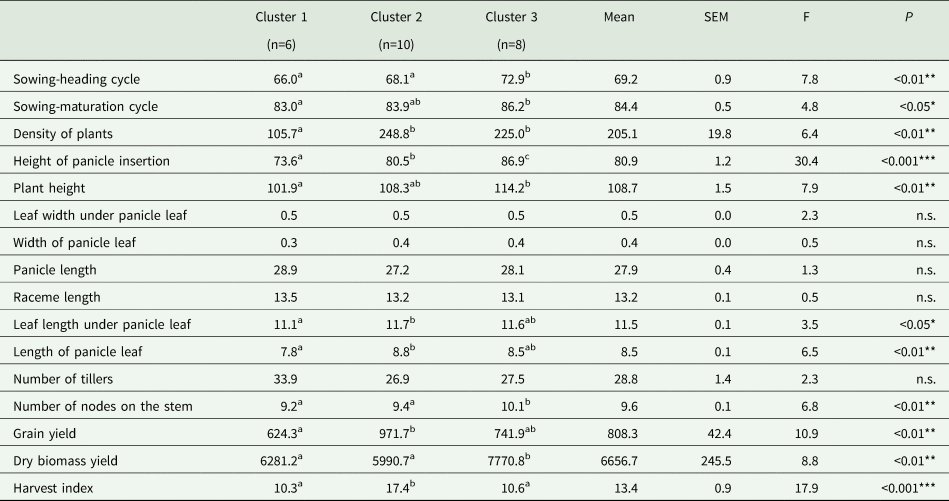
The ascending hierarchical clustering carried out on all the traits enabled to pool the different combinations of varieties and sowing methods into three clusters projected in the first factor plane (Fig. 7). The factor map resulting from this projection showed the first axis quite clearly discriminates cluster 1 from cluster 3 located respectively on the negative and positive sides of this axis (Fig. 7). Thus, cluster 3 presented the combinations of best growth performances and biomass production unlike those of cluster 1 which were the least efficient but with the shortest cycle plants. Cluster 2 is positively related to axis 2 (Fig. 7). This cluster had the best combinations for grain yield and harvest index. Thus, the combinations of the new genotypes (AS1, AS13-1, AS15-1-1 and AS19-1-1) with continuous row sowing of 20–25 cm inter-row spacing (SLC20, SLC25), or with broadcast sowing (SOV) have shown the best productions of fonio grain. These combinations of cluster 2, the most grain yielding (971.7 kg/ha), recorded an excess yield of 347.4 kg/ha (or 55.6%) compared to those of cluster 1, the least performing (624.3 kg/ha) (Table 8).
(Colour online) Factor map of combination groups (varieties and sowing methods) in the first plane. Cluster 1: combination of sowing in hole planting of 25 cm × 20 cm (SP25 × 20) with genotypes AS1, AS13-1, AS15-1-1, AS19-1-1, Iporawan and Yoro. Cluster 2: ordinary broadcast sowing (SOV) with AS1, AS13-1, AS19-1-1 and AS15-1-1; continuous row sowing at inter-rows of 20 cm (SLC20) and of 25 cm (SLC25) with AS1, AS15-1-1, AS19-1-1. Cluster 3: continuous row sowing at inter-rows of 20 cm (SLC20) and of 25 cm (SLC25) with AS13-1, Iporawan, Yoro and ordinary broadcast sowing (SOV) with Yoro and Iporawan.

Agronomic characteristics of obtained combination groups

Combination groups of varieties and sowing methods (Cluster), number of genotypes and sowing combinations (n). Cluster 1: combination of hole sowing of 25cm × 20 cm (SP25X20) with genotypes AS1, AS13-1, AS15-1-1 AS19-1-1, Iporawan and Yoro. Cluster 2: Ordinary broadcast sowing (SOV) with AS1, AS13-1, AS19-1-1 and AS15-1-1; continuous row sowing at inter-rows of 20 cm (SLC20) and of 25 cm (SLC25) with AS1, AS15-1-1, AS19-1-1. Cluster 3: continuous row sowing at inter-rows of 20 cm (SLC20) and of 25 cm (SLC25) with AS13-1, Iporawan, Yoro, and Ordinary broadcast sowing (SOV) with yoro and Iporawan. Standard Error of Mean (SEM), F statistics (F), probability (P). For each trait, the means assigned to different alphabetical letters are statistically different with the Tukey's test at 5% threshold. * Significant (P < 0.05), ** highly Significant (P < 0.01), *** very highly significant (P < 0.001), n.s. not significant (P > 0.05).
In addition, agronomic and morphological traits quite clearly characterizing the different combination clusters were constituted of sowing–heading and sowing–maturation cycles, height of plant and of panicle insertion, length of panicle leaf and of that under this last one, number of nodes per plant, grain and biomass yields and harvest index (Table 8).
Discussion
The development and use of improved varieties and appropriate cropping practices are key steps for improving crop production performances. This study assessing responses of fonio genotypes to different sowing methods over two cropping years revealed important effects on growth, phenology and yield of this crop.
Effect of interactions amongst genotype × sowing method and/or year
This current work revealed the interactions ‘variety × sowing × year’ were not significant on all the assessed morphometric and agronomic traits. This evaluation over two cropping years showed growth, development and production of fonio were not affected by the joint effect of the three factors ‘genotypes, sowing methods and year’.
The same is true for the interactions ‘variety × sowing’, ‘variety × year’, which were only significant on the sowing–heading cycle. In fact, the factors ‘sowing method’ and ‘year’ stand for non-genetic causes which reflected the existence of genotype by environment interaction on the heading of fonio. It means for heading, the genotypes react differently by changing rank from one sowing method to another and from the first year to the second one. This is the case where the interaction was inverse for genotype AS15-1-1 whose cycle was significantly shortened by moving from 2018 to 2019. As for ‘sowing × year’ interaction, it was the most significant on several assessed growth and phenological traits. This result indicates that the sowing effect on these traits was not the same from one year to another. So, analysis by year revealed the differences were either significant one year and not the second one for some traits (density, number of tillers, plant and panicle insertion heights, sowing–heading cycle, harvest index), or significant for each cropping year with inversion performance (case of number of node per plant, sowing–maturation cycle), or showed just quantitative interaction. All these interactions pointed out the combined or joint effects of cropping technique and year on the growth and agronomic performances of the genotypes. Thus, the variabilities related to sowing methods and growing conditions of two years (soil fertility, temperature, rainfall, photoperiod, adverse abundant rains leading to runoff on plots in 2018, crop husbandry, etc.) would explain these types of interaction. Similar trends of significant interaction of genotype by environment notably pedoclimatic conditions across years, were also highlighted in previous studies of Sani et al. (Reference Sani, Inoussa, Mainassara, Sanoussi, Barnaud, Billot, Bakasso, Mahamane and Saadou2017) on fonio.
Effect of variety
The effect of ‘variety’ was significant on most growth and agronomic traits. Focusing on growth traits, the controls in particular ‘Yoro’ was the longest in size, and genotype ‘AS1’ the shortest. This short genotype could be of breeding interest in reducing stem lodging effect of fonio. In fact, amongst traits inducing lodging, the plants height generally associated with the brittle constitution of the fonio stems have often been incriminated as factors causing the stems imbalance and thus predisposing the plants to lodging (Dansi et al., Reference Dansi, Adoukonou-Sagbadja and Vodouhe2010; Cruz et al., Reference Cruz, Béavogui and Dramé2011).
For phenology traits, the genotypes ‘AS19-1-1’ and ‘AS1’ and the control ‘Yoro’ were the earliest, especially ‘AS19-1-1’ which flowered within 65 das. The other genotypes (AS13-1, AS15-1-1 and control Iporawan) were late. Similar results have been found by Sekloka et al. (Reference Sekloka, Kanlindogbè, Biaou, Adoukonou-Sagbadja, Kora, Motouama, Seidou, Zinsou, Afouda and Baba-Moussa2016) in Benin, and Sani et al. (Reference Sani, Inoussa, Mainassara, Sanoussi, Barnaud, Billot, Bakasso, Mahamane and Saadou2017) in Niger, who also characterized two earliness groups from 20 and 64 fonio accessions respectively. In addition, the early genotypes (AS19-1-1 and AS1) would be of utmost agronomic importance given the climate disturbances, notably the shortening and early rains stopping, which have become a recurring natural disaster in cropping areas (Sekloka et al., Reference Sekloka, Kanlindogbè, Biaou, Adoukonou-Sagbadja, Kora, Motouama, Seidou, Zinsou, Afouda and Baba-Moussa2016; Kanlindogbè et al., Reference Kanlindogbè, Sekloka, Achigan-Dako and Kwon-Ndung2020b). Grain yield ranged from 650.9 to 1056.5 kg/ha with an average of 728.9 kg/ha. These values are within the range from 150 kg/ha to more than 1000 kg/ha of fonio paddy often reported in the literature (Vodouhè and Achigan Dako, Reference Vodouhè, Achigan Dako, Brink and Belay2006; Gueye et al., Reference Gueye, Kanfany, Fofana, Noba and Grove2015). All selected genotypes performed better than the control varieties in terms of grain yield, in particular AS15-1-1 (1057 kg/ha). These results highlight the good performance of the improved varieties. Thus, these genotypes, notably AS15-1-1 proved to be good ideotype for fonio grain production. However, the controls were more yielding in terms of dry matter, mainly control ‘Iporawan’ (>8000 kg/ha). Thus, the controls could be used for fodder production. Indeed, it has been shown that fonio straw is often used as fodder to feed cattle, goats and sheep especially in arid environments, where animal feed sources are scarce (Jideani, Reference Jideani1999; Cruz et al., Reference Cruz, Béavogui and Dramé2011). In addition, future evaluation of fodder nutritional values of these control varieties would enable to recommend them for intensive breeding or cattle fattening.
Effect of sowing method
Based on sowing method effect, the plant densities were high in broadcast sowing, average in continuous row sowing and low in hole sowing method although the rate of 30 kg/ha of seed was applied throughout. The seed quality (seed filling, embryo intactness, species and varietal purity, etc.) and especially seeding depth would explain these differences in plant density at emergence observed between these sowing methods, given the tiny size of fonio grains. Thus, shallow sowing on the soil and bulk method of seed distribution would explain the high densities observed at broadcast sowing. These results are consistent with those found by Gueye (Reference Gueye2016) and Kanlindogbè et al. (Reference Kanlindogbè, Sekloka, Ayelesso, Zinsou and Natta2020c), which compared to other sowing methods, all found high plant densities of fonio in broadcast sowing respectively in Senegal and in Benin. As for tillering, the plants developed good tillering capability in continuous row and hole sowing methods unlike in ordinary broadcast sowing. This result is congruent with the previous findings on fonio in Nigeria (Dachi et al., Reference Dachi, Mamza and Bakare2017), and on wheat in Pakistan (Soomro et al., Reference Soomro, Rahman, Odhano, Gul and Tareen2009) that all showed high numbers of tillers with the continuous row sowing method. In addition, this current study showed negative correlation between the density and the number of tillers across the sowing methods. Thus, the high densities induced low tillering capability and vice versa. This could be explained by the fact that high densities observed in broadcast sowing would induce significant intrinsic competition between plants for their needs in water, nutrient and light. Consequently, this would limit the tillering vigour. These results confirm again the previous studies which highlighted negative correlation between plant density and tillering vigour on fonio in Benin (Kanlindogbè et al., Reference Kanlindogbè, Sekloka, Ayelesso, Zinsou and Natta2020c) and on late pearl millet in Senegal (Bamba et al., Reference Bamba, Gueye, Badiane, Ngom and Ka2019).
From morphometric traits, the best growth performances were obtained with the method of continuous row sowing at 20 cm (SLC20) or 25 cm (SLC25) inter-row spacing, and with broadcast sowing method (SOV). These results suggest row sowing methods offer better possibility for fonio plants growth. Thus, the homogeneous distribution of seeds in row with accurate spacings limits competition between plants located especially on different rows, unlike the practice of broadcasting where the seeds are scattered in bulk without real control. These results are similar to previous studies carried out in real cropping environment in Boukombé (Benin) (Kanlindogbè et al., Reference Kanlindogbè, Sekloka, Ayelesso, Zinsou and Natta2020c). However, these current results differ from those observed by Gueye (Reference Gueye2016) in Senegal who found that fonio plants growth is not significantly affected by the sowing type. Indeed, Gueye (Reference Gueye2016) has conducted these trials on one single cultivar across two different areas unlike the present work.
From phenological point of view, the sowing–heading cycle was early in hole sowing plots, intermediate in broadcast sowing and late in the continuous row sowing. The competition of plants for light or sunshine could explain this result given that fonio being a photoperiodic plant (Portères, Reference Portères1955; Aliero and Morakinyo, Reference Aliero and Morakinyo2005; Gueye et al., Reference Gueye, Kanfany, Fofana, Noba and Grove2015). The density levels observed would influence the exposure rate of plants to light. Thus, given the photosensitivity of fonio to flowering (Portères, Reference Portères1955; Aliero and Morakinyo, Reference Aliero and Morakinyo2005), competition for light especially in plots with high plant densities, would be one of the factors inducing late flowering observed in broadcast sowing plots. This finding is compatible with those found by Sungthongwises and Sornpha (Reference Sungthongwises and Sornpha2020) who through their trial of seeding spacing on Vigna radiata in Thailand, showed that high plant densities affect the access of individual plants to light and in turn influence flowering stage. In addition to light or sunshine exposure and photoperiod sensitivity, other potential constraints such as planting date (Gueye et al., Reference Gueye, Kanfany, Fofana, Noba and Grove2015), water and heat stresses, etc. (Jagadish, Reference Jagadish2020) could also affect flowering cycle and other morpho-phenological traits, leading to important yield losses of crops.
On agronomic traits, grain yield was high in continuous row planting plots, intermediate in broadcast sowing plots and low in hole sowing ones. This low yield could be due to the low plant densities observed in hole sowing method. This result is consistent with previous observations which have shown that row planting gives better yield compared to other sowing methods in Senegal (Gueye, Reference Gueye2016), in Nigeria (Dachi et al., Reference Dachi, Mamza and Bakare2017) and in Benin (Kanlindogbè et al., Reference Kanlindogbè, Sekloka, Ayelesso, Zinsou and Natta2020c). However, the present results differ somewhat from the findings of Siéné et al. (Reference Siéné, Traoré, Doumbouya, Kouadio, Makadji and Zingbé2020) who have ranked broadcast planting most performing in terms of fonio grain yield in Ivory Coast. Indeed, in their work, seed rates were random for both continuous row and hole seeding, and without any control of planting spacing, some factors that influence plant density and, in turn, would affect grain production. Additionally, their trial focused on one cultivar and the yield is only estimated over one trial season and from small yield squares (1 m2), unlike the present study. All these factors would explain the observed differences. For biomass, production was high in continuous row sowing and low in broadcast and hole sowings. These results could be linked to the levels of recorded plant densities. Indeed, the high density would lead to intrinsic competition between the plants and this would limit the potential biomass production of fonio in broadcast sowing plots. Similarly, the low densities observed on hole sowing plots could reflect the lack of required plants on theses plots and in turn would result in low biomass production.
Effect of cropping year
The year effects revealed high mean plant density in 2019 v. 2018, and reverse trend as for mean number of tillers per plant. This important difference in plant density could be explained by the adverse effect of abundant rains recorded from sowing to emergence in 2018. In fact, these adverse heavy rains induced seeds burial and runoff over the plots. These effects would generally explain the low recorded densities in 2018 compared to 2019. Moreover, the previously demonstrated negative correlation amongst density and number of tillers would illustrate high mean number of tillers per plant recorded in 2018 v. 2019.
For most growth parameters and agronomic ones, the year effects were also highly significant where the plants performed better in 2018 v. 2019. Performances variation from one year to another would result from fluctuating pedoclimatic conditions and/or from the important differences in plant density and number of tillers between two cropping years. In fact, rainfall decreased somewhat from 2018 (945.9 mm over 88 days) to 2019 (908 mm over 82 days). The rainfall was relatively more distributed in 2018 mainly during August and September months coinciding the heading and reproductive stages of cropped varieties where the plants were more rainfed and more developed v. 2019. Inversely, the relative low rainfall distribution in 2019 would explain the global shortening of sowing–heading and sowing–maturation cycles of varieties for probable climatic adaptation, as well as the low performances comparatively to 2018. Likewise, based on soil fertility analysis, the relative low C/N ratio in 2018 (<15) v. in 2019 (<20) illustrated rapid mineralization and release of available soil nitrogen which was more readily mobilizable in 2018 for crop growth (Akratos et al., Reference Akratos, Tekerlekopoulou, Vasiliadou, Vayenas and Galanakis2017; Brust, Reference Brust, Biswas and Micallef2019). Furthermore, the low density of plants followed by high tillering capability would have induced an increase in plant growth and thereby grain yield of fonio in 2018 v. 2019. In summary, the rainfall distribution, variations in soil fertility levels and nutrient mobilization, seed germination rate, biotic stresses (pest attacks, diseases, etc.) and other climatic conditions (lighting exposure, physiological stresses, etc.) would explain these significant performance differences from one year to another. Similarly, it has also been shown on various crops (wheat, oats and maize) that phenological growth and yield of varieties are largely controlled or affected by variation of several climatic factors including temperature, day length (photoperiod) and potential physiological stresses (Olesen et al., Reference Olesen, Børgesen, Elsgaard, Palosuo, Rötter, Skjelvåg, Peltonen-Sainio, Börjesson, Trnka, Ewert, Siebert, Brisson, Eitzinger, van Asselt, Oberforster and van der Fels-Klerx2012; Khalid, Reference Khalid2017).
Optimum combinations for improving yield
Analyses on the combinations between genotypes and sowing method showed cropping systems in which the new genotypes (AS1, AS13-1, AS15-1-1, AS19-6-1-1) sown in continuous rows at 20 cm (SLC20) or 25 cm (SLC20) of inter-row spacing or by broadcasting (SOV), were better in terms of fonio grain yield (≈1000 kg/ha) despite interactions variety by sowing method were not significant. This result demonstrates one of the pathways for combination genotypes and cropping techniques to optimize fonio grain production. However, the significant year effect and its interactions with sowing or genotypes factors show the importance of extending the trials over a few additional years in order to highlight the achieved performance stability. Ultimately, future studies investigating the response of these selected genotypes to other factors susceptible to affect fonio yield (types and fertilizer rates, plant density, pests and disease attacks, weeds control, intercropping effect, etc.) would enable further improvement of fonio cropping systems for boosting production.
Conclusion
Over two years, this study assessed for the first time in Benin the performance of new fonio genotypes depending on different sowing methods. The interaction variety × sowing × year was not significant for all evaluated variables whereas other interactions were significant on some morphometric and phenological traits. Variety effect was significant on most assessed traits where AS19-1-1 was the earliest and the genotypes AS15-1-1 and the control ‘Iporawan’ the most grain and biomass yielding respectively. In addition, ‘sowing method’ effect showed plant growth and yield were better in broadcasting and especially in continuous row sowing. Growing practices combining improved genotypes and continuous row sowing methods at 20–25 cm inter-row spacing, or with broadcast sowing have led to good agronomic performances, mainly fonio grain yield (≈1000 kg/ha). Such a cropping system would enable to optimize production and in turn, contribute to the revival of fonio crop.
Acknowledgements
The authors are grateful to the Republic of Benin, West African Economic and Monetary Union (UEMOA) and Eclosio & Louvain Coopération NGOs for their grants or frank collaboration. The authors thank the editors and the anonymous reviewers for their useful comments and valuable suggestions.
Author contributions
C. K., study initiator, participated in all stages including bibliographic research, protocol drafting, field work, data collection and analysis, paper drafting and submission. E. S. is the co-initiator of the study and participated in protocol drafting and manuscript proofreading. M. S. and A. T. K. contributed to field work and data collection.
Financial support
C. K. was supported by the Republic of Benin via ‘ PhD Student Support Program (PAD)’, edition 2018, and by the West African Economic and Monetary Union (UEMOA) via ‘Support of training and research for excellence, edition 2019–2020’. C. K. and E. S. were supported by the ONGs Eclosio & Louvain Coopération through the Program of ‘Multisectoral Support for Food and Nutritional Security in Atacora (AMSANA)’ which also contributed financially to this research work on fonio crop in Benin, from 2018 to 2019.
Conflict of interest
None.