1 Introduction
Driven by the recent development of micro air vehicles (MAVs), the unsteady aerodynamics of flapping wings has attracted the interest of the scientific community during recent decades. The operating conditions of MAVs are similar to those in which insects and small birds fly: the Reynolds (
 $Re$
) number of the flow is approximately 10–
 $10^{4}$
and the motion of the wings is characterized by moderate frequencies and high amplitudes (Shyy et al.
Reference Shyy, Aono, Kang and Liu2013). The manoeuvrability and performance of these animals are outstanding and, therefore, a deep insight into the aerodynamics of flapping flight is essential to improve the design of MAVs. In particular, it is important to understand how aerodynamic forces are generated and to use this knowledge for the improvement of simplified force models. There is a broad literature on the aerodynamics of flapping wings, as recently reviewed by several authors (Rozhdestvensky & Ryzhov Reference Rozhdestvensky and Ryzhov2003; von Ellenrieder, Parker & Soria Reference von Ellenrieder, Parker and Soria2008; Platzer et al.
Reference Platzer, Jones, Young and Lai2008; Shyy et al.
Reference Shyy, Aono, Chimakurthi, Trizila, Kang, Cesnik and Liu2010, Reference Shyy, Aono, Kang and Liu2013).
In order to improve the understanding of flapping wing aerodynamics, scientists have typically studied simplified configurations. Numerous authors have studied the problem of a 2D airfoil in pure heaving motion, in which the airfoil oscillates vertically with a zero angle of attack (Jones & Platzer Reference Jones and Platzer1997; Wang Reference Wang2000; Lewin & Haj-Hariri Reference Lewin and Haj-Hariri2003; Lua et al.
Reference Lua, Lim, Yeo and Oo2007; Wei & Zheng Reference Wei and Zheng2014; Choi, Colonius & Williams Reference Choi, Colonius and Williams2015). This simplified configuration is still a rich model where some of the main features of flapping flight are present, for example the leading and trailing edge vortices. The leading edge vortex (LEV) has been identified as the main lift enhancing mechanism of flapping wings (Ellington et al.
Reference Ellington, Van Den Berg, Willmott and Thomas1996). In fixed-wing aerodynamics, the generation of an LEV produces a high lift plateau for a short time span followed by a sudden drop of the aerodynamic force (Carr Reference Carr1988). This process is known as dynamic stall. Conversely, flapping wings take advantage of the high lift generated during the formation of the LEV by consecutively generating an LEV in each stroke. With this cyclic mechanism, the wing experiences the high transient lift from the generation of an LEV and avoids entering the dynamic stall region. Wang (Reference Wang2000) studied a heaving airfoil at
 $Re=1000$
by direct numerical simulations (DNS). She found that tuning of the motion parameters so that the time scales of the motion and the LEV are similar results in an optimal performance of the airfoil in terms of the aerodynamic forces. In an extensive numerical analysis on heaving airfoils at
 $Re=500$
, Lewin & Haj-Hariri (Reference Lewin and Haj-Hariri2003) explained how the interaction between the LEV and the trailing edge vortex (TEV) influences the propulsive efficiency of the airfoil. With the introduction of non-zero angle of attack, the airfoil may generate both thrust and lift. Heaving and pitching airfoils have also been studied extensively (Anderson et al.
Reference Anderson, Streitlien, Barret and Triantafyllou1998; Ramamurti & Sandberg Reference Ramamurti and Sandberg2001; Read, Hover & Triantafyllou Reference Read, Hover and Triantafyllou2003; Ashraf, Young & Lai Reference Ashraf, Young and Lai2011; Baik et al.
Reference Baik, Bernal, Granlund and Ol2012; Widmann & Tropea Reference Widmann and Tropea2015). Pitching modifies the flow around the airfoil and can, for some combinations of the motion parameters, increase the net value of thrust and the propulsive efficiency.
In order to obtain a deeper insight into the generation of forces by flapping airfoils, several authors have proposed various methods to decompose the total aerodynamic force into different contributions (Chang Reference Chang1992; Noca, Shiels & Jeon Reference Noca, Shiels and Jeon1999; Wu, Pan & Lu Reference Wu, Pan and Lu2005). These methods differ in the surface and volume integrals they involve, although it is possible to establish mathematical relations between them; see the appendix in Wang et al. (Reference Wang, Zhang, He and Liu2015). From a practical point of view, it seems to be desirable to have a method where the terms are easy to compute and have a clear physical meaning. Indeed, Wang et al. (Reference Wang, Zhang, He and Liu2015) proposed an approximate ‘simple lift formula’ decomposition, and compared it with the methods of Noca et al. (Reference Noca, Shiels and Jeon1999) and Wu et al. (Reference Wu, Pan and Lu2005), finding that added mass and circulatory effects were the main contributions to the aerodynamic force. This result is in agreement with the recent work of Martín-Alcántara, Fernandez-Feria & Sanmiguel-Rojas (Reference Martín-Alcántara, Fernandez-Feria and Sanmiguel-Rojas2015), who employed the decomposition method proposed by Chang (Reference Chang1992) on 2D DNS data for a heaving airfoil at
 $Re=500$
. Martín-Alcántara et al. (Reference Martín-Alcántara, Fernandez-Feria and Sanmiguel-Rojas2015) also observed that the contribution to the aerodynamic force of vortical structures that are a few chords away from the airfoil is negligible.
Analysis of the aerodynamic forces in terms of their various contributions could be used to predict the aerodynamic forces on a flapping wing from its geometry and kinematics. New models to estimate the aerodynamic forces could be generated and, also, existing models could be improved. Many such models exist since the pioneering work of Wagner (Reference Wagner1925) and Theodorsen (Reference Theodorsen1949), among others, and they have been recently reviewed by Ansari, Zbikowski & Knowles (Reference Ansari, Zbikowski and Knowles2006) and Taha, Hajj & Nayfeh (Reference Taha, Hajj and Nayfeh2012). For small-amplitude motions at high
 $Re$
, there is a complete theory based on potential flow that predicts the aerodynamic forces produced on a thin airfoil (Wagner Reference Wagner1925; Theodorsen Reference Theodorsen1949). A less restrictive approach is provided by unsteady vortex lattice methods (UVLMs). These methods present no restriction regarding the motion of the airfoil or its geometry (Long & Fritz Reference Long and Fritz2004). However, since UVLMs are also based on potential flow theory, they are not able to capture leading edge separation. Therefore, these methods need modifications to include the contribution of LEVs, as for example proposed by Ansari et al. (Reference Ansari, Zbikowski and Knowles2006). Despite the fact that modified UVLMs are computationally inexpensive compared with other methods like DNS, their cost might still be too high to predict the forces on the fly in the small processors installed in MAVs. This has motivated the development of even simpler models, like the model proposed by Dickinson, Lehmann & Sane (Reference Dickinson, Lehmann and Sane1999). This model is quasi-steady and uses algebraic expressions for the drag and lift coefficients as a function of the instantaneous angle of attack, capturing the effect of the LEV in the force coefficients. The algebraic expressions in the model were calibrated using experimental data. Another quasi-steady model was developed by Pesavento & Wang (Reference Pesavento and Wang2004), working with free falling plates. They estimated the total aerodynamic force by separately modelling the added mass, circulatory and viscous effects. In their work, they proposed an algebraic model for the circulation of an airfoil in which high angles of attack and rotational effects are included. A similar approach was followed by Taha, Hajj & Beran (Reference Taha, Hajj and Beran2014), but including the effect of the wake using the Wagner function and neglecting viscous effects.
With the aim of contributing to the improvement of simplified models for the aerodynamic forces, in this work we analyse DNS data for heaving and pitching airfoils, using the force decomposition method proposed by Chang (Reference Chang1992). Based on this analysis, we propose and test a simple model for the aerodynamic forces using the aforementioned force decomposition, and elements of the model proposed by Pesavento & Wang (Reference Pesavento and Wang2004). The database used in the present paper was first introduced in Moriche, Flores & García-Villalba (Reference Moriche, Flores and García-Villalba2015), and some of the cases in this database were analysed in Moriche, Flores & García-Villalba (Reference Moriche, Flores and García-Villalba2016), with emphasis on the development of 3D instabilities.
The paper is organized as follows. In § 2, the details of the numerical method, computational set-up and force decomposition method are presented. In § 3, the complete database is described in terms of mean and root mean square (r.m.s.) total aerodynamic force coefficients. In § 4, the force decomposition method is applied to a reference case and the main contributions to the force are modelled. After that, we extend the analysis to a subset of cases from the database in § 5, and to the whole database in § 6. Finally, some conclusions are provided in § 7.
2 Numerical method
We present DNS of the flow around a symmetric NACA 0012 airfoil in heaving and pitching motion. The Reynolds number of the flow based on the airfoil chord
 $c$
and the free stream velocity
 $U_{\infty }$
is
 $Re=c\,U_{\infty }/\unicode[STIX]{x1D708}=1000$
, where
 $\unicode[STIX]{x1D708}$
is the kinematic viscosity of the fluid. The simulations were performed using TUCAN, a second-order finite difference code that solves the Navier–Stokes equations for an incompressible flow (Moriche Reference Moriche2017). The presence of the body is modelled by the direct forcing immersed boundary method proposed by Uhlmann (Reference Uhlmann2005).
The prescribed heaving and pitching motion of the airfoil is given by
 $$\begin{eqnarray}\displaystyle & h(t)=h_{0}\cos (2\unicode[STIX]{x03C0}\,ft), & \displaystyle\end{eqnarray}$$
 $$\begin{eqnarray}\displaystyle & \unicode[STIX]{x1D703}(t)=\unicode[STIX]{x1D703}_{m}+\unicode[STIX]{x1D703}_{0}\cos (2\unicode[STIX]{x03C0}\,ft+\unicode[STIX]{x1D711}), & \displaystyle\end{eqnarray}$$
 $h_{0}$
and
 $\unicode[STIX]{x1D703}_{0}$
are the heaving and pitching amplitudes respectively,
 $\unicode[STIX]{x1D703}_{m}$
is the mean pitch value,
 $\unicode[STIX]{x1D711}$
is the phase shift between the heaving and pitching motion and
 $f$
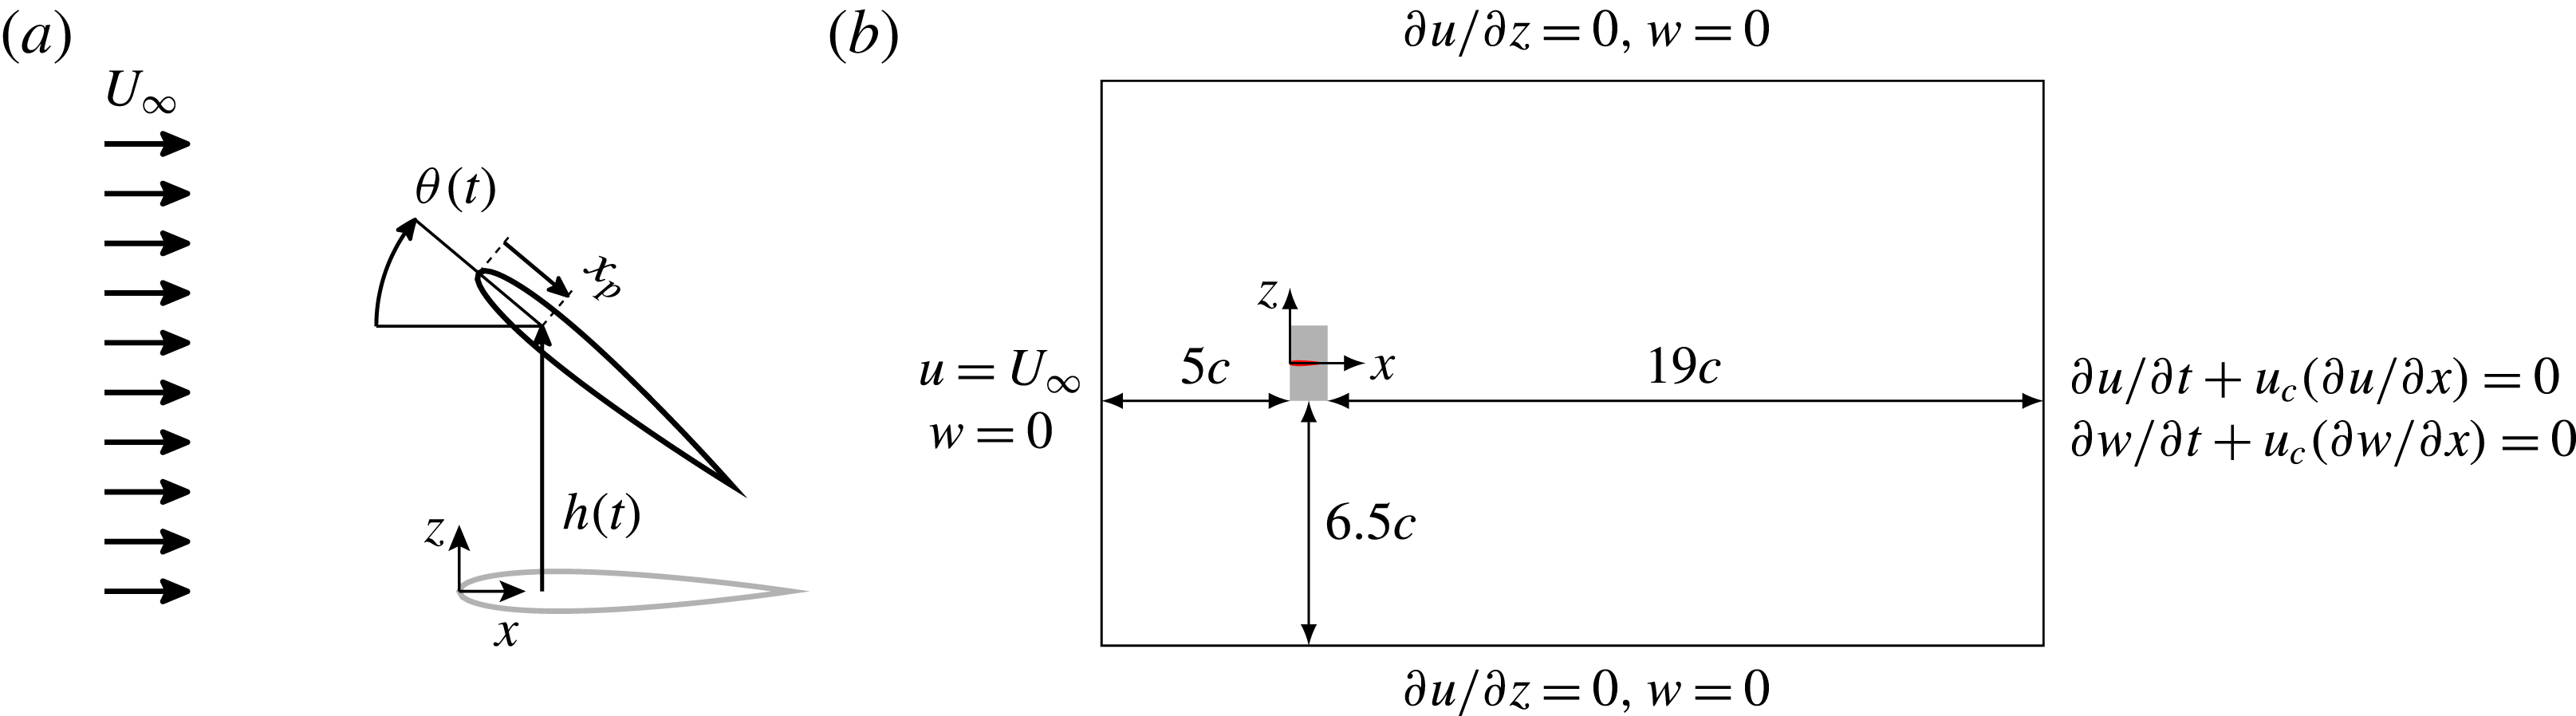
is the frequency of the motion. The pitching motion is a rotation around a point located at a distance
 $x_{p}$
from the leading edge, as can be observed in the sketch shown in figure 1(a). The set of non-dimensional parameters that define the problem (
 $h_{0}/c,\unicode[STIX]{x1D703}_{m},\unicode[STIX]{x1D703}_{0},\unicode[STIX]{x1D719},2\unicode[STIX]{x03C0}\,fc/U_{\infty },x_{p}/c,cU_{\infty }/\unicode[STIX]{x1D708}$
) results in a large parametric space, so we only vary two of them. The Reynolds number is
 $Re=1000$
and the pivoting point is located at the quarter of the chord (
 $x_{p}=c/4$
). The heaving amplitude is
 $h_{0}=c$
, the pitching amplitude is
 $\unicode[STIX]{x1D703}_{0}=30^{\circ }$
and the reduced frequency is
 $k=2\unicode[STIX]{x03C0}\,fc/U_{\infty }=1.41$
, resulting in a period of oscillation of
 $T=4.44c/U_{\infty }$
. It should be noted that there is some ambiguity in the literature about the definition of the reduced frequency. Some authors define it as
 $k=2\unicode[STIX]{x03C0}\,fc/U_{\infty }$
, while others as
 $k=\unicode[STIX]{x03C0}\,fc/U_{\infty }$
. Here, we have chosen the former. The effects of the mean pitch angle and the phase shift between heaving and pitching are explored, varying
 $\unicode[STIX]{x1D703}_{m}$
in the range
 $0^{\circ }$
–
 $20^{\circ }$
in steps of
 $\unicode[STIX]{x0394}\unicode[STIX]{x1D703}_{m}=10^{\circ }$
and
 $\unicode[STIX]{x1D711}$
from
 $30^{\circ }$
to
 $130^{\circ }$
in steps of
 $\unicode[STIX]{x0394}\unicode[STIX]{x1D711}=20^{\circ }$
, resulting in a database of 18 simulations.
(a) Sketch of the heaving and pitching motion of the airfoil. (b) Sketch of the computational domain. Here,
 $u$
and
 $w$
are the velocities in the
 $x$
and
 $z$
directions respectively and
 $u_{c}$
is the convective velocity. The airfoil is represented in red and the region in which the motion takes place in light grey.

All simulations are performed in a computational domain of dimensions
 $25c\times 15c$
in the streamwise and vertical directions respectively. The resolution used in this study is 128 points per chord, yielding a total of
 $3200\times 1920$
grid points in the streamwise and vertical directions respectively. This resolution was selected based on a grid refinement study for an NACA 0012 airfoil at
 $Re=1000$
set in heaving and pitching motion (see appendix A). The free stream condition is modelled by an inflow velocity
 $U_{\infty }$
at the inlet boundary, located
 $5c$
upstream of the leading edge of the airfoil. The outflow is modelled with an advective boundary condition at the outlet, located
 $19c$
downstream of the trailing edge of the airfoil. A free slip boundary condition is imposed at the lateral boundaries (see figure 1
b).
The total aerodynamic force
 $\boldsymbol{F}$
is decomposed using the algorithm proposed by Chang (Reference Chang1992) and recently used by Martín-Alcántara et al. (Reference Martín-Alcántara, Fernandez-Feria and Sanmiguel-Rojas2015). The total aerodynamic force components in the streamwise (
 $x$
) and vertical (
 $z$
) directions are expressed as
 $$\begin{eqnarray}\displaystyle F_{x} & = & \displaystyle -\unicode[STIX]{x1D70C}\int _{S}\frac{\unicode[STIX]{x1D719}_{x}}{U_{\infty }}\frac{\unicode[STIX]{x2202}\boldsymbol{u}}{\unicode[STIX]{x2202}t}\boldsymbol{\cdot }\boldsymbol{n}\,\text{d}S+\frac{\unicode[STIX]{x1D70C}}{2}\int _{S}|\boldsymbol{u}|^{2}\boldsymbol{n}\boldsymbol{\cdot }\boldsymbol{e}_{x}\,\text{d}S-\unicode[STIX]{x1D70C}\int _{V}(\boldsymbol{u}\times \unicode[STIX]{x1D74E})\boldsymbol{\cdot }\frac{\unicode[STIX]{x1D735}\unicode[STIX]{x1D719}_{x}}{U_{\infty }}\,\text{d}V\nonumber\\ \displaystyle & & \displaystyle +\,\unicode[STIX]{x1D707}\int _{S}(\unicode[STIX]{x1D74E}\times \boldsymbol{n})\boldsymbol{\cdot }\left(\frac{\unicode[STIX]{x1D735}\unicode[STIX]{x1D719}_{x}}{U_{\infty }}+\boldsymbol{e}_{x}\right)\text{d}S,\end{eqnarray}$$
 $$\begin{eqnarray}\displaystyle F_{z} & = & \displaystyle -\unicode[STIX]{x1D70C}\int _{S}\frac{\unicode[STIX]{x1D719}_{z}}{U_{\infty }}\frac{\unicode[STIX]{x2202}\boldsymbol{u}}{\unicode[STIX]{x2202}t}\boldsymbol{\cdot }\boldsymbol{n}\,\text{d}S+\frac{\unicode[STIX]{x1D70C}}{2}\int _{S}|\boldsymbol{u}|^{2}\boldsymbol{n}\boldsymbol{\cdot }\boldsymbol{e}_{z}\,\text{d}S-\unicode[STIX]{x1D70C}\int _{V}(\boldsymbol{u}\times \unicode[STIX]{x1D74E})\boldsymbol{\cdot }\frac{\unicode[STIX]{x1D735}\unicode[STIX]{x1D719}_{z}}{U_{\infty }}\,\text{d}V\nonumber\\ \displaystyle & & \displaystyle +\,\unicode[STIX]{x1D707}\int _{S}(\unicode[STIX]{x1D74E}\times \boldsymbol{n})\boldsymbol{\cdot }\left(\frac{\unicode[STIX]{x1D735}\unicode[STIX]{x1D719}_{z}}{U_{\infty }}+\boldsymbol{e}_{z}\right)\text{d}S,\end{eqnarray}$$
 $\boldsymbol{u}$
is the velocity of the flow,
 $\unicode[STIX]{x1D74E}$
is the vorticity,
 $\unicode[STIX]{x1D707}$
is the dynamic viscosity of the fluid,
 $S$
the surface of the airfoil,
 $V$
is the fluid domain,
 $\boldsymbol{n}$
is the unitary vector normal to the surface of the airfoil, pointing towards the fluid, and
 $\boldsymbol{e}_{x}$
and
 $\boldsymbol{e}_{z}$
are the unitary vectors in the
 $x$
and
 $z$
directions respectively. The auxiliary potentials
 $\unicode[STIX]{x1D719}_{x}$
and
 $\unicode[STIX]{x1D719}_{z}$
that appear in (2.2) depend only on the geometry of the airfoil and on the directions in which they are computed. For details on the calculations of these potentials, the reader is referred to appendix B.
Following Chang (Reference Chang1992), we group the terms of (2.2) to identify three different contributions to the aerodynamic forces,
 $$\begin{eqnarray}\boldsymbol{F}=\boldsymbol{F}^{m}+\boldsymbol{F}^{v}+\boldsymbol{F}^{s}.\end{eqnarray}$$
The first two terms of the right-hand side in (2.2) represent the contribution due to the motion of the body,
 $\boldsymbol{F}^{m}$
. The contribution of the vorticity within the flow,
 $\boldsymbol{F}^{v}$
, is given by the third term. Finally, the surface vorticity contribution,
 $\boldsymbol{F}^{s}$
, is the last term of (2.2).
The decomposition described in (2.2) presents some advantages with respect to other algorithms found in the literature. First, the contribution of the body motion is calculated with surface integrals that only involve the velocity of the flow and the auxiliary potential functions, both on the surface of the airfoil. Hence, the contribution for
 $\boldsymbol{F}^{m}$
is prescribed by the geometry and the kinematics of the airfoil, and can be computed a priori (see § 4). Second, the only time derivative of the fluid velocity in (2.2) appears in a surface integral, so that
 $\unicode[STIX]{x2202}\boldsymbol{u}/\unicode[STIX]{x2202}t$
can be evaluated from the kinematics of the airfoil. This means that this force decomposition algorithm can be applied to isolated snapshots of the velocity field, e.g. obtained from particle image velocimetry measurements. Finally, the integrand of the contribution of the vorticity within the flow can be interpreted as a force density, allowing a direct evaluation of how specific vortices within the flow contribute to the total aerodynamic force.
The aerodynamic forces in (2.2) can be made dimensionless using the density
 $\unicode[STIX]{x1D70C}$
, the free stream velocity
 $U_{\infty }$
and the chord
 $c$
, resulting in the non-dimensional coefficients of thrust (
 $c_{t}$
) and lift (
 $c_{l}$
),
 $$\begin{eqnarray}c_{t}=\frac{-2F_{x}}{\unicode[STIX]{x1D70C}U_{\infty }^{2}c},\quad c_{l}=\frac{2F_{z}}{\unicode[STIX]{x1D70C}U_{\infty }^{2}c}.\end{eqnarray}$$
Analogously to (2.3), the total non-dimensional force coefficients are split into
 $$\begin{eqnarray}\displaystyle & c_{t}=c_{t}^{m}+c_{t}^{v}+c_{t}^{s}, & \displaystyle\end{eqnarray}$$
 $$\begin{eqnarray}\displaystyle & c_{l}=c_{l}^{m}+c_{l}^{v}+c_{l}^{s}. & \displaystyle\end{eqnarray}$$
 $\unicode[STIX]{x1D6FF}_{t}$
and lift
 $\unicode[STIX]{x1D6FF}_{l}$
as the integrand of the contribution of the vorticity within the flow to the total aerodynamic force in (2.2). After non-dimensionalization, the definitions of
 $\unicode[STIX]{x1D6FF}_{t}$
and
 $\unicode[STIX]{x1D6FF}_{l}$
read as
 $$\begin{eqnarray}\displaystyle & \displaystyle \unicode[STIX]{x1D6FF}_{t}=\frac{2(\boldsymbol{u}\times \unicode[STIX]{x1D74E})\boldsymbol{\cdot }\unicode[STIX]{x1D735}\unicode[STIX]{x1D719}_{x}}{U_{\infty }^{3}/c}, & \displaystyle\end{eqnarray}$$
 $$\begin{eqnarray}\displaystyle & \displaystyle \unicode[STIX]{x1D6FF}_{l}=\frac{-2(\boldsymbol{u}\times \unicode[STIX]{x1D74E})\boldsymbol{\cdot }\unicode[STIX]{x1D735}\unicode[STIX]{x1D719}_{z}}{U_{\infty }^{3}/c}. & \displaystyle\end{eqnarray}$$
 $g(t)$
as
 $$\begin{eqnarray}\overline{g}=\frac{1}{T_{av}}\int _{0}^{T_{av}}g(t)\,\text{d}t,\end{eqnarray}$$
where
 $T_{av}$
is the time span for the averaging process. Finally, the r.m.s. of the fluctuation of
 $g(t)$
is defined as
 $$\begin{eqnarray}g^{\prime }=\sqrt{\frac{1}{T_{av}}\int _{0}^{T_{av}}(g(t)^{2}-\overline{g}^{2})\,\text{d}t}.\end{eqnarray}$$
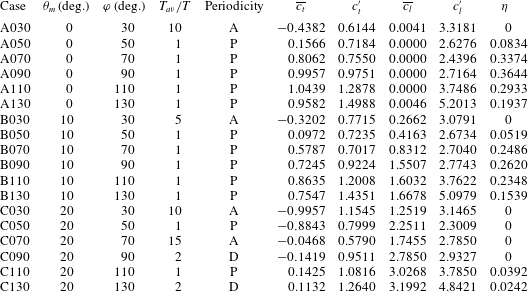
Motion parameters and integrated values of the non-dimensional force coefficients of thrust and lift for all of the cases. The periodicity of the flow is indicated with P for periodic, D for periodic with period
 $2T$
and A for aperiodic.

3 Aerodynamic forces
Table 1 shows the averaged and r.m.s. values of the thrust and lift coefficients for the 18 cases described in § 2, together with the propulsive efficiency
 $$\begin{eqnarray}\unicode[STIX]{x1D702}=\frac{T_{av}\overline{F}_{x}U_{\infty }}{\displaystyle \int _{0}^{T_{av}}(F_{z}{\dot{h}}+M_{y,c/4}\dot{\unicode[STIX]{x1D703}})\,\text{d}t},\end{eqnarray}$$
where
 $M_{y,c/4}$
is the pitching moment about the quarter of the chord (coincident with the hinge point). It should be noted that the propulsive efficiency is set to zero for cases with net drag, avoiding meaningless negative values. The cases are identified by a letter (A, B or C) related to the value of
 $\unicode[STIX]{x1D703}_{m}$
(
 $0^{\circ }$
,
 $10^{\circ }$
or
 $20^{\circ }$
respectively), followed by three digits that correspond to the value of
 $\unicode[STIX]{x1D711}$
. Table 1 also shows that most of the cases present the same periodicity in the flow and forces as in the motion, with period
 $TU_{\infty }/c=4.44$
. However, there are two cases with a doubling period phenomenon and four cases that are aperiodic. Therefore, the time span for the averaging
 $T_{av}$
for the mean and r.m.s. coefficients of each case has been selected accordingly, as seen in the fourth column in table 1. The appearance of aperiodic behaviour has been previously observed by other authors, for example by Lewin & Haj-Hariri (Reference Lewin and Haj-Hariri2003) in pure heaving cases.
Plot of
 $\overline{c}_{l}$
versus
 $\overline{c}_{t}$
for all cases in the database. The colour corresponds to the propulsive efficiency,
 $\unicode[STIX]{x1D702}$
. Solid (dashed) lines connect cases with constant mean pitch value
 $\unicode[STIX]{x1D703}_{m}$
(phase shift
 $\unicode[STIX]{x1D711}$
).

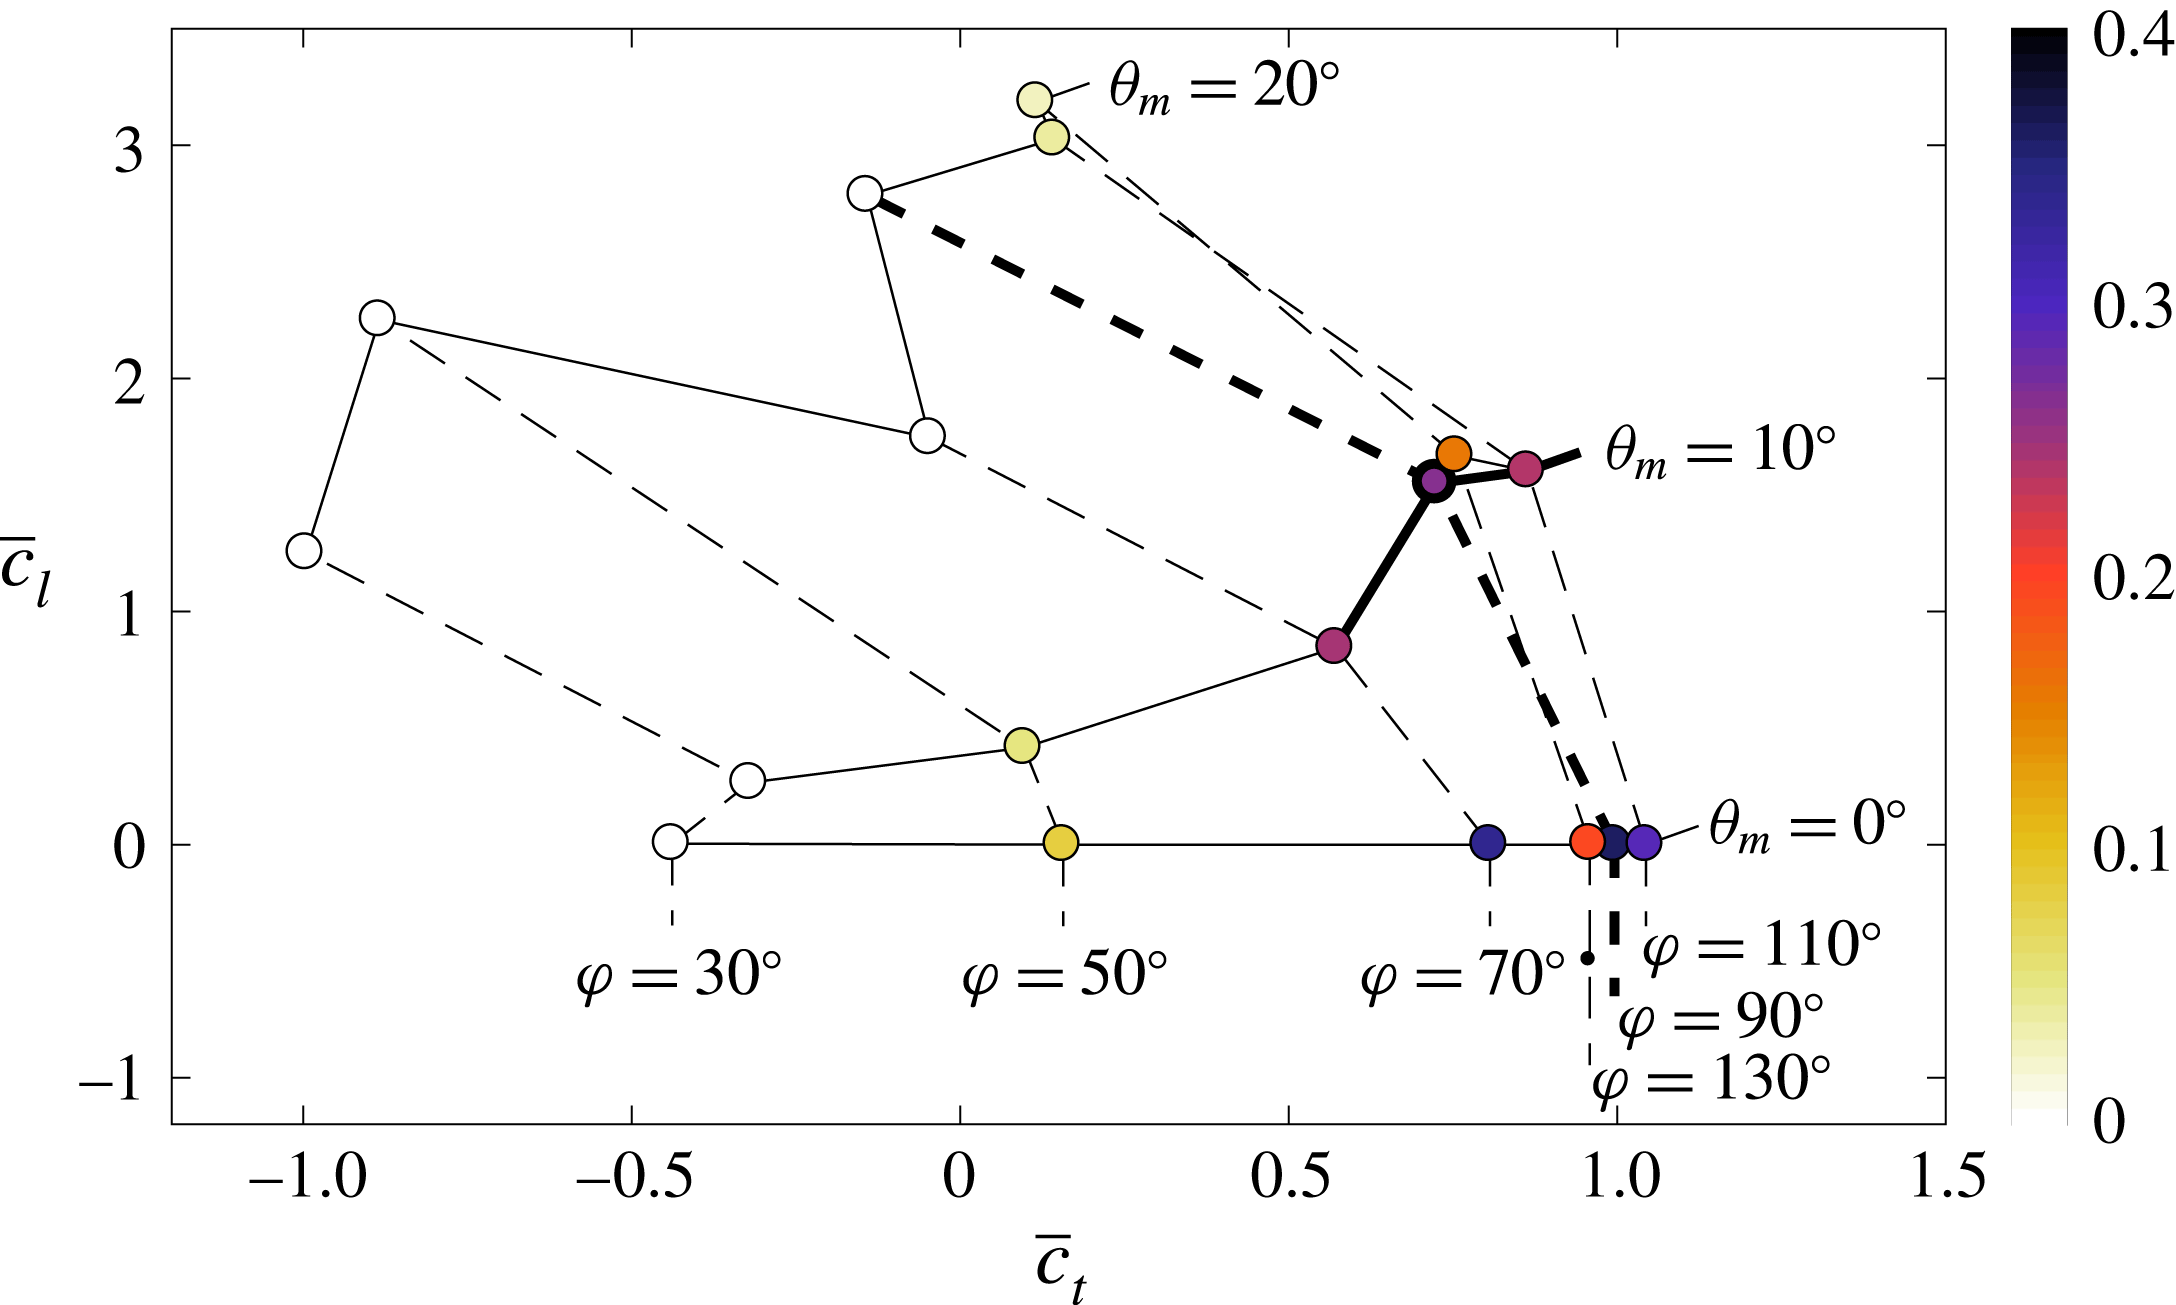
A graphical representation of the data in table 1 is provided in figure 2, where each case is represented by a point in the
 $\overline{c}_{t}$
,
 $\overline{c}_{l}$
phase space. It can be seen that when the phase shift is fixed, an increase of the mean pitch value results in an increase of lift and a reduction of thrust (dashed lines in figure 2). When the mean pitch value is fixed (solid lines in figure 2),
 $\overline{c}_{t}$
and
 $\overline{c}_{l}$
tend to increase with
 $\unicode[STIX]{x1D711}$
. For moderate mean pitch angles, maximum propulsive efficiency is achieved for
 $\unicode[STIX]{x1D711}\approx 90^{\circ }$
, while maximum force coefficients are obtained for slightly larger phase shifts,
 $\unicode[STIX]{x1D711}\approx 110^{\circ }$
, consistent with the results of Anderson et al. (Reference Anderson, Streitlien, Barret and Triantafyllou1998). More specifically, for a mean pitch value
 $\unicode[STIX]{x1D703}_{m}$
equal to
 $0^{\circ }$
or
 $10^{\circ }$
, the maximum thrust is obtained for a phase shift
 $\unicode[STIX]{x1D711}=110^{\circ }$
. The highest propulsive efficiency is 36 %, obtained for
 $\unicode[STIX]{x1D703}_{m}=0^{\circ }$
and a phase shift of
 $\unicode[STIX]{x1D711}=90^{\circ }$
. Moreover, cases with
 $\unicode[STIX]{x1D703}_{m}=10^{\circ }$
and
 $\unicode[STIX]{x1D711}=90^{\circ }{-}110^{\circ }$
yield relatively high
 $\overline{c_{t}}$
and
 $\overline{c_{l}}$
, with propulsive efficiencies higher than 20 %. Finally, it should be noted that for
 $\unicode[STIX]{x1D703}_{m}=20^{\circ }$
, the propulsive efficiencies are considerably lower, with higher lift coefficients and a tendency to lose periodicity.
We select case B090 as a reference case to perform a more detailed analysis. This choice is motivated by the fact that B090 provides both thrust and lift with a relatively high propulsive efficiency,
 $\unicode[STIX]{x1D702}=26\,\%$
, so it is interesting in terms of aerodynamic performance. Moreover, by varying the phase shift or the mean pitch value of case B090, a subset of cases from the database can be defined, which allows analysis of the influence of the motion parameters on the aerodynamic forces. This subset of cases is represented in figure 2 with thicker solid and dashed lines, and it includes cases A090, C090, B070 and B110.
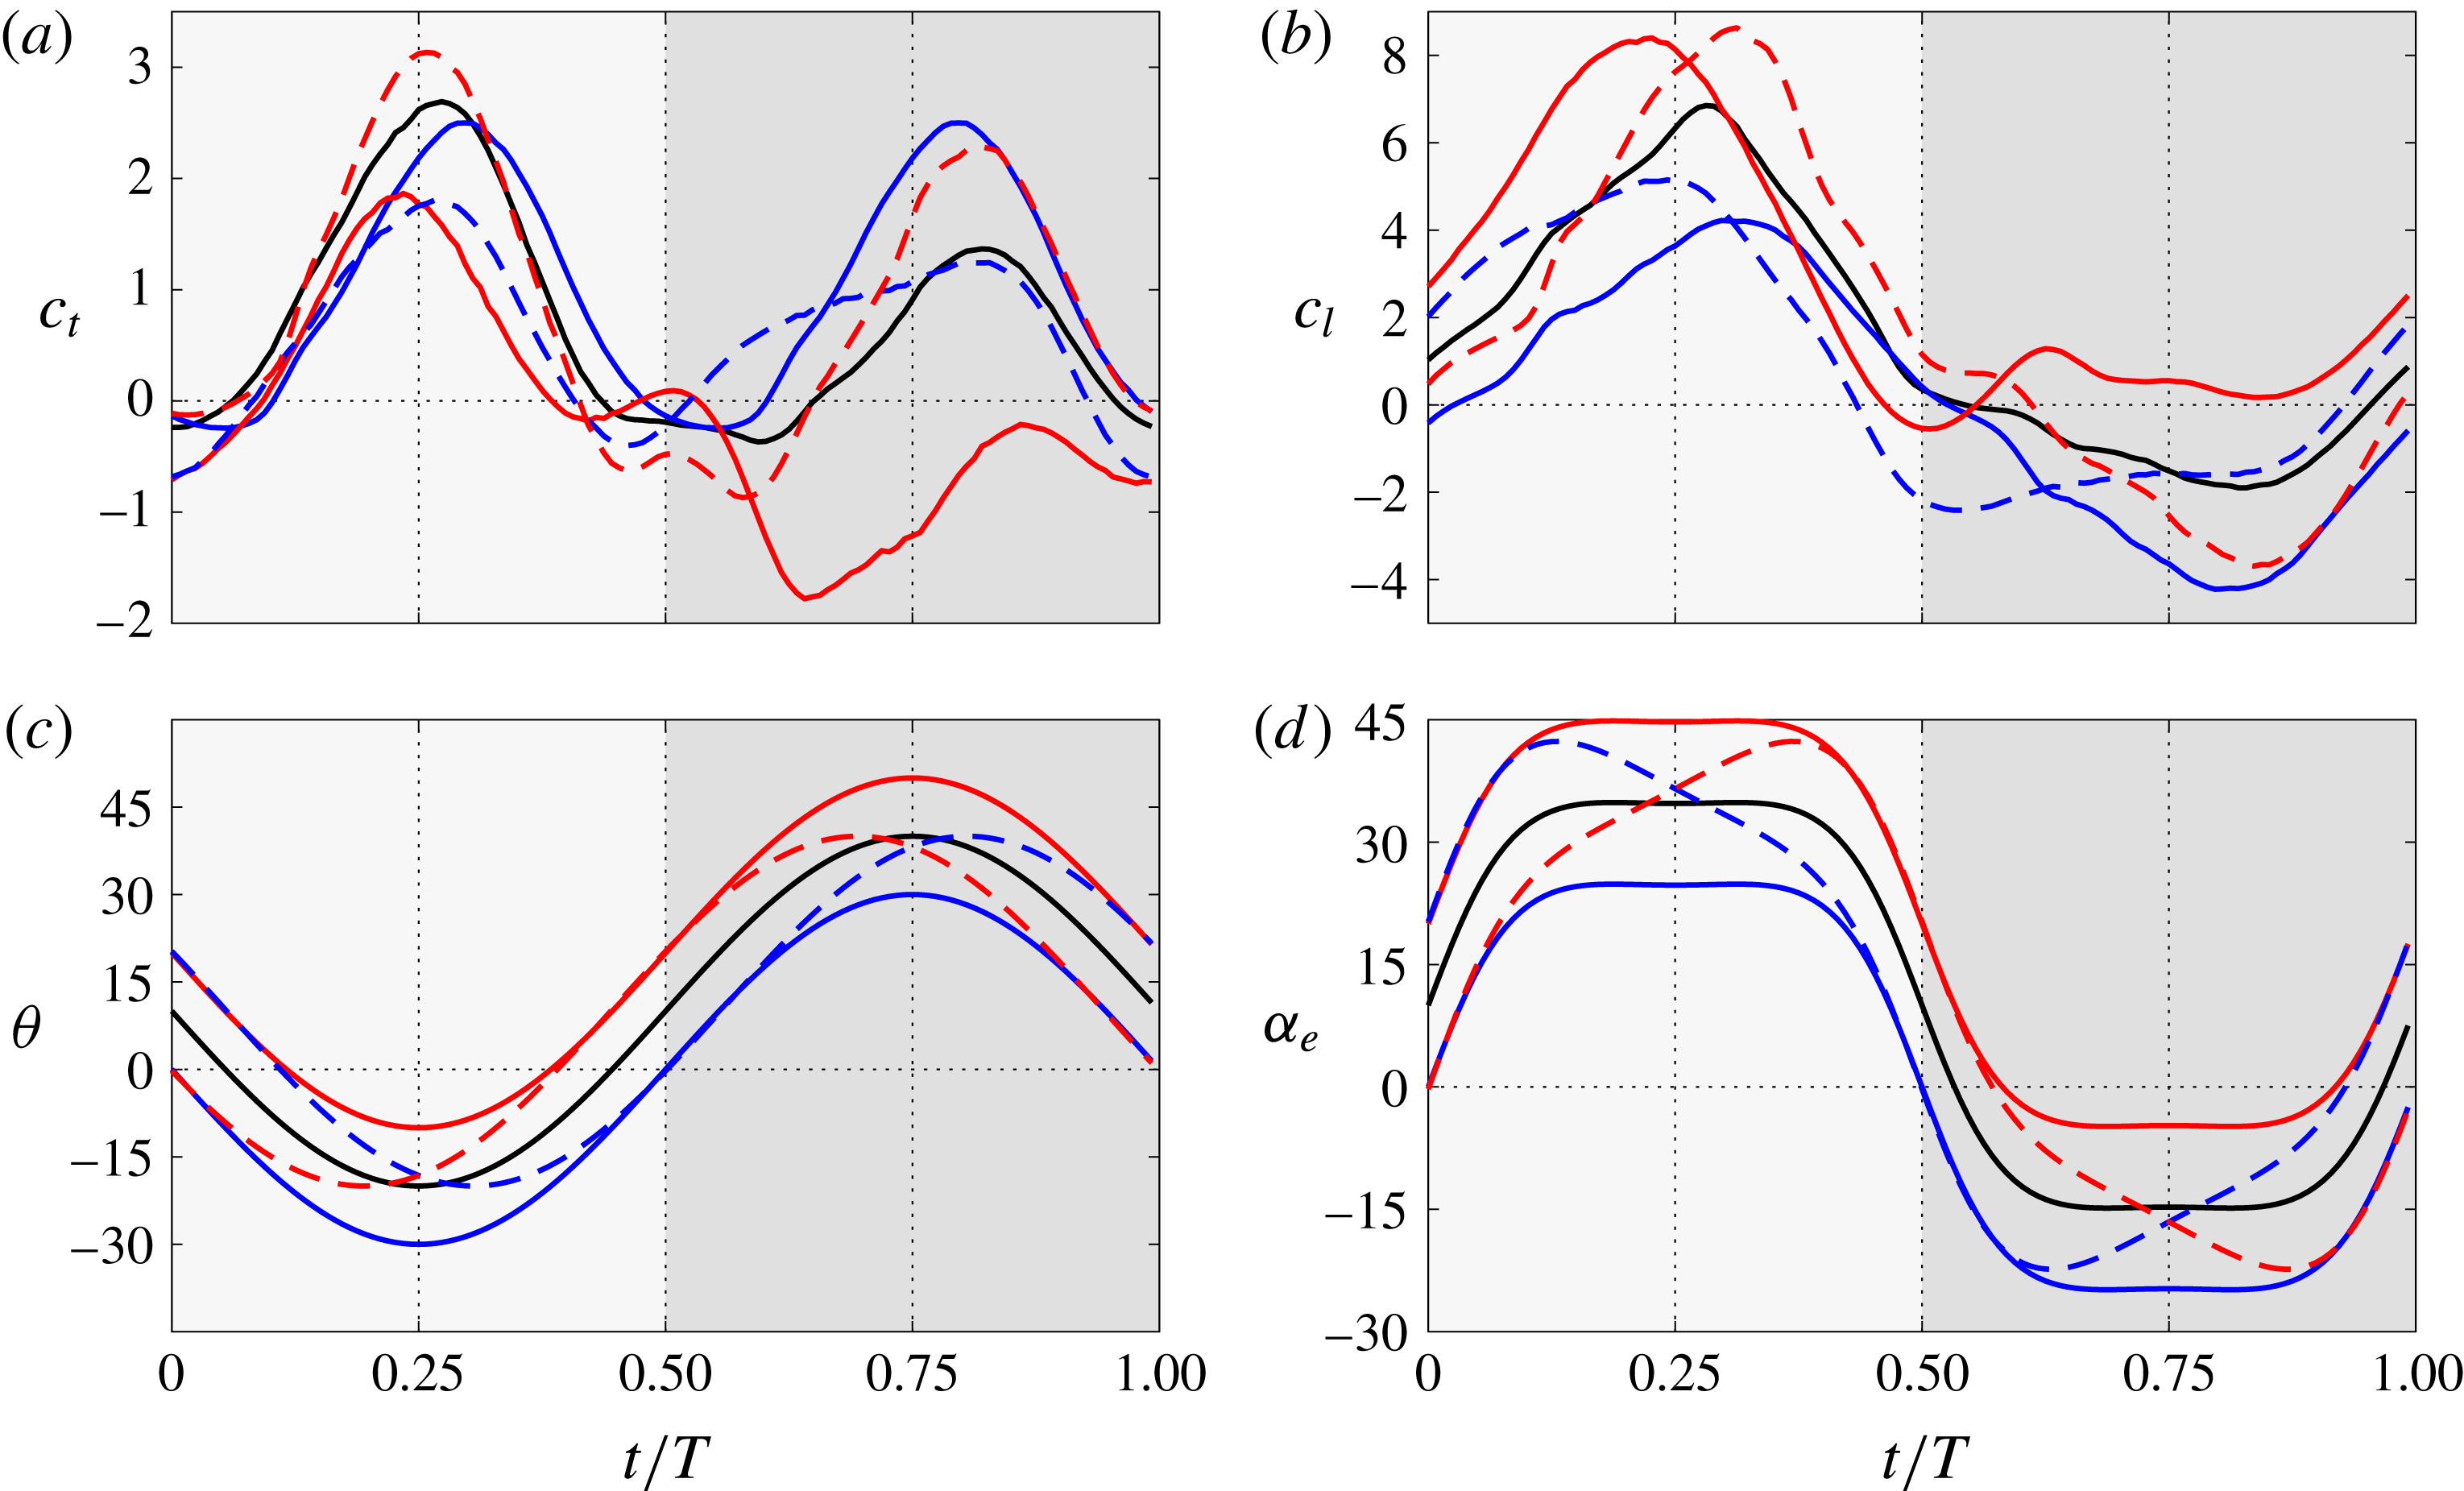
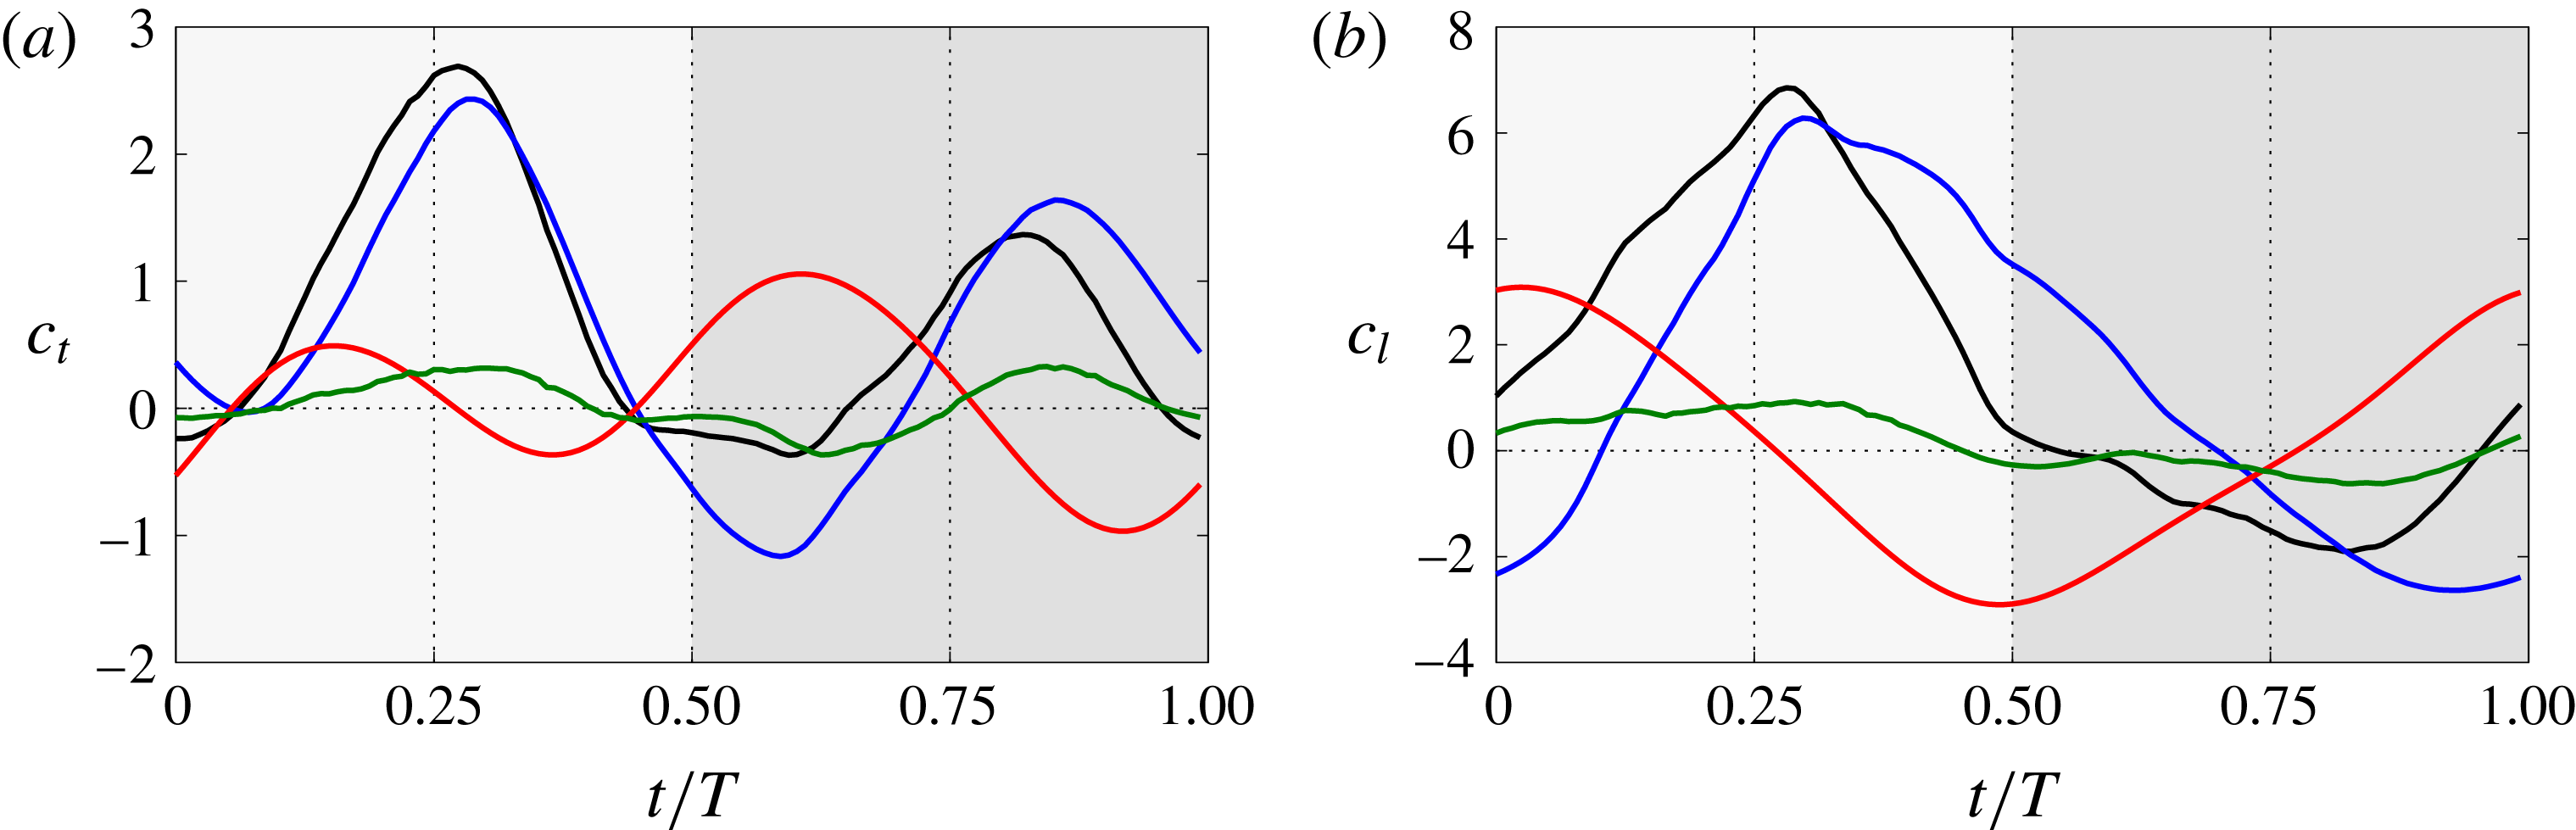
(a) Thrust and (b) lift coefficients of the selected cases with respect to the reference case B090 (——, black). (c) Pitch angle of the airfoil and (d) effective angle of attack (in degrees). Cases where
 $\unicode[STIX]{x1D703}_{m}$
is modified are represented with solid lines, case A090 (——, blue) and case C090 (——, red), and cases where
 $\unicode[STIX]{x1D711}$
is modified are represented with dashed lines, case B070 (– – –, blue) and case B110 (– – –, red). The downstroke (upstroke) is indicated by a light (dark) grey background.

In the reference case B090, the net thrust and lift (
 $\overline{c}_{t}=0.72$
,
 $\overline{c}_{l}=1.55$
) are of the same order of magnitude as the r.m.s. of the force fluctuations (
 $c_{t}^{\prime }=0.92$
,
 $c_{l}^{\prime }=2.77$
). This reflects the fact that the oscillatory component of the force is as important as its mean value. For case B090, figures 3(a) and 3(b) show the time evolution of
 $c_{t}$
and
 $c_{l}$
respectively during one period. Two peaks of thrust (figure 3
a) are generated during the period, one in the downstroke and one in the upstroke, with a larger magnitude in the former. Regarding the lift (figure 3
b), the large lift generated in the downstroke is partially counteracted by the negative lift produced in the upstroke.
The influence of the mean pitch angle is analysed in detail by comparing cases A090, B090 and C090, which have a constant phase shift
 $\unicode[STIX]{x1D711}$
of
 $90^{\circ }$
and a mean pitch value
 $\unicode[STIX]{x1D703}_{m}$
of
 $0^{\circ }$
,
 $10^{\circ }$
and
 $20^{\circ }$
respectively. If the mean pitch value
 $\unicode[STIX]{x1D703}_{m}$
is set to zero (case A090), the performance of the airfoil is improved with respect to case B090 (
 $\unicode[STIX]{x1D703}_{m}=10^{\circ }$
) in terms of net thrust, but at the cost of producing zero net lift. The
 $\overline{c}_{t}$
generated by case A090 is increased by 37.5 % with respect to B090 and the propulsive efficiency by 40 %. Conversely, if the mean pitch value
 $\unicode[STIX]{x1D703}_{m}$
is increased to
 $20^{\circ }$
(case C090), a larger lift is generated (
 $\overline{c}_{l}=2.8$
), at the cost of producing a small net drag (
 $\overline{c}_{t}=-0.15$
). Concerning the variation of the force during the period, the r.m.s. values of lift and thrust are comparable to the mean values, as in the reference case. Moreover,
 $c_{t}^{\prime }$
and
 $c_{l}^{\prime }$
are roughly insensitive to variations of the mean pitch value, with
 $c_{t}^{\prime }\approx 0.9$
and
 $c_{l}^{\prime }\approx 2.8$
for cases A090, B090 and C090. In terms of the instantaneous forces, figure 3(a) shows that, during the downstroke, the thrust generated in case A090 (
 $\unicode[STIX]{x1D703}_{m}=0^{\circ }$
) is similar to the thrust generated in case B090 (
 $\unicode[STIX]{x1D703}_{m}=10^{\circ }$
). However, during the upstroke, the thrust generated is notably larger in case A090 compared with case B090. Conversely, case C090 (
 $\unicode[STIX]{x1D703}_{m}=20^{\circ }$
) generates less thrust during the whole period, with negative values of
 $c_{t}(t)$
during the upstroke, resulting in net drag. The behaviour of the instantaneous lift coefficient (figure 3
b) is roughly the opposite, increasing with
 $\unicode[STIX]{x1D703}_{m}$
during the whole period, except in the transition from downstroke to upstroke. This transition is marked by a drop in
 $c_{l}$
associated with the detachment of the LEV, which occurs earlier for the cases with higher
 $\unicode[STIX]{x1D703}_{m}$
. Overall, the variation of
 $c_{l}$
and
 $c_{t}$
with
 $\unicode[STIX]{x1D703}_{m}$
is consistent with an increase of the total force as
 $\unicode[STIX]{x1D703}_{m}$
increases, coupled with a change of the orientation of that force, which is tilted backwards as
 $\unicode[STIX]{x1D703}_{m}$
increases.
The effect of the phase shift on the aerodynamic forces is less intuitive. This effect is analysed by comparing cases B070, B090 and B110, which have a constant mean pitch value
 $\unicode[STIX]{x1D703}_{m}$
of
 $10^{\circ }$
and a phase shift
 $\unicode[STIX]{x1D711}$
of
 $70^{\circ }$
,
 $90^{\circ }$
and
 $110^{\circ }$
respectively. A lag in the pitching motion (
 $\unicode[STIX]{x1D711}<90^{\circ }$
, as in case B070) results in lower mean forces, especially for the mean lift coefficient. On the other hand, an advance of the pitching motion (
 $\unicode[STIX]{x1D711}>90^{\circ }$
, as in case B110) results in higher net thrust and lift. Besides the change in the mean values, the main effect of the phase shift on the instantaneous force coefficients is an increase of the amplitude of the force perturbations with
 $\unicode[STIX]{x1D711}$
. This can be observed both in figure 3(a,b) and in the
 $c_{t}^{\prime }$
and
 $c_{l}^{\prime }$
values reported in table 1. Finally, it is clear from figure 3(a) that
 $\unicode[STIX]{x1D711}$
also modifies the time at which the lift coefficients are maximum. This effect on the lift can be partly explained by the evolution of the effective angle of attack
 $\unicode[STIX]{x1D6FC}_{e}=\unicode[STIX]{x1D703}-\text{arctan}({\dot{h}}/U_{\infty })$
, shown in figure 3(d). For
 $\unicode[STIX]{x1D711}>90^{\circ }$
(B110), the peaks of
 $\unicode[STIX]{x1D6FC}_{e}$
are delayed in time with respect to B090. As a consequence, the peaks of
 $c_{l}$
occur later for B110 than for B090. On the other hand, for
 $\unicode[STIX]{x1D711}<90^{\circ }$
(B070), the peaks of
 $\unicode[STIX]{x1D6FC}_{e}$
and
 $c_{l}$
are advanced with respect to B090. It should be noted that a similar trend is not apparent at the times when
 $c_{t}$
is maximum, which are fairly independent of the phase shift. The reason for this is the importance of the pitch angle in the orientation of the resulting aerodynamic force: if we assume that the aerodynamic forces are mostly perpendicular to the airfoil (an assumption that will be justified later), then the variation in the pitch angle during the upstroke or downstroke between cases B070, B090 and B110 results in a small effect for the lift (which is multiplied by
 $\cos \unicode[STIX]{x1D703}$
), but a larger effect on the thrust (which is multiplied by
 $\sin \unicode[STIX]{x1D703}$
). It should be noted that for these cases, the pitch angle
 $\unicode[STIX]{x1D703}$
, shown in figure 3(c), is such that
 $\cos \unicode[STIX]{x1D703}\sim 1$
and
 $\sin \unicode[STIX]{x1D703}\sim \unicode[STIX]{x1D703}$
. As a consequence, the lift is dominated by
 $\unicode[STIX]{x1D6FC}_{e}$
while the thrust depends on both
 $\unicode[STIX]{x1D6FC}_{e}$
and
 $\unicode[STIX]{x1D703}$
.
4 Force decomposition and modelling of case B090
Following the procedure described in § 2, we decompose the total aerodynamic force of case B090. Figure 4 shows the evolution of the total thrust and lift, together with the contributions from body motion,
 $\boldsymbol{F}^{m}$
, vorticity within the flow,
 $\boldsymbol{F}^{v}$
, and surface vorticity,
 $\boldsymbol{F}^{s}$
, during one period of case B090. The main contribution to the total aerodynamic force corresponds to the vorticity within the flow, with peak values of the same order of magnitude as the total value of the force. Body motion also has an important role in the generation of force, producing peak values of around half of the peak values of the total aerodynamic force. Finally, surface vorticity (viscous effect) is the least important contribution, with peak values approximately 10 times smaller than the total force peak values. Therefore, in the following, we will focus on analysis of the contributions from body motion and the vorticity within the flow.
(a) Thrust and (b) lift coefficients of case B090. The curves represented correspond to the total aerodynamic force (
 $c_{l},c_{t}$
; ——, black) and contributions from body motion (
 $c_{l}^{m},c_{t}^{m}$
; ——, red), vorticity within the flow (
 $c_{l}^{v},c_{t}^{v}$
; ——, blue) and surface vorticity (
 $c_{l}^{s},c_{t}^{s}$
; ——, green). The downstroke (upstroke) is indicated by a light (dark) grey background.

We start with the contribution of the body motion to the total force,
 $\boldsymbol{F}^{m}$
, which is the force produced by the fluid to counteract the motion of the airfoil. This is easily observed in figure 4(b): when
 $\ddot{h}<0$
,
 $c_{l}^{m}$
is a positive vertical force, and vice versa. The thrust (figure 4
a) is influenced by both the vertical acceleration and the projected area of the airfoil perpendicular to the streamwise direction. For the motion parameters of this case (
 $\unicode[STIX]{x1D703}_{m}=10^{\circ }$
,
 $\unicode[STIX]{x1D711}=90^{\circ }$
), the projected area during the downstroke is smaller than the projected area during the upstroke, resulting in higher peaks of
 $c_{t}^{m}$
in the latter.
From a physical point of view,
 $\boldsymbol{F}^{m}$
is similar to the added-mass term of the aerodynamic forces in unsteady potential flow. However, they are not exactly the same. This is shown here for a flat plate with
 $x_{p}=c/2$
. According to Sedov (Reference Sedov1965), the added-mass forces for this configuration are
 $$\begin{eqnarray}\displaystyle & \displaystyle c_{t}^{a}=\frac{\unicode[STIX]{x03C0}}{4}\frac{\ddot{h}}{U_{\infty }^{2}/c}\sin (2\unicode[STIX]{x1D703})+\frac{\unicode[STIX]{x03C0}}{2}\frac{{\dot{h}}}{U_{\infty }}\frac{\dot{\unicode[STIX]{x1D703}}}{U_{\infty }/c}\cos ^{2}(\unicode[STIX]{x1D703})-\frac{\unicode[STIX]{x03C0}}{4}\left(\frac{\dot{\unicode[STIX]{x1D703}}^{2}}{U_{\infty }^{2}/c^{2}}\cos \unicode[STIX]{x1D703}+\frac{\ddot{\unicode[STIX]{x1D703}}}{U_{\infty }^{2}/c^{2}}\sin \unicode[STIX]{x1D703}\right), & \displaystyle \nonumber\\ \displaystyle & & \displaystyle\end{eqnarray}$$
 $$\begin{eqnarray}\displaystyle & \displaystyle c_{l}^{a}=-\frac{\unicode[STIX]{x03C0}}{2}\frac{\ddot{h}}{U_{\infty }^{2}/c}\cos ^{2}\unicode[STIX]{x1D703}+\frac{\unicode[STIX]{x03C0}}{4}\frac{{\dot{h}}}{U_{\infty }}\frac{\dot{\unicode[STIX]{x1D703}}}{U_{\infty }/c}\sin (2\unicode[STIX]{x1D703})+\frac{\unicode[STIX]{x03C0}}{4}\left(\frac{\ddot{\unicode[STIX]{x1D703}}}{U_{\infty }^{2}/c^{2}}\cos \unicode[STIX]{x1D703}-\frac{\dot{\unicode[STIX]{x1D703}}^{2}}{U_{\infty }^{2}/c^{2}}\sin \unicode[STIX]{x1D703}\right). & \displaystyle \nonumber\\ \displaystyle & & \displaystyle\end{eqnarray}$$
 $c_{t}^{m}$
and
 $c_{l}^{m}$
are
 $$\begin{eqnarray}\displaystyle & \displaystyle c_{t}^{m}=\frac{\unicode[STIX]{x03C0}}{4}\frac{\ddot{h}}{U_{\infty }^{2}/c}\sin (2\unicode[STIX]{x1D703}), & \displaystyle\end{eqnarray}$$
 $$\begin{eqnarray}\displaystyle & \displaystyle c_{l}^{m}=-\frac{\unicode[STIX]{x03C0}}{2}\frac{\ddot{h}}{U_{\infty }^{2}/c}\cos ^{2}\unicode[STIX]{x1D703}, & \displaystyle\end{eqnarray}$$
 $\dot{\unicode[STIX]{x1D703}}$
and
 $\ddot{\unicode[STIX]{x1D703}}$
. Moreover, for periodic motions, the mean value of the added-mass coefficients is
 $\overline{c}_{l}^{a}=\overline{c}_{t}^{a}=0$
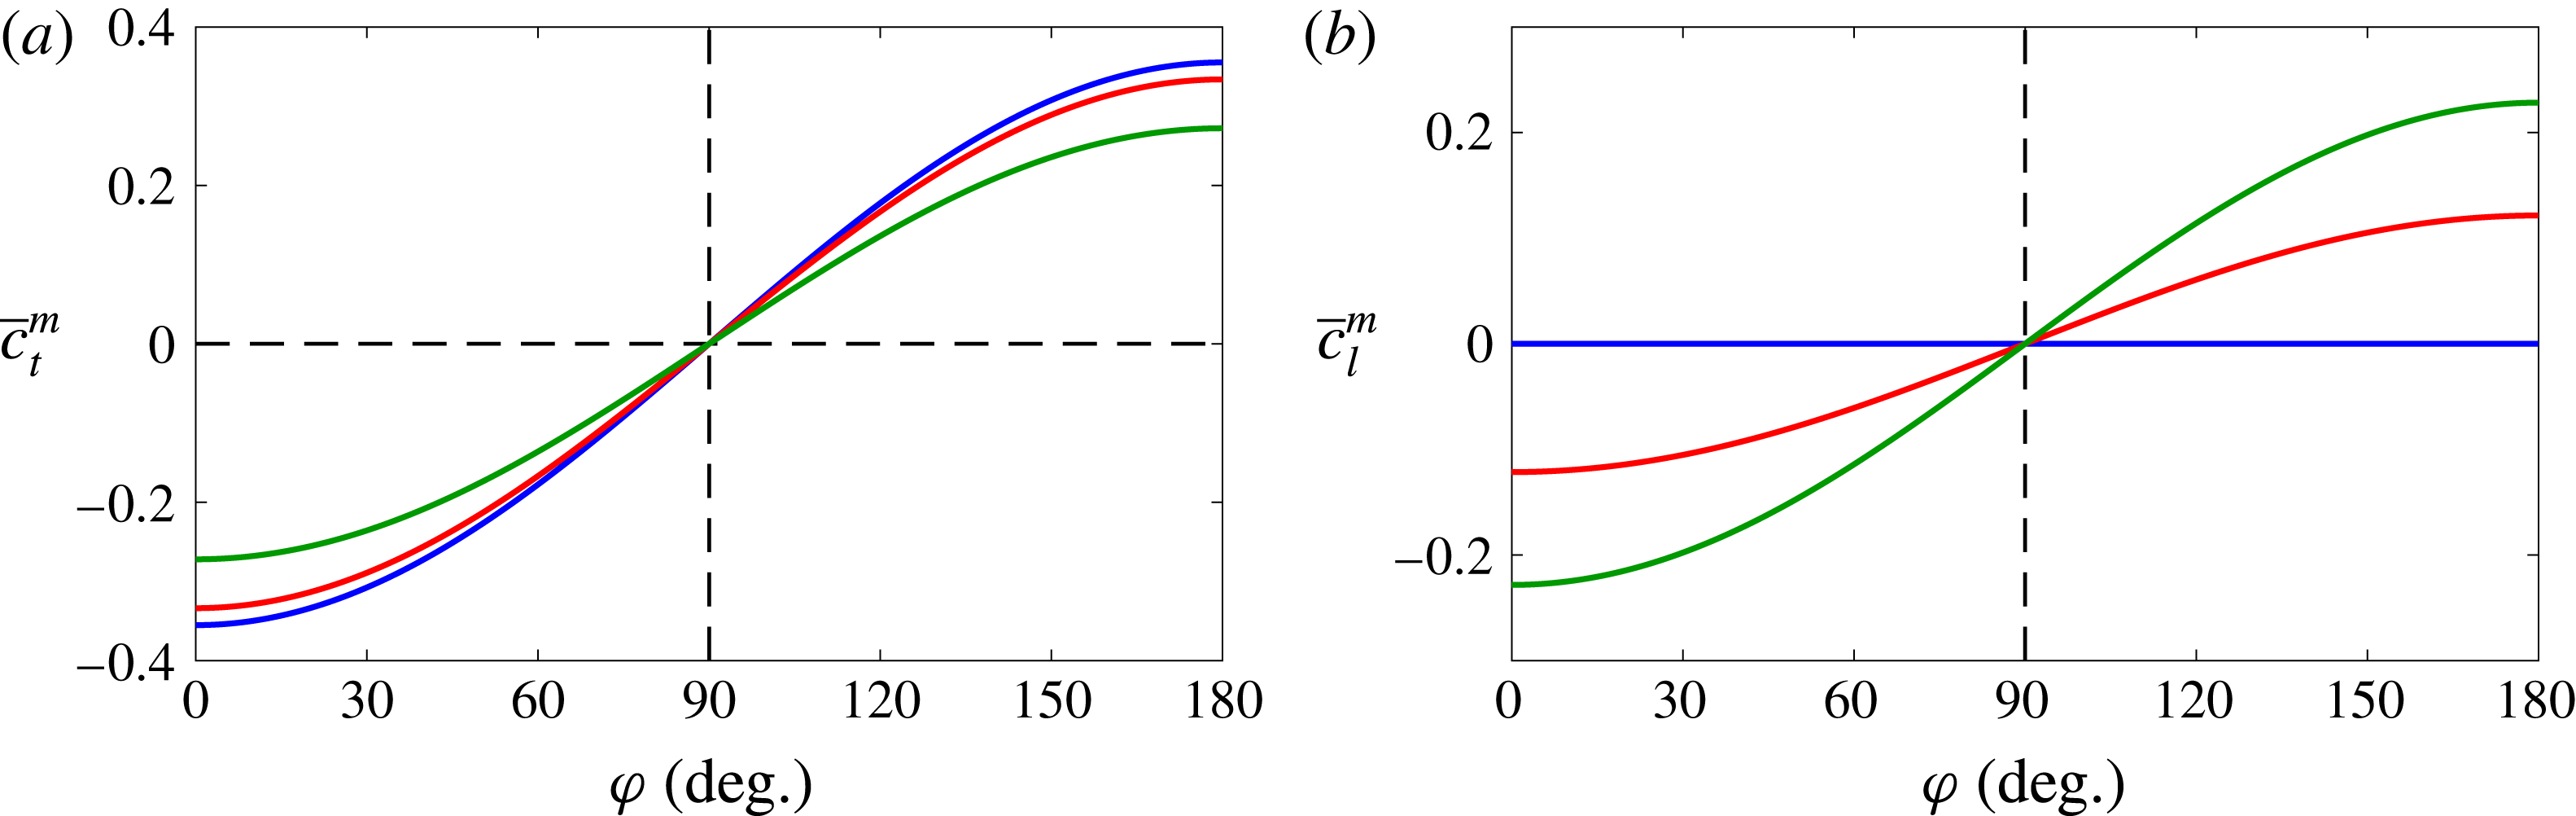
, while the mean value of the body motion contributions is only zero if
 $\unicode[STIX]{x1D711}=90^{\circ }$
. This can be observed in figure 5, which shows
 $\overline{c}_{t}^{m}$
and
 $\overline{c}_{l}^{m}$
as a function of
 $\unicode[STIX]{x1D711}$
for
 $\unicode[STIX]{x1D703}_{m}=0^{\circ }$
,
 $10^{\circ }$
and
 $20^{\circ }$
. Interestingly, the behaviour of
 $\overline{c}_{t}^{m}$
and
 $\overline{c}_{l}^{m}$
in figure 5 is consistent with the trends shown in figure 2, except for maybe the behaviour for
 $\unicode[STIX]{x1D711}\gtrsim 110^{\circ }$
.
Finally, from the point of view of modelling, it is interesting to note that
 $\boldsymbol{F}^{m}$
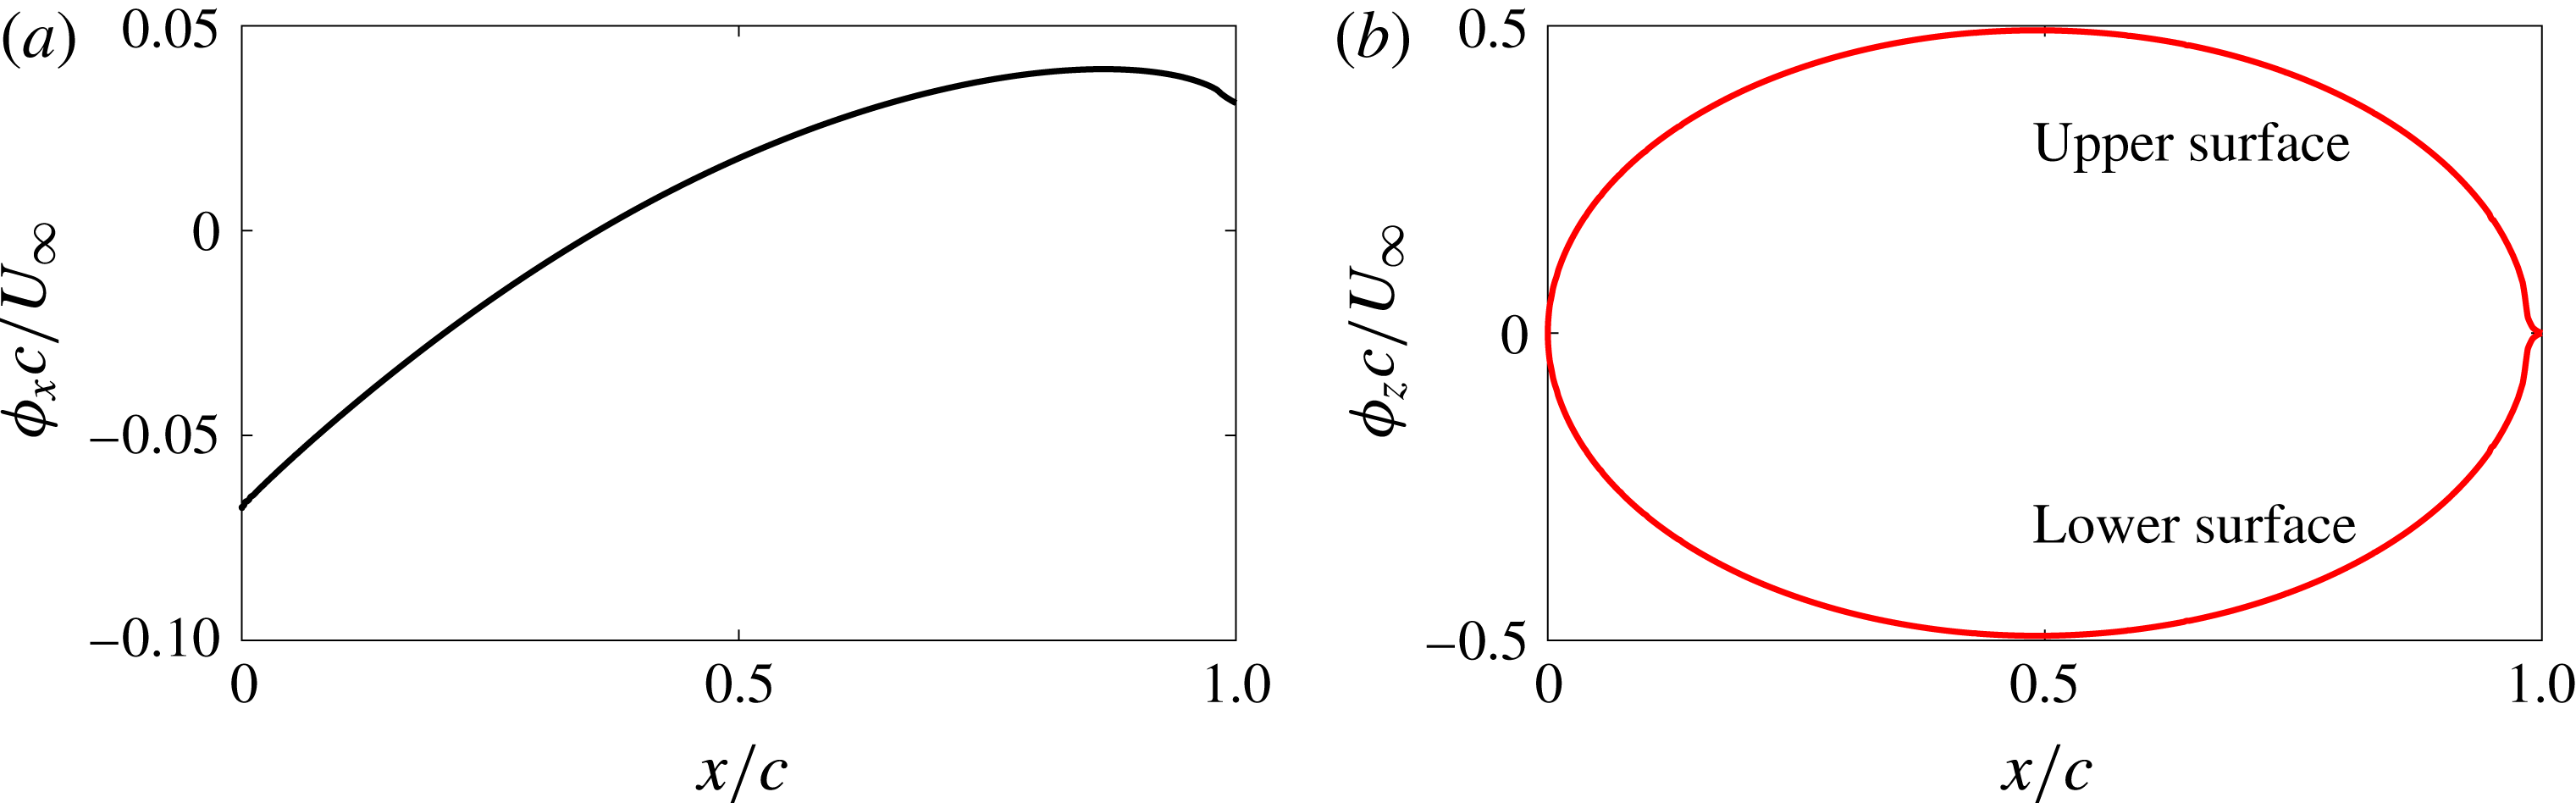
can be computed a priori, since the velocity on the surface is known from the kinematics of the airfoil. It should be noted also that, as explained in appendix B, the auxiliary potentials can be computed on a reference frame fixed to the airfoil, and then rotated and translated appropriately to account for the motion of the airfoil. For reference, the auxiliary potentials for the NACA 0012 airfoil used in this work are provided in figure 17 in appendix B.
Mean (a) thrust and (b) lift coefficients from the body motion contribution for a flat plate with respect to the phase shift
 $\unicode[STIX]{x1D711}$
. The values shown correspond to different values of the mean pitch angle,
 $\unicode[STIX]{x1D703}_{m}=0^{\circ }$
(——, blue),
 $\unicode[STIX]{x1D703}_{m}=10^{\circ }$
(——, red) and
 $\unicode[STIX]{x1D703}_{m}=20^{\circ }$
(——, green).

Now, we turn our attention to the contribution that the vorticity within the flow has to the total aerodynamic force of case B090 (blue lines in figure 4). It is clear that the (positive) peaks of total thrust and lift are dominated by the contribution of the vorticity within the flow. Moreover, the contribution of the vorticity within the flow is maximum when the vertical velocity of the airfoil
 ${\dot{h}}$
and the effective angle of attack
 $\unicode[STIX]{x1D6FC}_{e}$
are maximum. Therefore, two peaks of positive thrust are observed in figure 4(a), slightly lagged with respect to the middle of the downstroke (
 $t/T=0.25$
) and the middle of the upstroke (
 $t/T=0.75$
) respectively. Regarding the lift, the peak of the instantaneous force coefficients is also slightly lagged. The peak of force generated around the middle of the downstroke (
 $t/T=0.25$
) is positive and the one generated around the middle of the upstroke (
 $t/T=0.75$
) is negative. The asymmetry introduced by the mean pitch angle
 $\unicode[STIX]{x1D703}_{m}=10^{\circ }$
results in lower peak values in the upstroke compared with the downstroke, which is detrimental for the thrust but favourable for the lift.
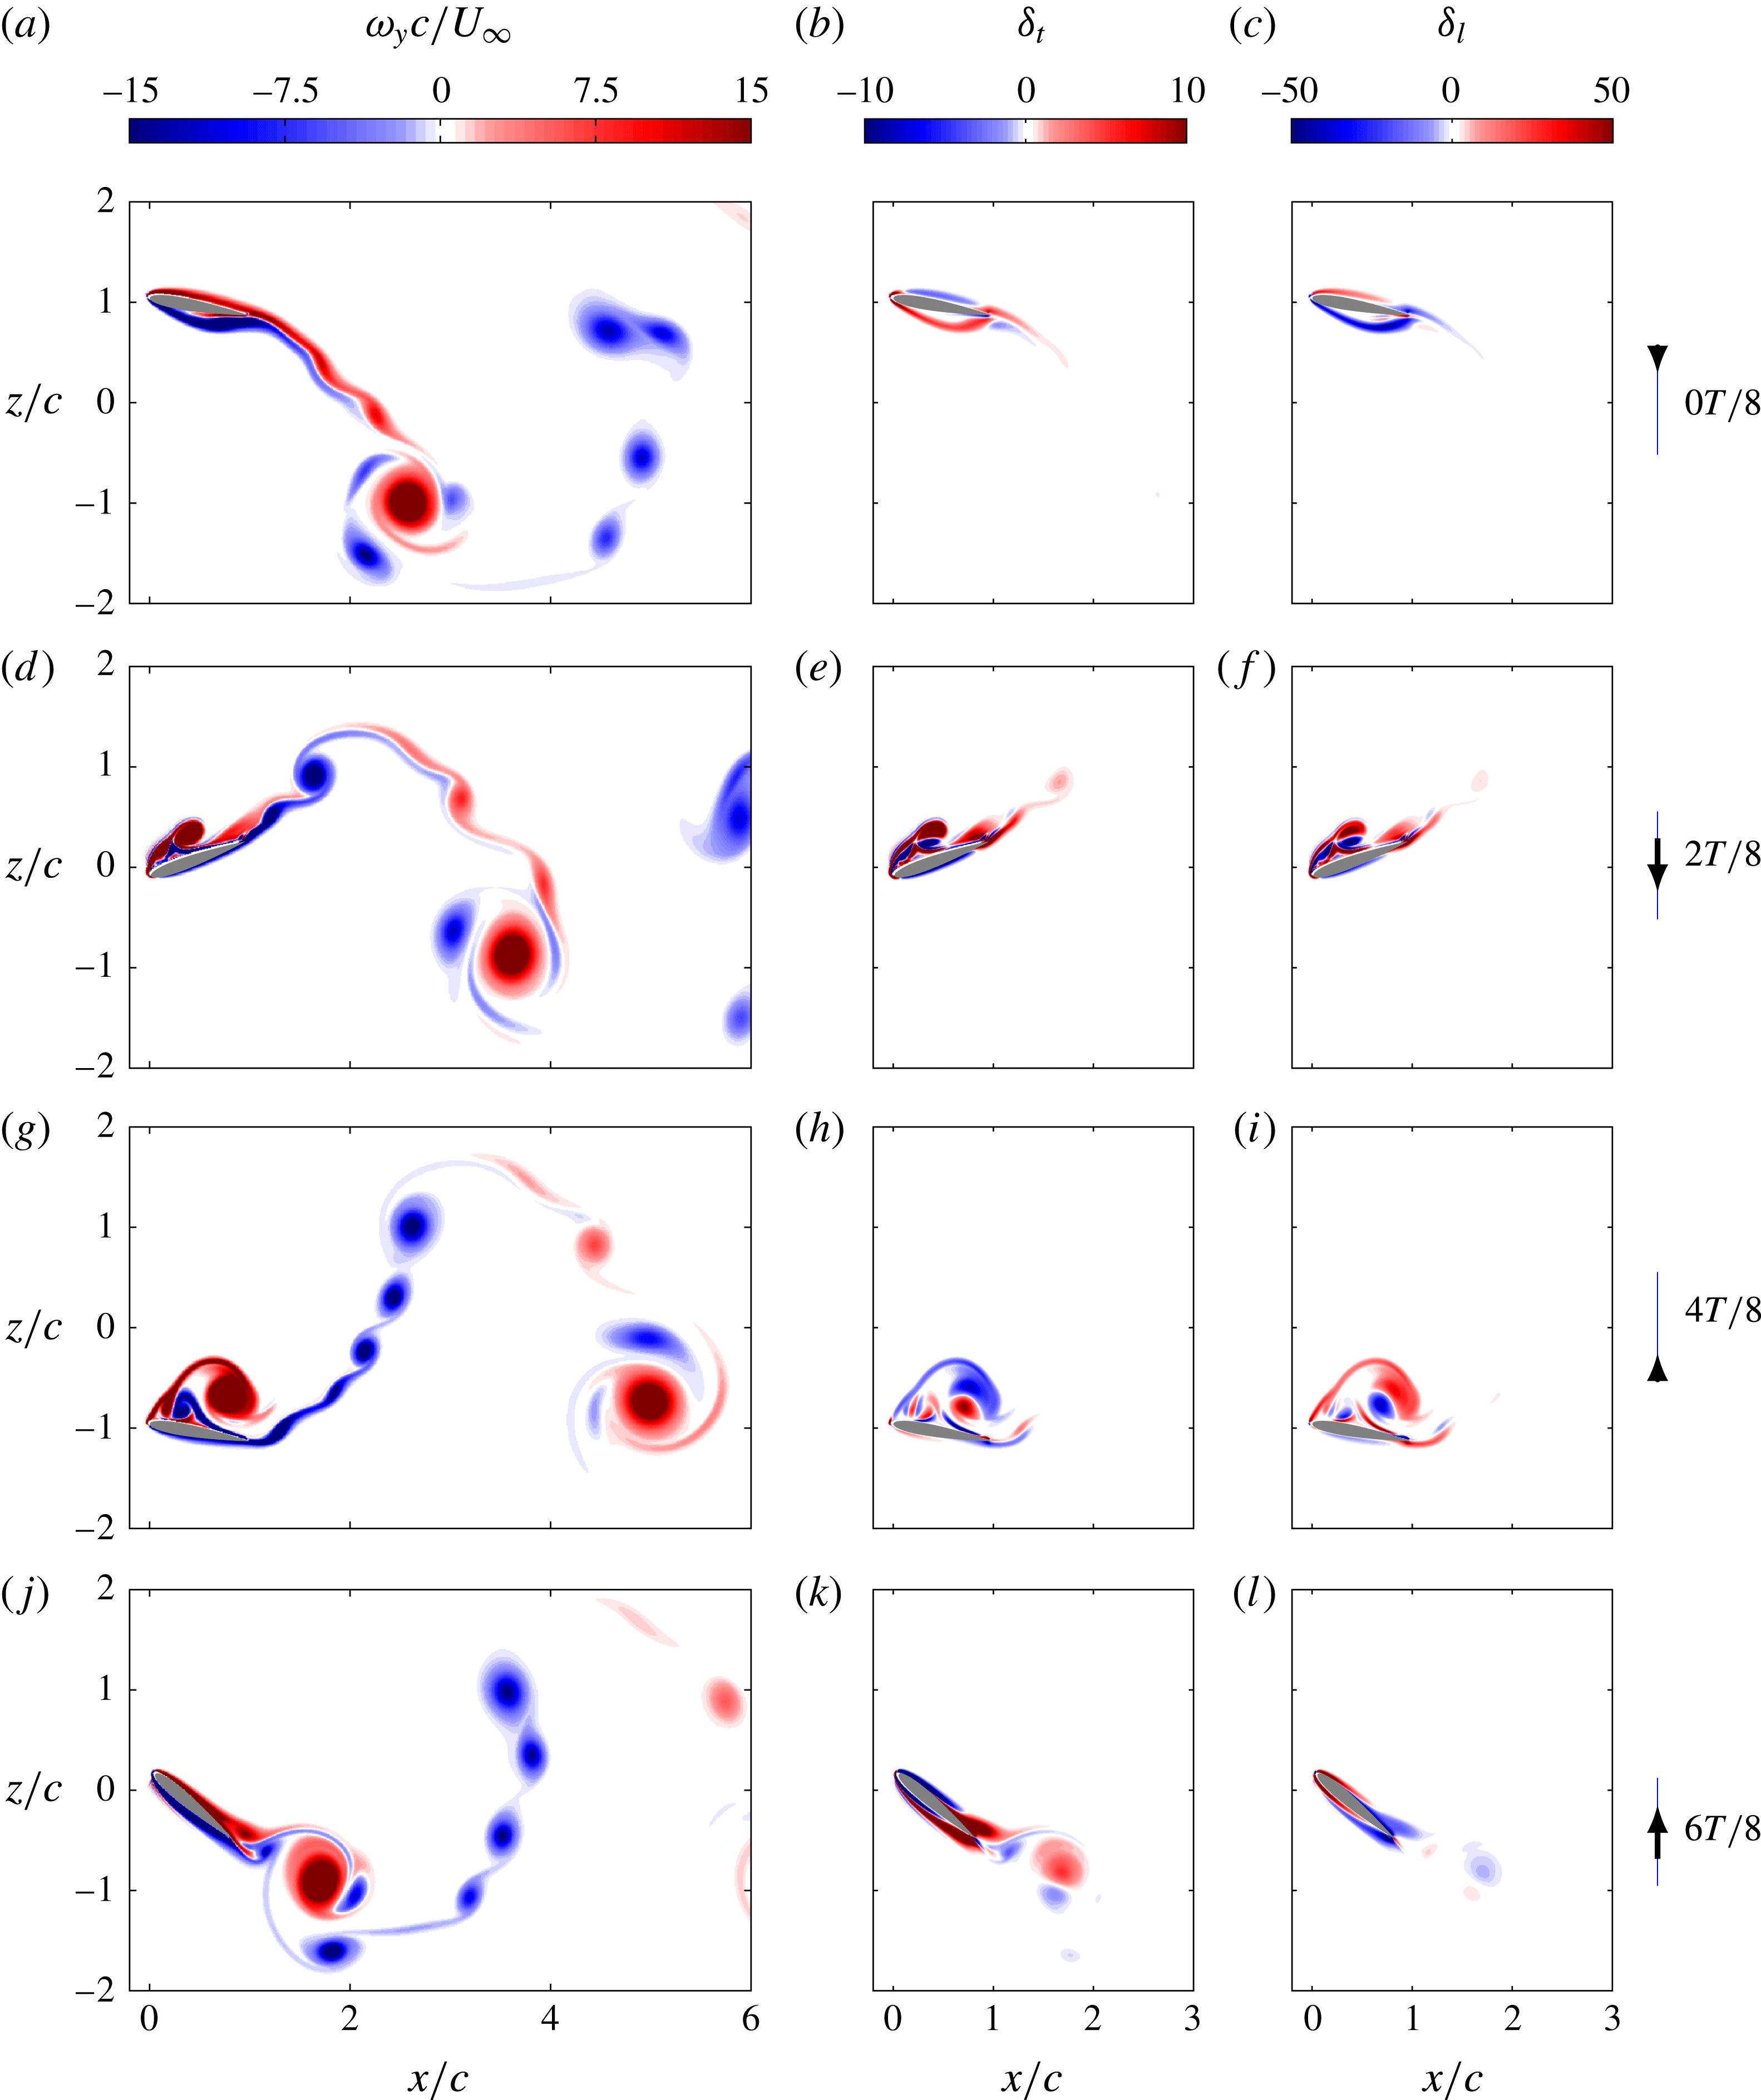
Contours of spanwise vorticity
 $\unicode[STIX]{x1D714}_{y}$
(a,d,g,j), thrust density
 $\unicode[STIX]{x1D6FF}_{t}$
(b,e,h,k) and lift density
 $\unicode[STIX]{x1D6FF}_{l}$
(c,d,i,l) for case B090 at four time instants. See the corresponding animations in the additional material available at https://doi.org/10.1017/jfm.2017.508.

In order to obtain a better understanding, we continue the analysis of case B090 by comparing the spanwise vorticity,
 $\unicode[STIX]{x1D714}_{y}$
, and the force density fields of the contribution of vorticity within the flow at four equispaced time instants during one period, as shown in figure 6. Both the thrust
 $\unicode[STIX]{x1D6FF}_{t}$
and lift
 $\unicode[STIX]{x1D6FF}_{l}$
densities (figures 6
b,e,h,k and 6
c,f,i,l respectively) decay rapidly with the distance from the airfoil for any time instant, as previously observed by other authors (Chang Reference Chang1992; Martín-Alcántara et al.
Reference Martín-Alcántara, Fernandez-Feria and Sanmiguel-Rojas2015). This occurs because the force density is the projection of the Lamb vector onto the gradient of the auxiliary potentials
 $\unicode[STIX]{x1D719}_{x}$
and
 $\unicode[STIX]{x1D719}_{z}$
, which decay quadratically with the distance from the airfoil (Martín-Alcántara et al.
Reference Martín-Alcántara, Fernandez-Feria and Sanmiguel-Rojas2015). The evolution of the spanwise vorticity (figure 6
a,d,g,j) shows how the LEV is created during the downstroke (figure 6
d) and shed into the wake approximately in the transition from downstroke to upstroke (figure 6
g). At that time, the contribution of the LEV to the thrust changes sign, while its contribution to the lift remains positive for longer times. After being shed (figure 6
j), the LEV is advected into the wake (figure 6
a,d,g), and its contribution to the aerodynamic forces becomes negligible. The small influence on the aerodynamic forces from the vortices in the wake is consistent with the results of Moriche et al. (Reference Moriche, Flores and García-Villalba2016), where 2D and 3D configurations of infinite-aspect-ratio wings were found to yield very similar lift and thrust.
It is possible to observe in figure 6 that the contribution of the LEV to the thrust and lift is partially positive and negative. This is an inherent property of any vortex, as indicated by Chang (Reference Chang1992): the centre of a vortex is characterized by a change of direction of the Lamb vector while the gradient of the auxiliary potentials is locally smooth, so a line where the force density changes its sign must pass through the centre of the vortex. Which part of the vortex (positive or negative contribution to the force) dominates depends on the vorticity field and on the gradients of the auxiliary potentials, which are determined only by the geometry of the airfoil. This is an interesting fact, which could be used to guide an optimization of the airfoil shape.
It is clear from the previous discussion that the contribution of the vorticity within the flow is the dominant contribution to the total aerodynamic force. Therefore, it is of great interest to model this part of the force appropriately. In steady-state aerodynamics and in several reduced-order models in the literature (e.g. Pesavento & Wang Reference Pesavento and Wang2004; Andersen, Pesavento & Wang Reference Andersen, Pesavento and Wang2005; Taha et al. Reference Taha, Hajj and Beran2014), it is common to use the Kutta–Joukowsky theorem to model the aerodynamic force due to the vorticity within the flow,
 $$\begin{eqnarray}\boldsymbol{F}_{KJ}=\unicode[STIX]{x1D70C}(\boldsymbol{U}\times \unicode[STIX]{x1D6E4}\boldsymbol{e}_{y}),\end{eqnarray}$$
where the subscript
 $KJ$
denotes Kutta–Joukowsky estimation,
 $\unicode[STIX]{x1D6E4}$
is the circulation around the airfoil,
 $\boldsymbol{U}$
is the effective velocity seen by the airfoil and
 $\boldsymbol{e}_{y}$
is the unitary vector in the
 $y$
direction. The force estimated by the Kutta–Joukowsky theorem is perpendicular to the incoming effective velocity, which can be estimated for a heaving and pitching airfoil as
 $\boldsymbol{U}=U_{\infty }\boldsymbol{e}_{x}-{\dot{h}}\boldsymbol{e}_{z}$
, as described in Pesavento & Wang (Reference Pesavento and Wang2004), Andersen et al. (Reference Andersen, Pesavento and Wang2005) and Taha et al. (Reference Taha, Hajj and Beran2014).
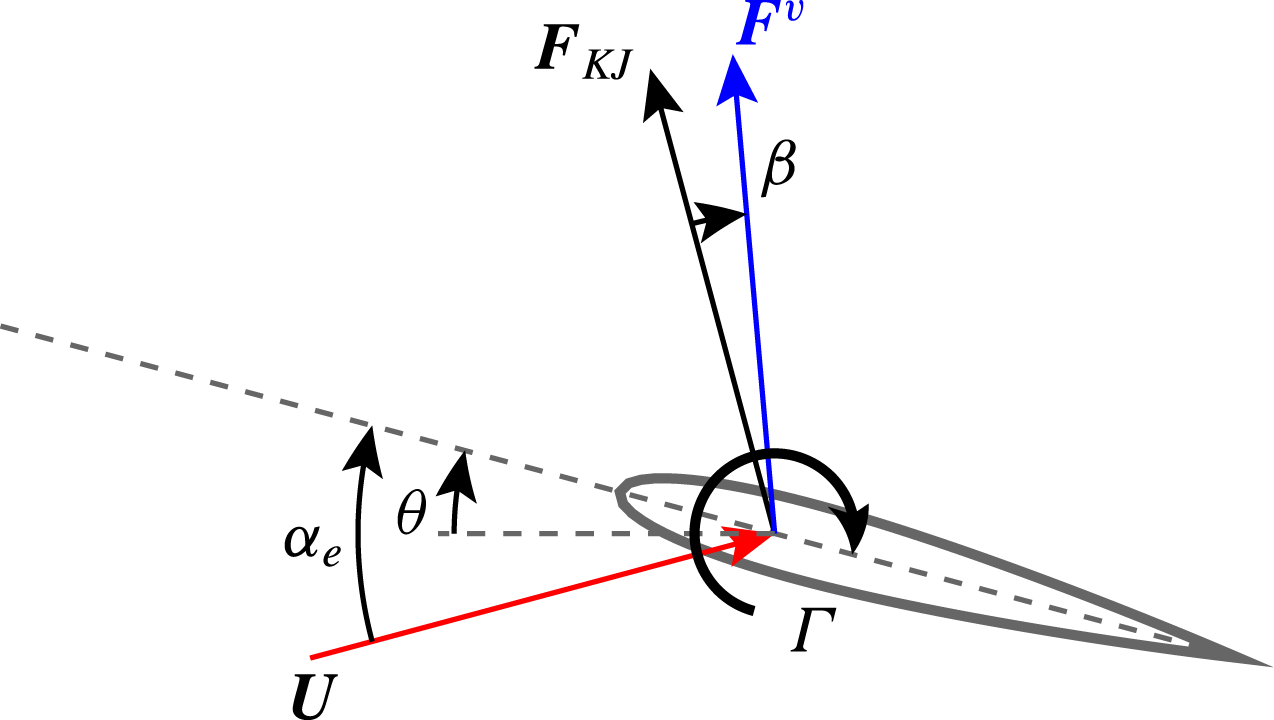
Sketch of the deviation angle
 $\unicode[STIX]{x1D6FD}$
and effective angle of attack
 $\unicode[STIX]{x1D6FC}_{e}$
.

(a) Evolution of the angle
 $\unicode[STIX]{x1D6FD}$
(in degrees) for case B090 during one period. The curves represented are the angle
 $\unicode[STIX]{x1D6FD}$
in greyscale to indicate the modulus of the contribution of vorticity within the flow and the effective angle of attack (——, blue). (b) Vectors of
 $\boldsymbol{F}^{v}$
(——, blue) and
 $\boldsymbol{F}^{m}$
(——, red) at four time instants during the downstroke for case B090.

In order to compare
 $\boldsymbol{F}_{KJ}$
and
 $\boldsymbol{F}^{v}$
, we define the angle
 $\unicode[STIX]{x1D6FD}$
formed by these two vectors, as sketched in figure 7. The evolution of this angle
 $\unicode[STIX]{x1D6FD}$
for case B090 during one period is shown in figure 8(a), where the curve representing
 $\unicode[STIX]{x1D6FD}$
is coloured with a greyscale proportional to
 $|\boldsymbol{F}^{v}|$
. This is done to avoid confusion when the force tends to zero, a situation where the angle
 $\unicode[STIX]{x1D6FD}$
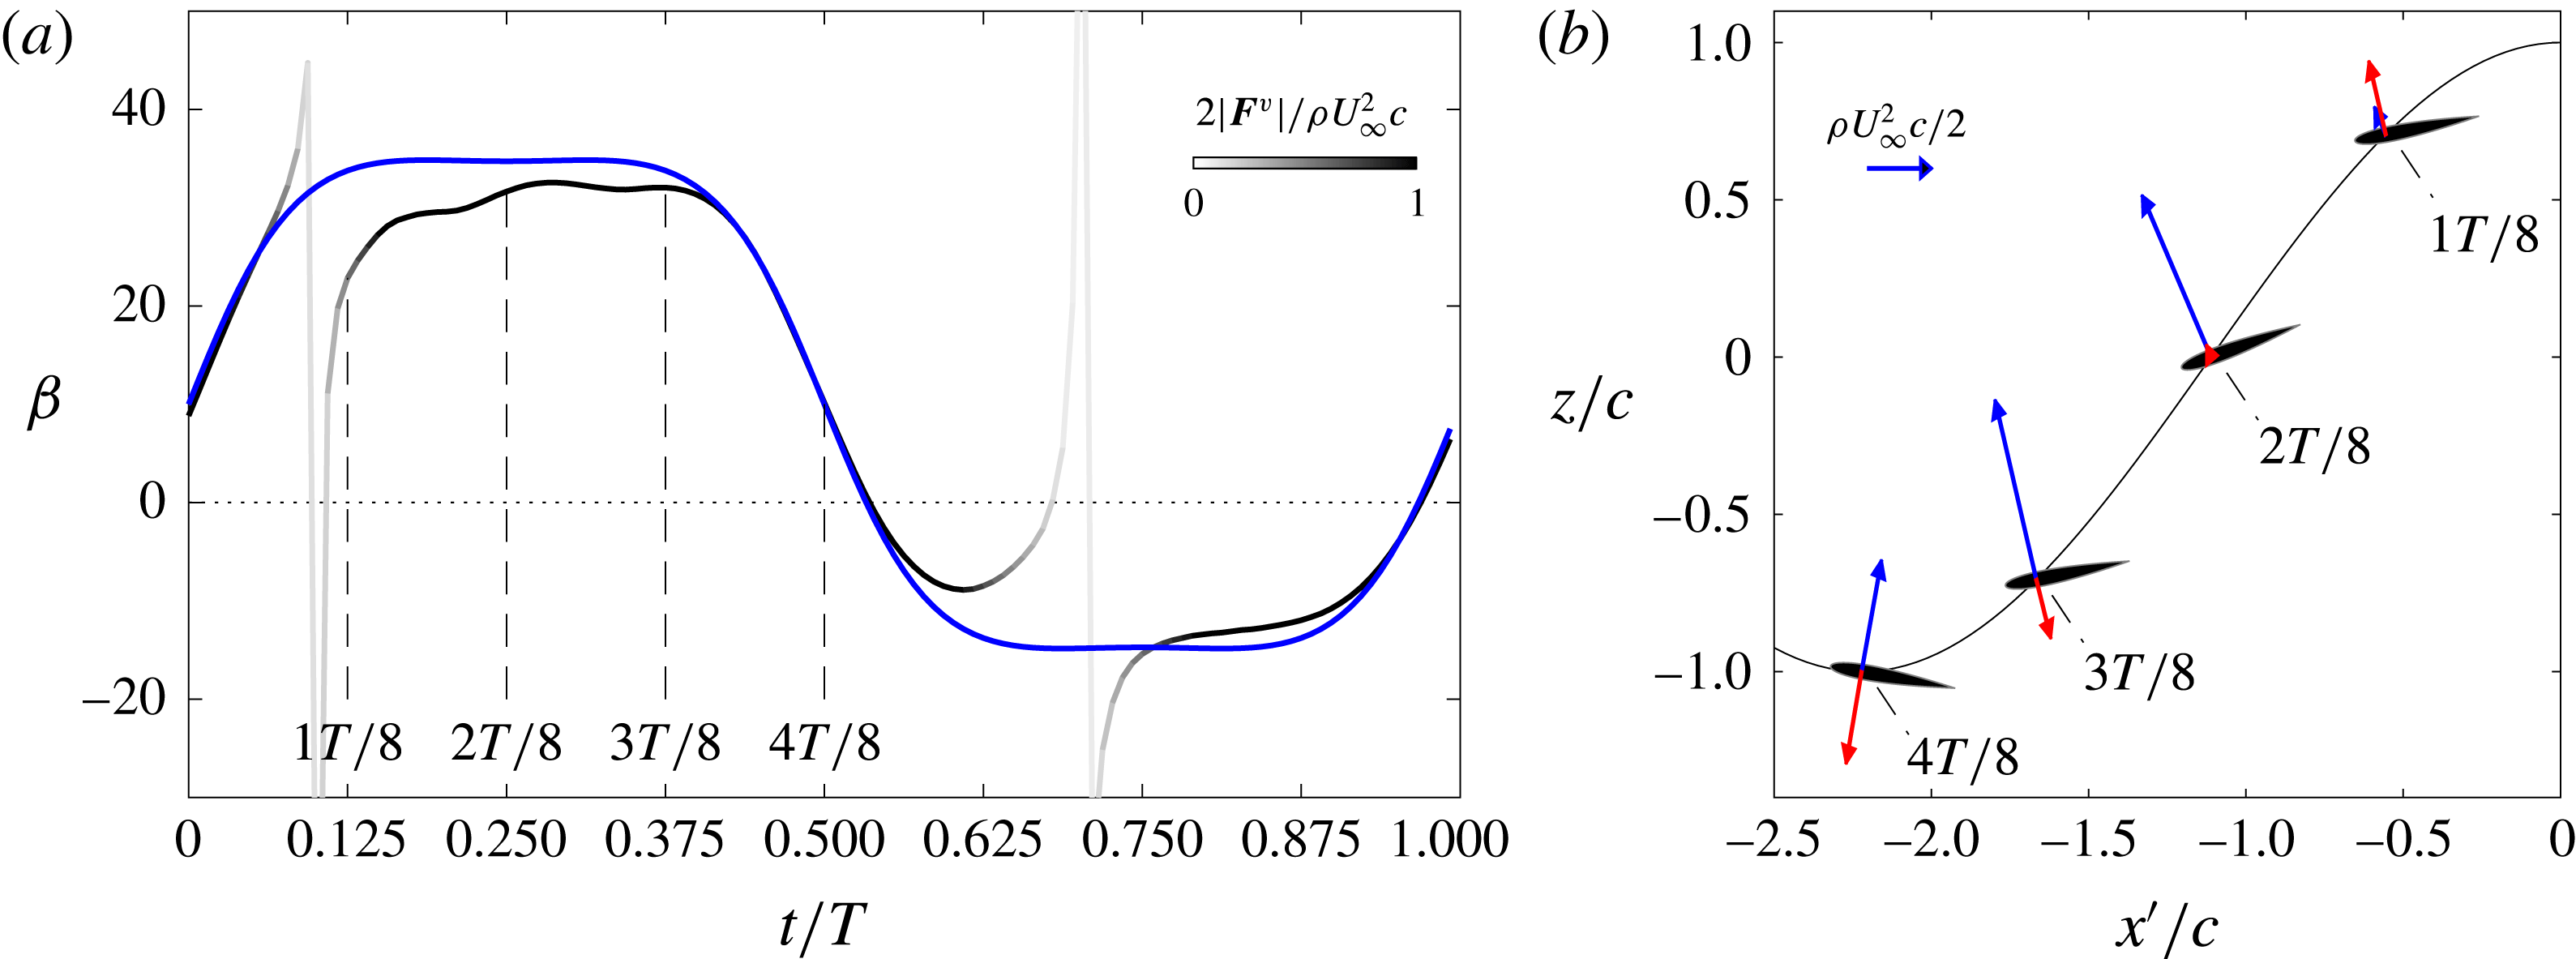
is ill-defined. The evolution of the effective angle of attack
 $\unicode[STIX]{x1D6FC}_{e}$
has been also included in the figure, and it can be clearly seen that the angle
 $\unicode[STIX]{x1D6FD}$
tends to
 $\unicode[STIX]{x1D6FC}_{e}$
, except for specific time instants where the force is small. This means that
 $\boldsymbol{F}^{v}$
is not oriented in the direction suggested by the Kutta–Joukowsky theorem (namely normal to the incoming effective velocity), but is approximately perpendicular to the chord of the airfoil. This observation is consistent with the empirical model of Dickinson et al. (Reference Dickinson, Lehmann and Sane1999), which results in aerodynamic forces essentially normal to the wing. The tendency to a chord-normal orientation of
 $\boldsymbol{F}^{v}$
is observed for all of the periodic cases in our database.
Figure 8(b) shows a sketch of
 $\boldsymbol{F}^{v}$
and
 $\boldsymbol{F}^{m}$
acting on the airfoil at four equispaced time instants. In the figure, the airfoil trajectory is represented as seen by an observer travelling with the free stream, so the horizontal coordinate is defined as
 $x^{\prime }=x-U_{\infty }t$
. It should be noted that the approximate chord-normal orientation of
 $\boldsymbol{F}^{v}$
occurs when the forces are large enough, which is consistent with a well-developed LEV moving the suction peak from the leading edge of the airfoil to the upper surface of the airfoil. Moreover, figure 8(a) shows that there is a small deviation of
 $\boldsymbol{F}^{v}$
with respect to the normal, of the order of
 $\pm 5^{\circ }$
, which could result in a small component of
 $\boldsymbol{F}^{v}$
in the direction of the chord. Interestingly,
 $\boldsymbol{F}^{m}$
is also approximately perpendicular to the airfoil chord. Indeed, equations (4.2) show that this is strictly true for a flat plate pitching around
 $x_{p}=c/2$
.
From the point of view of modelling, the results of figure 8 suggest that
 $\boldsymbol{F}^{v}$
is a force roughly perpendicular to the airfoil chord. In order to estimate its modulus, we follow previous works and use the Kutta–Joukowsky theorem,
 $$\begin{eqnarray}|\boldsymbol{F}^{v}|=\unicode[STIX]{x1D70C}\unicode[STIX]{x1D6E4}|\boldsymbol{U}|,\end{eqnarray}$$
estimating the circulation of the airfoil as in Pesavento & Wang (Reference Pesavento and Wang2004),
 $$\begin{eqnarray}\unicode[STIX]{x1D6E4}={\textstyle \frac{1}{2}}G_{T}c|\boldsymbol{U}|\sin (2\unicode[STIX]{x1D6FC}_{e})+{\textstyle \frac{1}{2}}G_{R}c^{2}\dot{\unicode[STIX]{x1D703}}.\end{eqnarray}$$
In this expression,
 $G_{T}$
and
 $G_{R}$
are the two free parameters of the model. It should be noted that (4.5) includes information on the amplitudes and frequency of the pitching and heaving motion of the airfoil in
 $\boldsymbol{U},\unicode[STIX]{x1D6FC}_{e}$
and
 $\dot{\unicode[STIX]{x1D703}}$
.
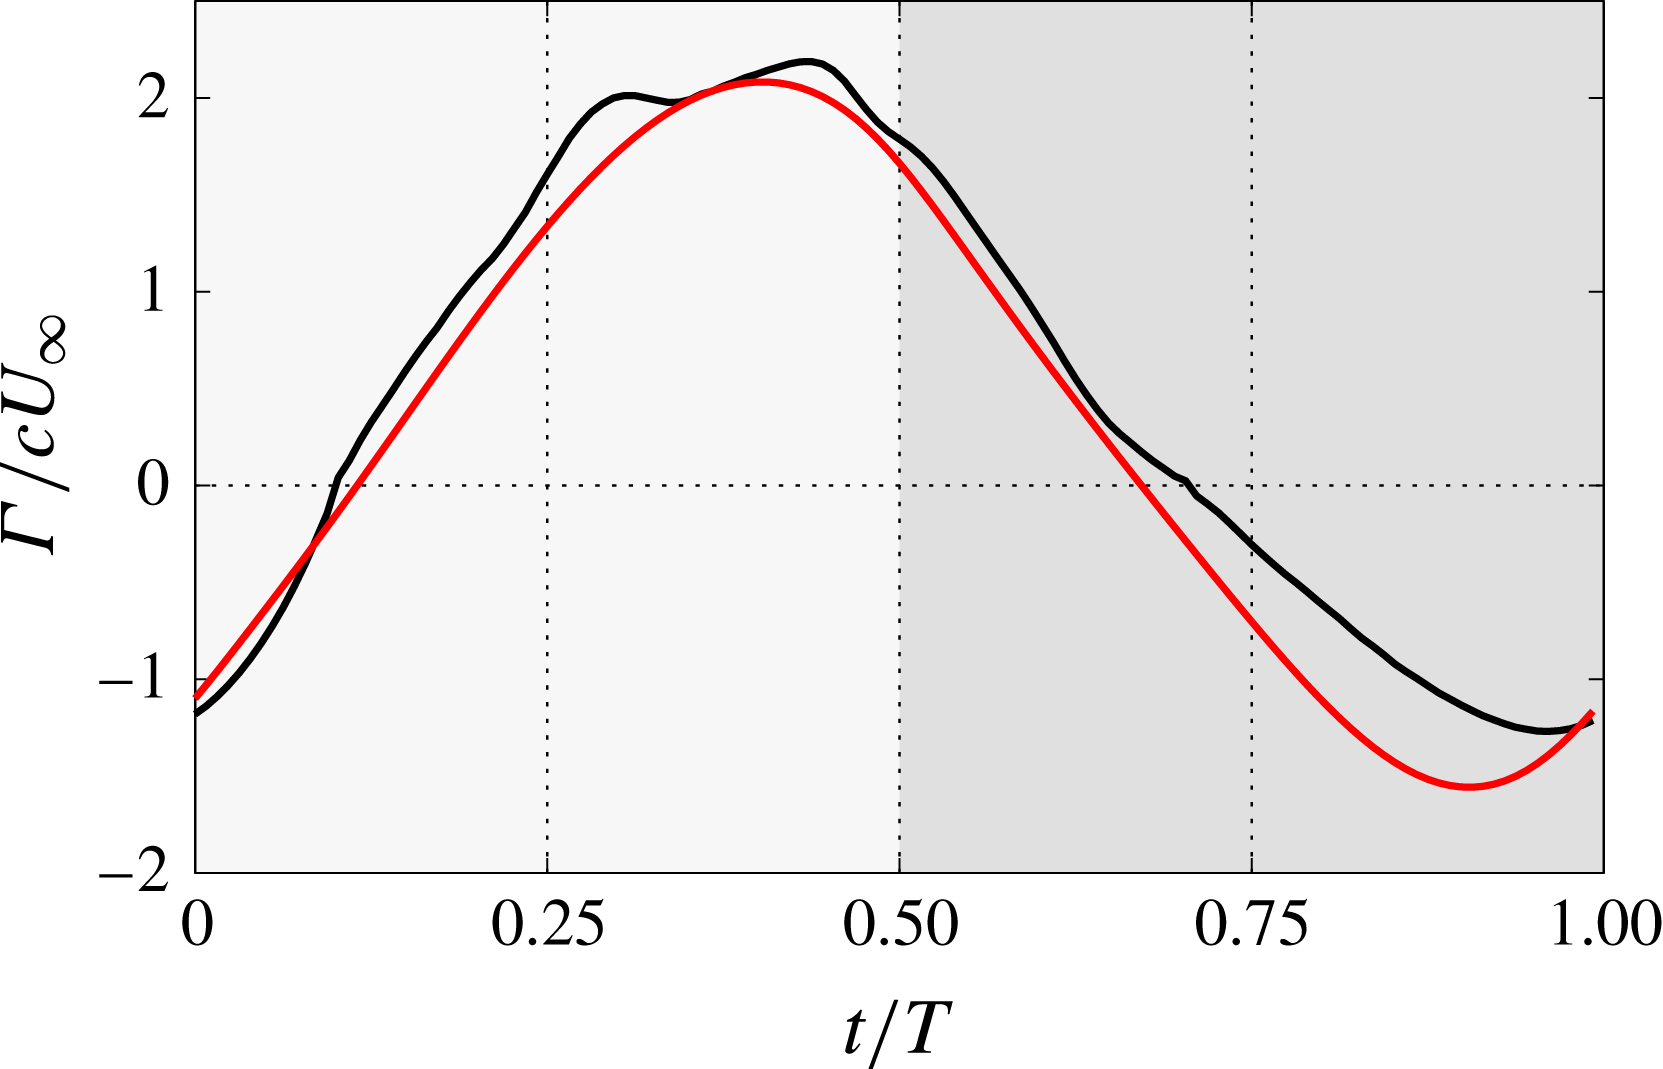
Figure 9 shows a comparison of the circulation obtained from the DNS (using the computed
 $\boldsymbol{F}^{v}$
and (4.4)) and the circulation obtained from (4.5). For the latter, the constants
 $G_{T}=1.65$
and
 $G_{R}=3.75$
are obtained from a least squares fit to the circulation from the DNS. It can be seen that the agreement is very good, except for the last part of the upstroke (
 $t/T>0.75$
), where the model slightly overpredicts the circulation.
The circulation of the airfoil for case B090. The curves represented correspond to the values obtained from the DNS (——, black) and the model best fit (——, red) with
 $G_{T}=1.65$
and
 $G_{R}=3.73$
. The downstroke (upstroke) is indicated by a light (dark) grey background.

Evolution of (a)
 $c_{t}^{v}$
and (b)
 $c_{l}^{v}$
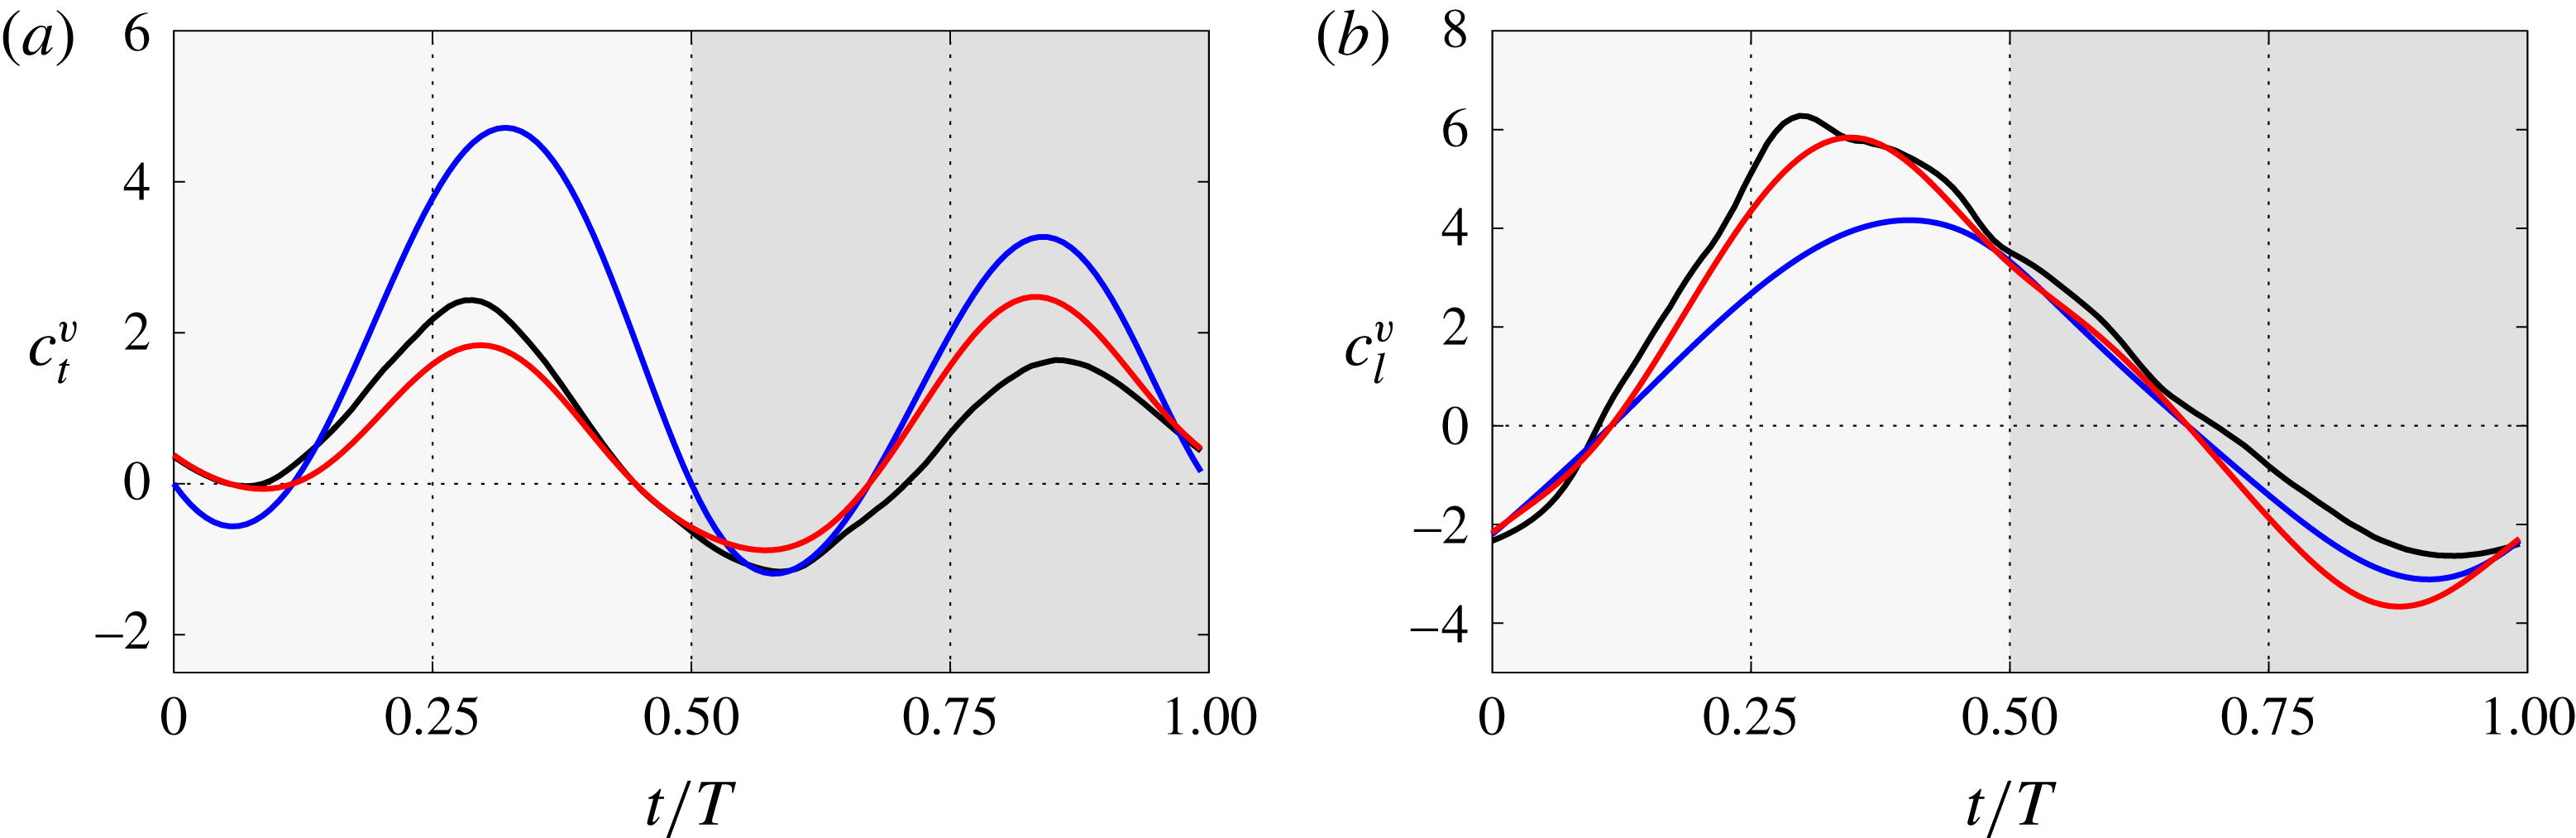
for case B090 during one period. The curves represented correspond to the values obtained from the DNS (——, black), the Kutta–Joukowsky estimation (——, blue) and the chord-normal estimation (——, red). The circulation in both estimations is given by the model from Pesavento and Wang with
 $G_{T}=1.65$
and
 $G_{R}=3.73$
. The downstroke (upstroke) is indicated by a light (dark) grey background.

Based on the observations made in this section, we propose to model
 $\boldsymbol{F}^{v}$
as a force oriented normal to the chord, whose modulus is calculated with (4.4) and (4.5). Figure 10 shows a comparison between this chord-normal model, the Kutta–Joukowsky prediction (i.e. same modulus but perpendicular to
 $\boldsymbol{U}$
) and the results of the DNS. The results show that the peak values of the thrust (figure 10
a) are well predicted by the chord-normal force, but overestimated by the Kutta–Joukowsky prediction. Regarding the lift, figure 10(b) shows that
 $c_{l}^{v}$
is well reproduced by the chord-normal estimation, with a visible deviation corresponding to the already mentioned misrepresentation of
 $\unicode[STIX]{x1D6E4}$
near the end of the upstroke.
5 Effects of mean pitch angle and phase shift in the force decomposition and modelling
In this section, we extend the analysis performed in the previous section on case B090 to a subset of cases from the database. The objective of extending the analysis is to see how the different contributions to the total aerodynamic force are influenced by the motion parameters
 $\unicode[STIX]{x1D703}_{m}$
and
 $\unicode[STIX]{x1D711}$
. As before, we select the cases A090, C090, B070 and B110, and use the results of case B090 as a reference.
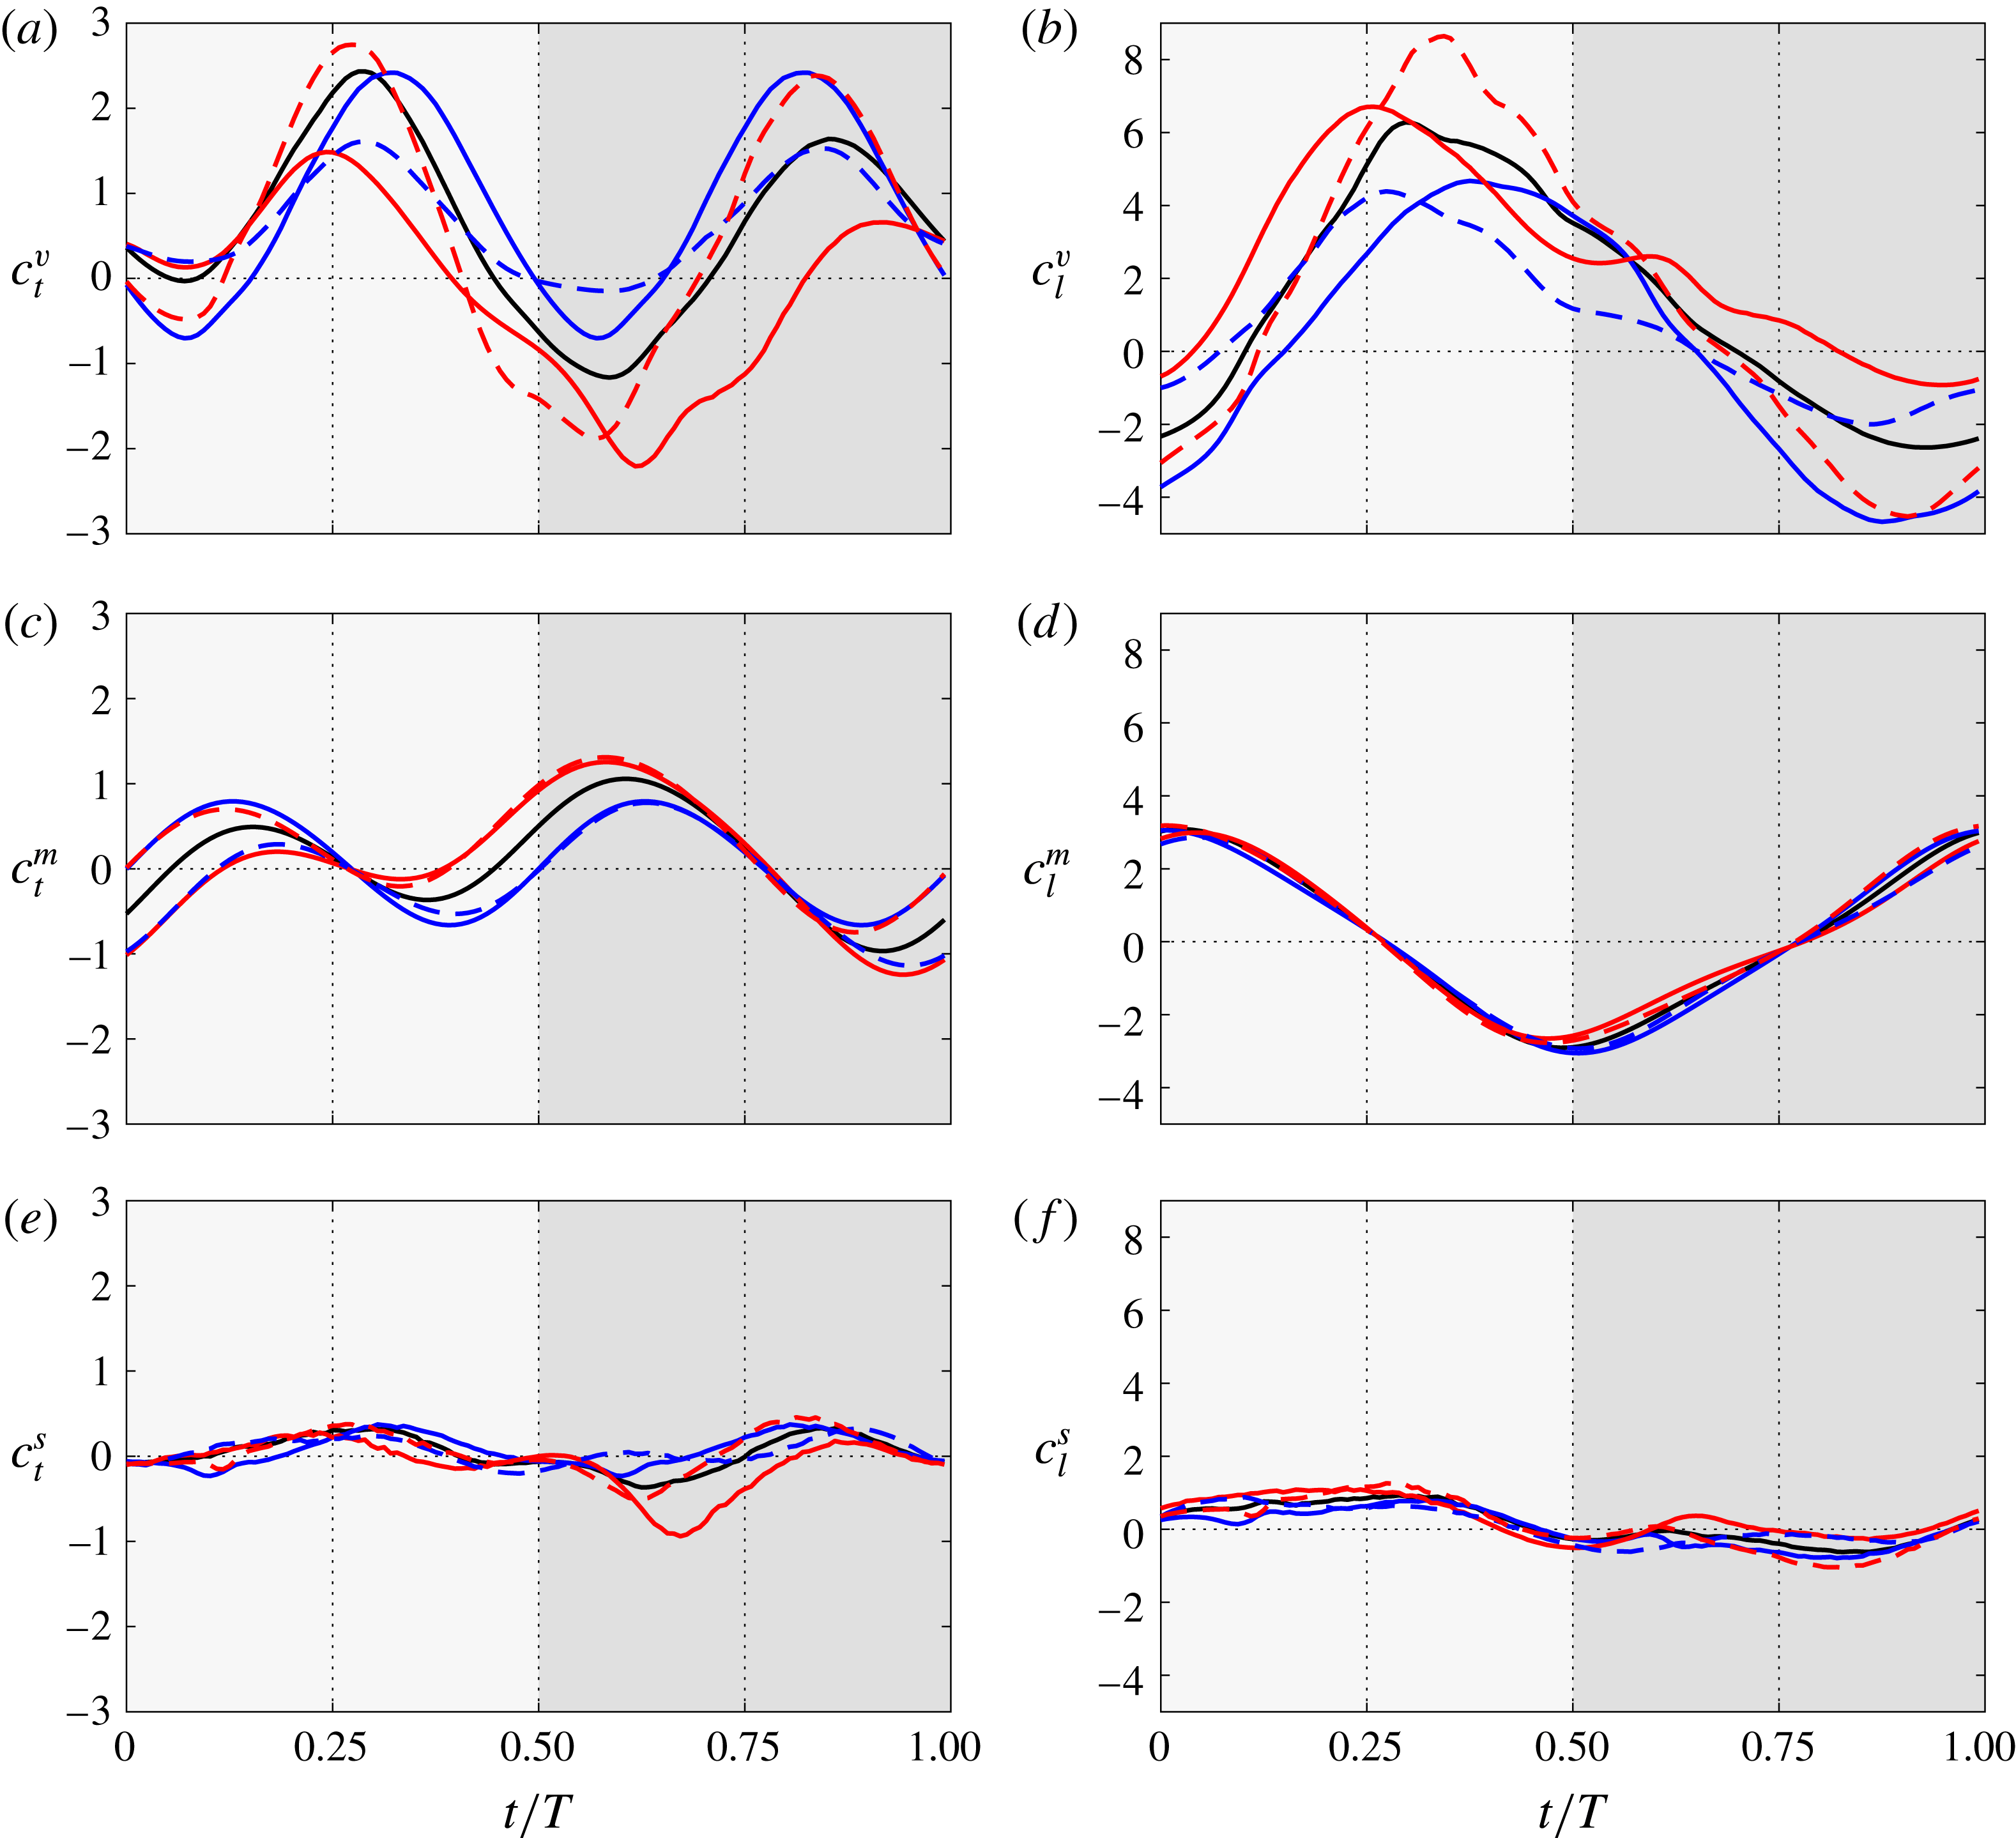
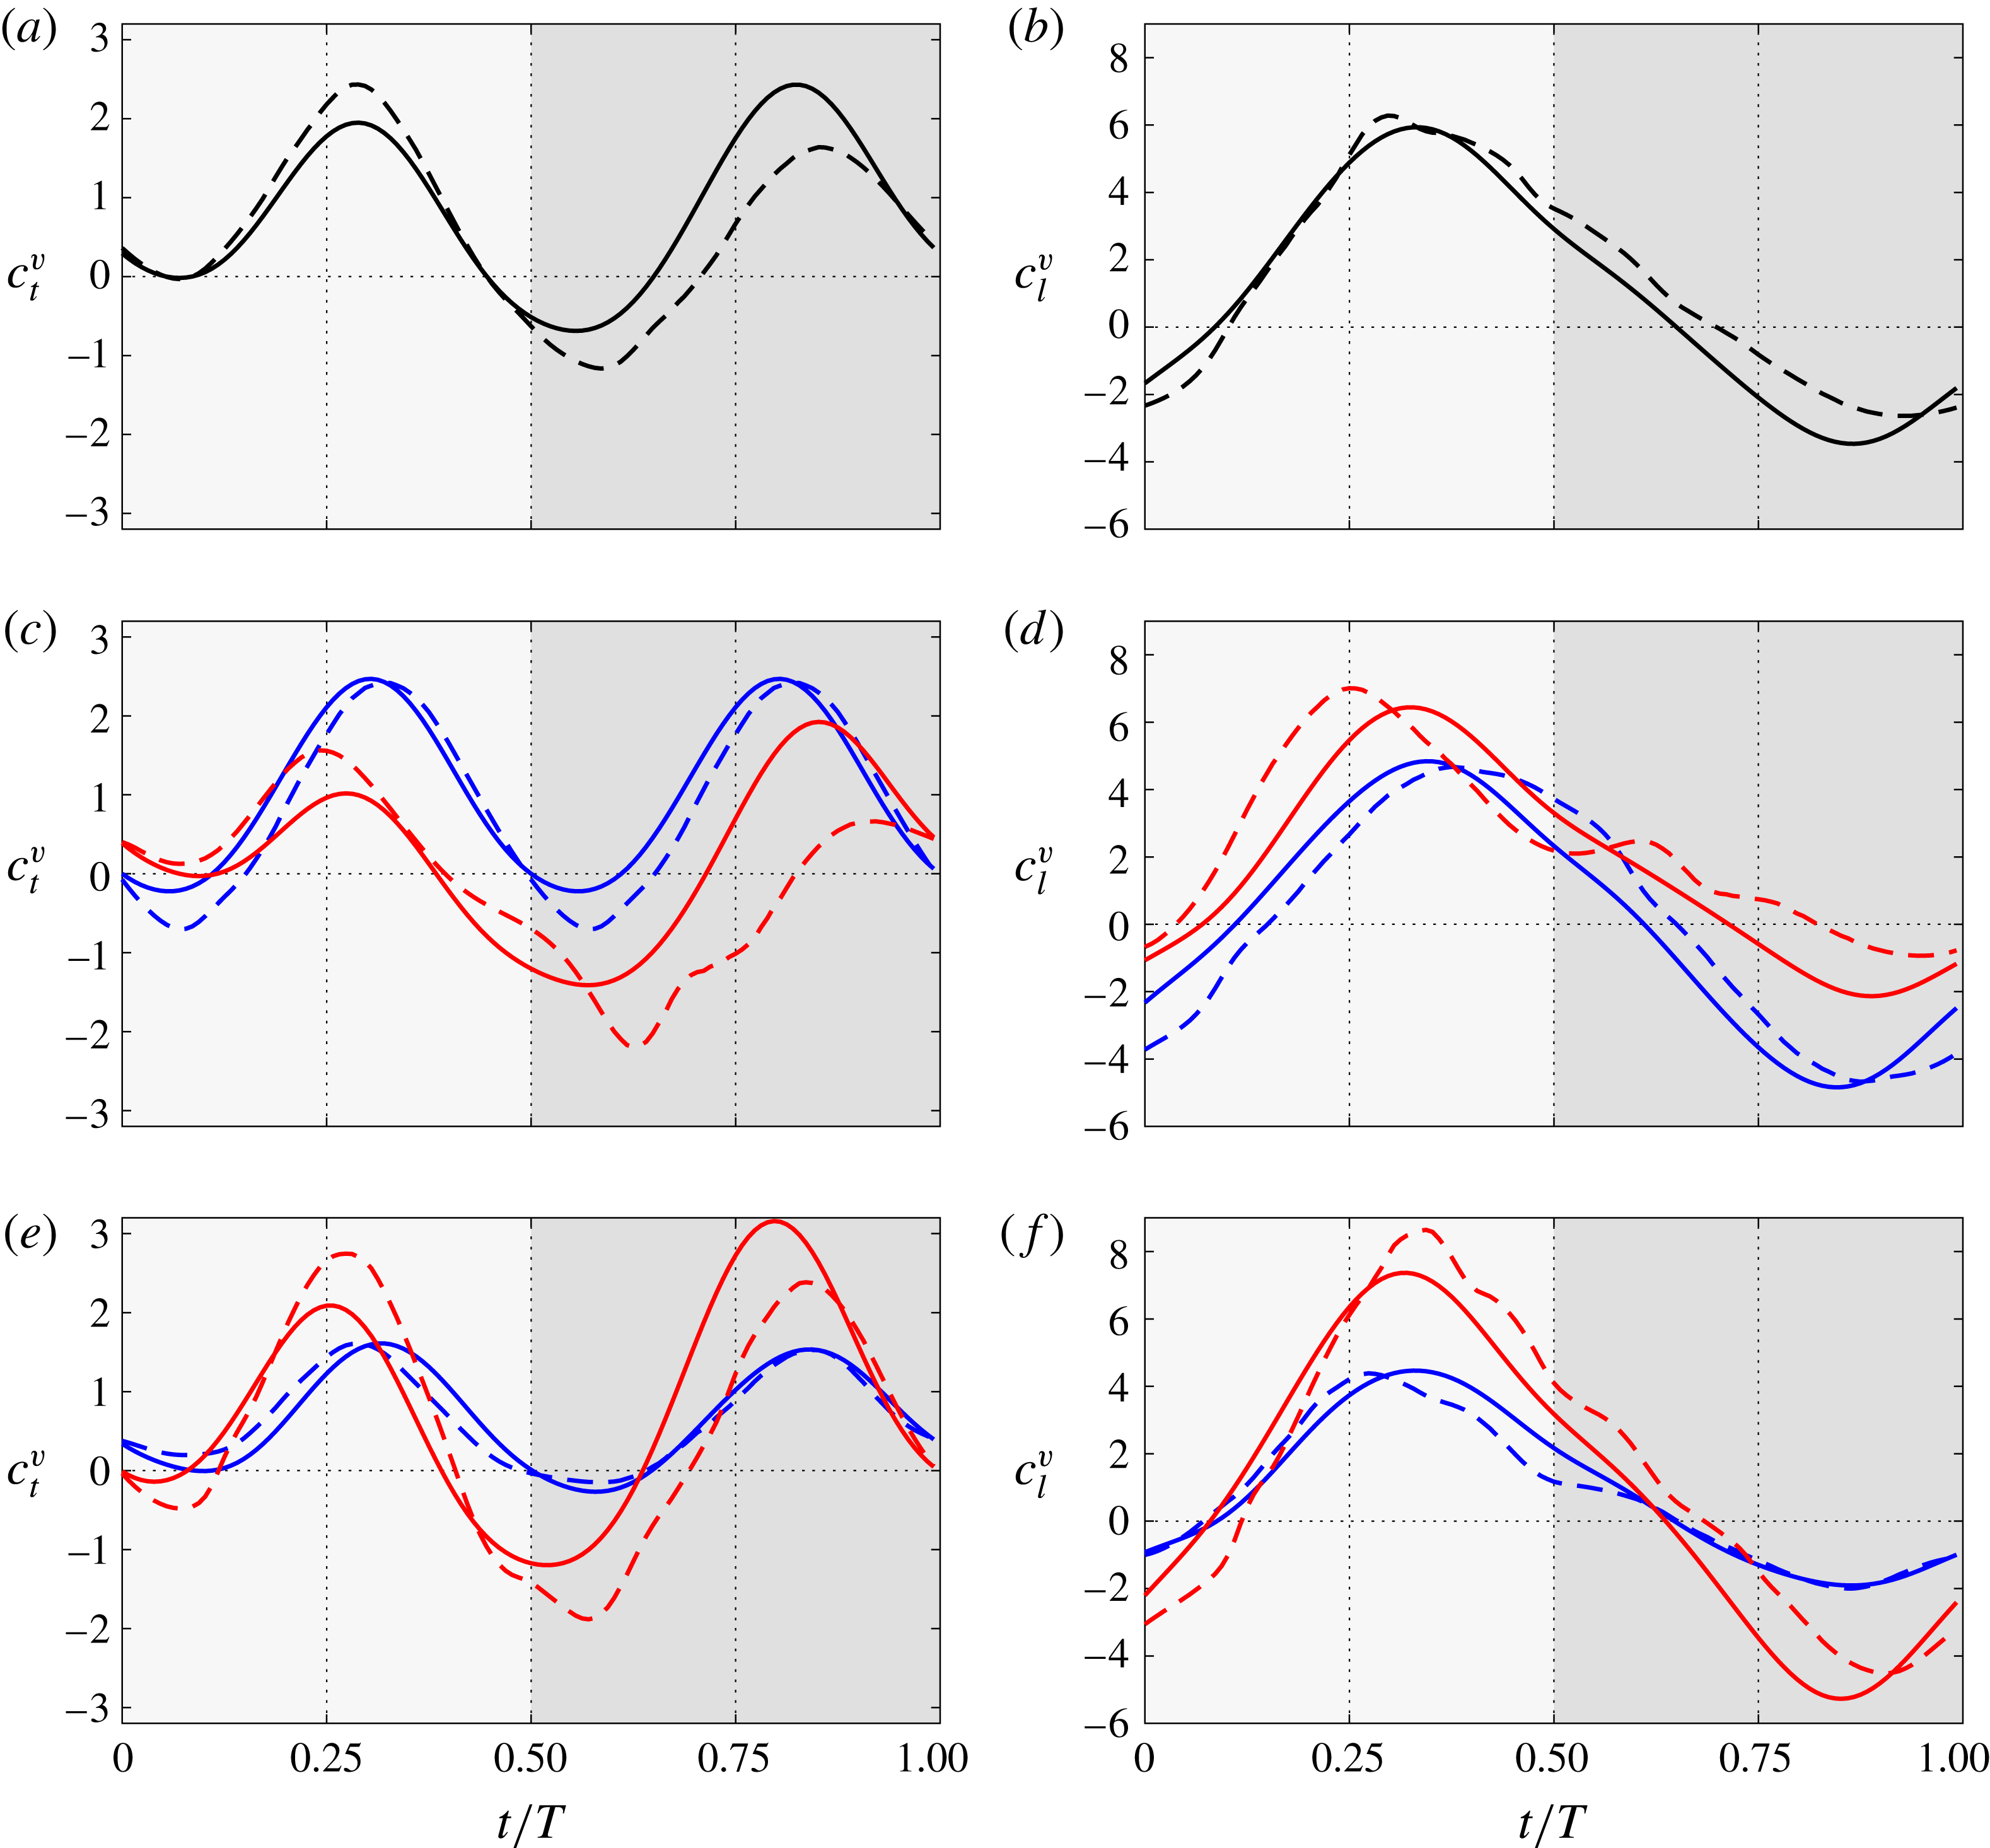
Contribution of (a) vorticity within the flow, (c) body motion and (e) surface vorticity to the total aerodynamic thrust. The lift contributions are shown in (b), (d) and (f) respectively. Five cases with different motion parameters are represented: case B090 (——, black), case A090 (——, blue), case C090 (——, red), case B070 (– – –, blue) and case B110 (– – –, red). The downstroke (upstroke) is indicated by a light (dark) grey background.

Figure 11 shows the contributions to the lift and thrust coefficients from the vorticity within the flow, body motion and surface vorticity for the selected cases. Overall, figure 11(a,b) shows that an increase in
 $\unicode[STIX]{x1D703}_{m}$
increases
 $c_{l}^{v}$
and reduces
 $c_{t}^{v}$
. This is because an increase in
 $\unicode[STIX]{x1D703}_{m}$
increases the effective angle of attack (figure 3
c), increasing the modulus of
 $\boldsymbol{F}^{v}$
and tilting the resultant backwards, hence reducing thrust and increasing lift. Moreover, the LEV detaches from the airfoil earlier as
 $\unicode[STIX]{x1D703}_{m}$
increases, shifting the peaks in lift during the downstroke to earlier times (see figure 11
b). As mentioned earlier, this has a small effect on the thrust, which is strongly influenced by the orientation of the airfoil. During the upstroke, an increase in
 $\unicode[STIX]{x1D703}_{m}$
reduces the (negative) effective angle of attack. This results in lower forces, although better oriented for thrust. For C090, at the beginning of the upstroke, the pitch angle is large enough so that the airfoil is still producing positive lift and, since it is tilted backwards, drag (see
 $\unicode[STIX]{x1D703}$
and
 $\unicode[STIX]{x1D6FC}_{e}$
in figures 3
c and 3
d respectively).
As with the total forces, the variation of phase shift produces a different effect, mainly affecting the amplitude of the peak values of
 $\boldsymbol{F}^{v}$
. An advance of the pitching motion (case B110) increases the amplitudes of the fluctuations of both thrust and lift, whereas a lag of the pitching motion (case B070) results in a reduction of these amplitudes. There is also an effect of the phase shift on the positions of the peaks of
 $c_{l}^{v}$
during the downstroke, although this effect is not appreciable in
 $c_{l}^{v}$
during the upstroke, or in the peaks of
 $c_{t}^{v}$
.
Figure 11(c,d) shows the evolution of
 $c_{t}^{m}$
and
 $c_{l}^{m}$
for the selected cases. For the motion under study, the heaving acceleration
 $\ddot{h}(t)$
dominates the contribution of body motion to the lift, independently of the parameters
 $\unicode[STIX]{x1D703}_{m}$
and
 $\unicode[STIX]{x1D711}$
(figure 11
d). Concerning the thrust, both the heaving acceleration
 $\ddot{h}(t)$
and the projected area of the airfoil perpendicular to the streamwise direction influence
 $c_{t}^{m}$
. Therefore,
 $c_{t}^{m}$
vanishes at points where the heaving acceleration
 $\ddot{h}(t)$
is zero (
 $t/T=0.25,0.75$
). At points where the heaving acceleration
 $\ddot{h}(t)$
is maximum (
 $t/T=0,0.5$
), the value of
 $c_{t}^{m}$
depends on the area of the airfoil projected perpendicular to the streamwise direction. This area is related to the value of the pitch angle
 $\unicode[STIX]{x1D703}$
(figure 3
e). At the beginning of the downstroke (
 $t/T=0$
), cases A090 and B110 have a pitch angle
 $\unicode[STIX]{x1D703}$
of
 $0^{\circ }$
, so
 $c_{t}^{m}$
is roughly zero (figure 11
c). At this time instant,
 $c_{t}^{m}$
increases with the instantaneous pitch angle, so case B090 generates more thrust than cases A090 and B110 and less than cases C090 and B070. The same analysis holds at the beginning of the upstroke (
 $t/T=0.5$
), except that, in this part of the period, cases with different phase shifts (B070 and B110) interchange their roles.
To conclude the analysis of the different contributions to the total aerodynamic force, figure 11(e,f) shows the evolution of the surface vorticity contribution to the total aerodynamic thrust and lift. It can be seen that the effect that surface vorticity has on the forces is small compared with the other contributions for both thrust and lift, except for a peak of viscous drag in the upstroke of case C090. A possible explanation is related to the fact that the effective angle of attack during the upstroke is close to zero, as shown in figure 3(d), unlike the other cases considered. As a consequence, during the first half of the upstroke, the boundary layer in the lower surface is attached and thinner than in the other cases, with no appreciable LEV in the lower surface of the airfoil. This has been observed in visual inspection of the corresponding flow fields (not shown here). Hence, the skin friction in the lower surface of the airfoil is larger for case C090.
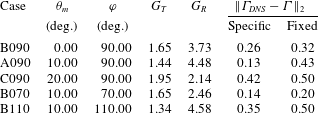
The coefficients of the Pesavento & Wang (Reference Pesavento and Wang2004) model for circulation (4.5) obtained from the best fit with the data from the DNS for the selected cases. The errors shown correspond to the circulation obtained with the coefficients obtained specifically for each case (next-to-last column) and fixed coefficients
 $G_{T}=1.85$
and
 $G_{R}=\unicode[STIX]{x03C0}$
(last column).
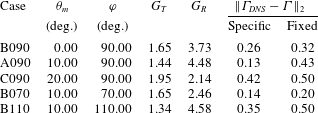
After describing the evolution of the different contributions to the total aerodynamic force, we proceed to check the capability of the chord-normal model proposed in the previous section to predict the contribution of the vorticity within the flow to the total aerodynamic force of the subset of cases A090, C090, B070 and B110. The first question is which values of
 $G_{T}$
and
 $G_{R}$
should be used in (4.5). In principle, one could obtain ‘specific’ values for
 $G_{T}$
and
 $G_{R}$
for each case, repeating the same least squares fitting process as described in § 4 but for cases A090, C090, B070 and B110. These specific coefficients, as well as the corresponding
 $L_{2}$
norms of the differences between the model and DNS circulations, are shown in table 2. It should be noted that, even if the variability of the coefficients with
 $\unicode[STIX]{x1D711}$
and
 $\unicode[STIX]{x1D703}_{m}$
is not small (around
 $\pm 19\,\%$
for
 $G_{T}$
and
 $\pm 35\,\%$
for
 $G_{R}$
), the assumption in Pesavento & Wang (Reference Pesavento and Wang2004) is that the coefficients
 $G_{T}$
and
 $G_{R}$
depend on the geometry, not on the kinematics. Indeed, the kinematics of the airfoil enters in (4.5) through
 $\unicode[STIX]{x1D6FC}_{e}$
and
 $\dot{\unicode[STIX]{x1D703}}$
.
To check the validity of this assumption, we have also computed ‘fixed’ values of these constants, choosing
 $G_{R}=\unicode[STIX]{x03C0}$
and fitting
 $G_{T}$
for all of the periodic cases in table 1 using a least squares method. The rationale for choosing
 $G_{R}=\unicode[STIX]{x03C0}$
comes from potential theory, which results in
 $$\begin{eqnarray}\unicode[STIX]{x1D6E4}_{ROT}=\unicode[STIX]{x03C0}c^{2}\dot{\unicode[STIX]{x1D703}}\left(\frac{3}{4}-\frac{x_{p}}{c}\right)\end{eqnarray}$$
for a thin airfoil in pitching motion (this can be derived from the expressions appearing in § 6.2 of Fung Reference Fung2002). The resulting
 $G_{T}=1.85$
, which is approximately the mean value of the ‘specific’ values obtained for
 $G_{T}$
, yields errors in the circulation
 $\unicode[STIX]{x1D6E4}$
of the same order of magnitude (see the last column in table 2). It should be noted also that from the point of view of modelling, ‘fixed’ values of
 $G_{T}$
and
 $G_{R}$
are more interesting than ‘specific’ values for these constants, since the former can be used to predict the circulation without having to run a DNS or an experiment. We have tried to fit the values of
 $G_{T}$
and
 $G_{R}$
in slightly different ways (for instance,
 $G_{T}=1$
and fit
 $G_{R}$
), but in all cases the
 $L_{2}$
norms of the differences in the circulation were similar to those presented in table 2. From that point of view, it could be argued that the results presented below are robust with respect to the values of these two parameters.
Chord-normal estimation of the contribution of vorticity within the flow for the selected cases. The circulation is given by the model (4.5) with coefficients
 $G_{T}=1.85$
and
 $G_{R}=\unicode[STIX]{x03C0}$
. (a) Thrust and (b) lift for case B090 (DNS – – –, black and model ——, black). (c) Thrust and (d) lift for cases A090 (DNS – – –, blue and model ——, blue) and C090 (DNS – – –, red and model ——, red). (e) Thrust and (f) lift for cases B070 (DNS – – –, blue and model ——, blue) and B110 (DNS – – –, red and model ——, red). The downstroke (upstroke) is indicated by a light (dark) grey background.

Figure 12 shows the goodness of the chord-normal model (
 $\boldsymbol{F}^{v}$
perpendicular to the chord, modulus of
 $\boldsymbol{F}^{v}$
given by (4.5) and (4.4),
 $G_{T}=1.85$
and
 $G_{R}=\unicode[STIX]{x03C0}$
) in predicting
 $c_{t}^{v}$
and
 $c_{l}^{v}$
for the selected cases. Results for case B090 are given in figure 12(a,b), showing similar results to those obtained when using specific coefficients (figure 10). This is consistent with the values of the
 $L_{2}$
norm shown in table 2. Figures 12(c) and (d) show the evolution of
 $c_{t}^{v}$
and
 $c_{l}^{v}$
respectively for cases A090 and C090 (varying the mean pitch angle). Both
 $c_{t}^{v}$
and
 $c_{l}^{v}$
are properly predicted for case A090, but the differences between the chord-normal estimation and the results obtained from the DNS are larger for case C090. These differences consist of both a small time shift and a change in the peak values. Figure 12(e,f) presents the comparison of the model and the DNS for B070 and B110 (varying the phase shift), showing a better prediction for case B070 than for case B110. Overall, the results in figure 12 suggest that the chord-normal model for the vorticity within the flow works better for moderate
 $\unicode[STIX]{x1D703}_{m}$
and
 $\unicode[STIX]{x1D711}\lesssim 90^{\circ }$
.
6 Prediction of total aerodynamic forces
In this section, we estimate the total aerodynamic force, taking into account the results presented throughout the paper. We discuss two different models, namely M1 and M2. While M1 introduces features based on observations made through this work, M2 is selected for comparison, based on previous work (Pesavento & Wang Reference Pesavento and Wang2004; Andersen et al.
Reference Andersen, Pesavento and Wang2005). Both models consider inertial effects originating from the motion of the airfoil and forces produced by the vorticity within the flow. In M1, the inertial force is the body motion term of Chang (Reference Chang1992),
 $\boldsymbol{F}^{m}$
, and it is computed using (2.2) and the auxiliary potential given in figure 17. The force due to the vorticity within the flow is estimated as discussed in the previous section:
 $\boldsymbol{F}^{v}$
is normal to the airfoil chord, with a modulus given by (4.4) and (4.5).
On the other hand, M2 is the model proposed by Andersen et al. (Reference Andersen, Pesavento and Wang2005), but without the viscous terms. The effect of the body motion is estimated using the added-mass expressions of Sedov (Reference Sedov1965) for a flat plate hinged at
 $c/4$
. The contribution from the vorticity within the flow is estimated as a force perpendicular to the effective velocity
 $\boldsymbol{U}$
, with modulus given by (4.4) and (4.5).
It should be noted that in order to minimize the differences between M1 and M2, the coefficients in (4.5) are
 $C_{T}=1.85$
and
 $C_{R}=\unicode[STIX]{x03C0}$
for both models. Still, there are two important differences between M1 and M2. First, the nature of the contribution from the inertial forces, which in M1 can yield a net force (i.e.
 $\overline{c}_{t}^{m}$
and
 $\overline{c}_{l}^{m}$
are not necessarily zero), while in M2 it does not yield a net force. Second, the orientation of the contribution from the vorticity within the flow, which is one of the main observations of § 4.
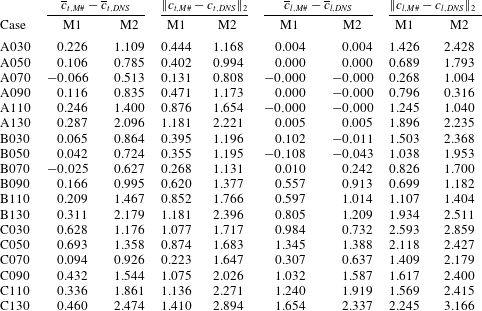
Mean and
 $L_{2}$
norm of the difference between an estimation of the thrust and lift and the value obtained from the DNS. The models presented correspond to the estimation proposed in the present work (M1) and an estimation taken from the literature (M2; see Andersen et al.
Reference Andersen, Pesavento and Wang2005).
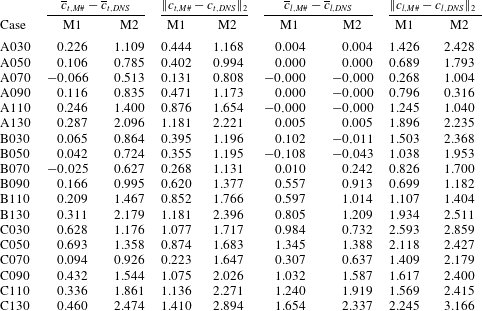
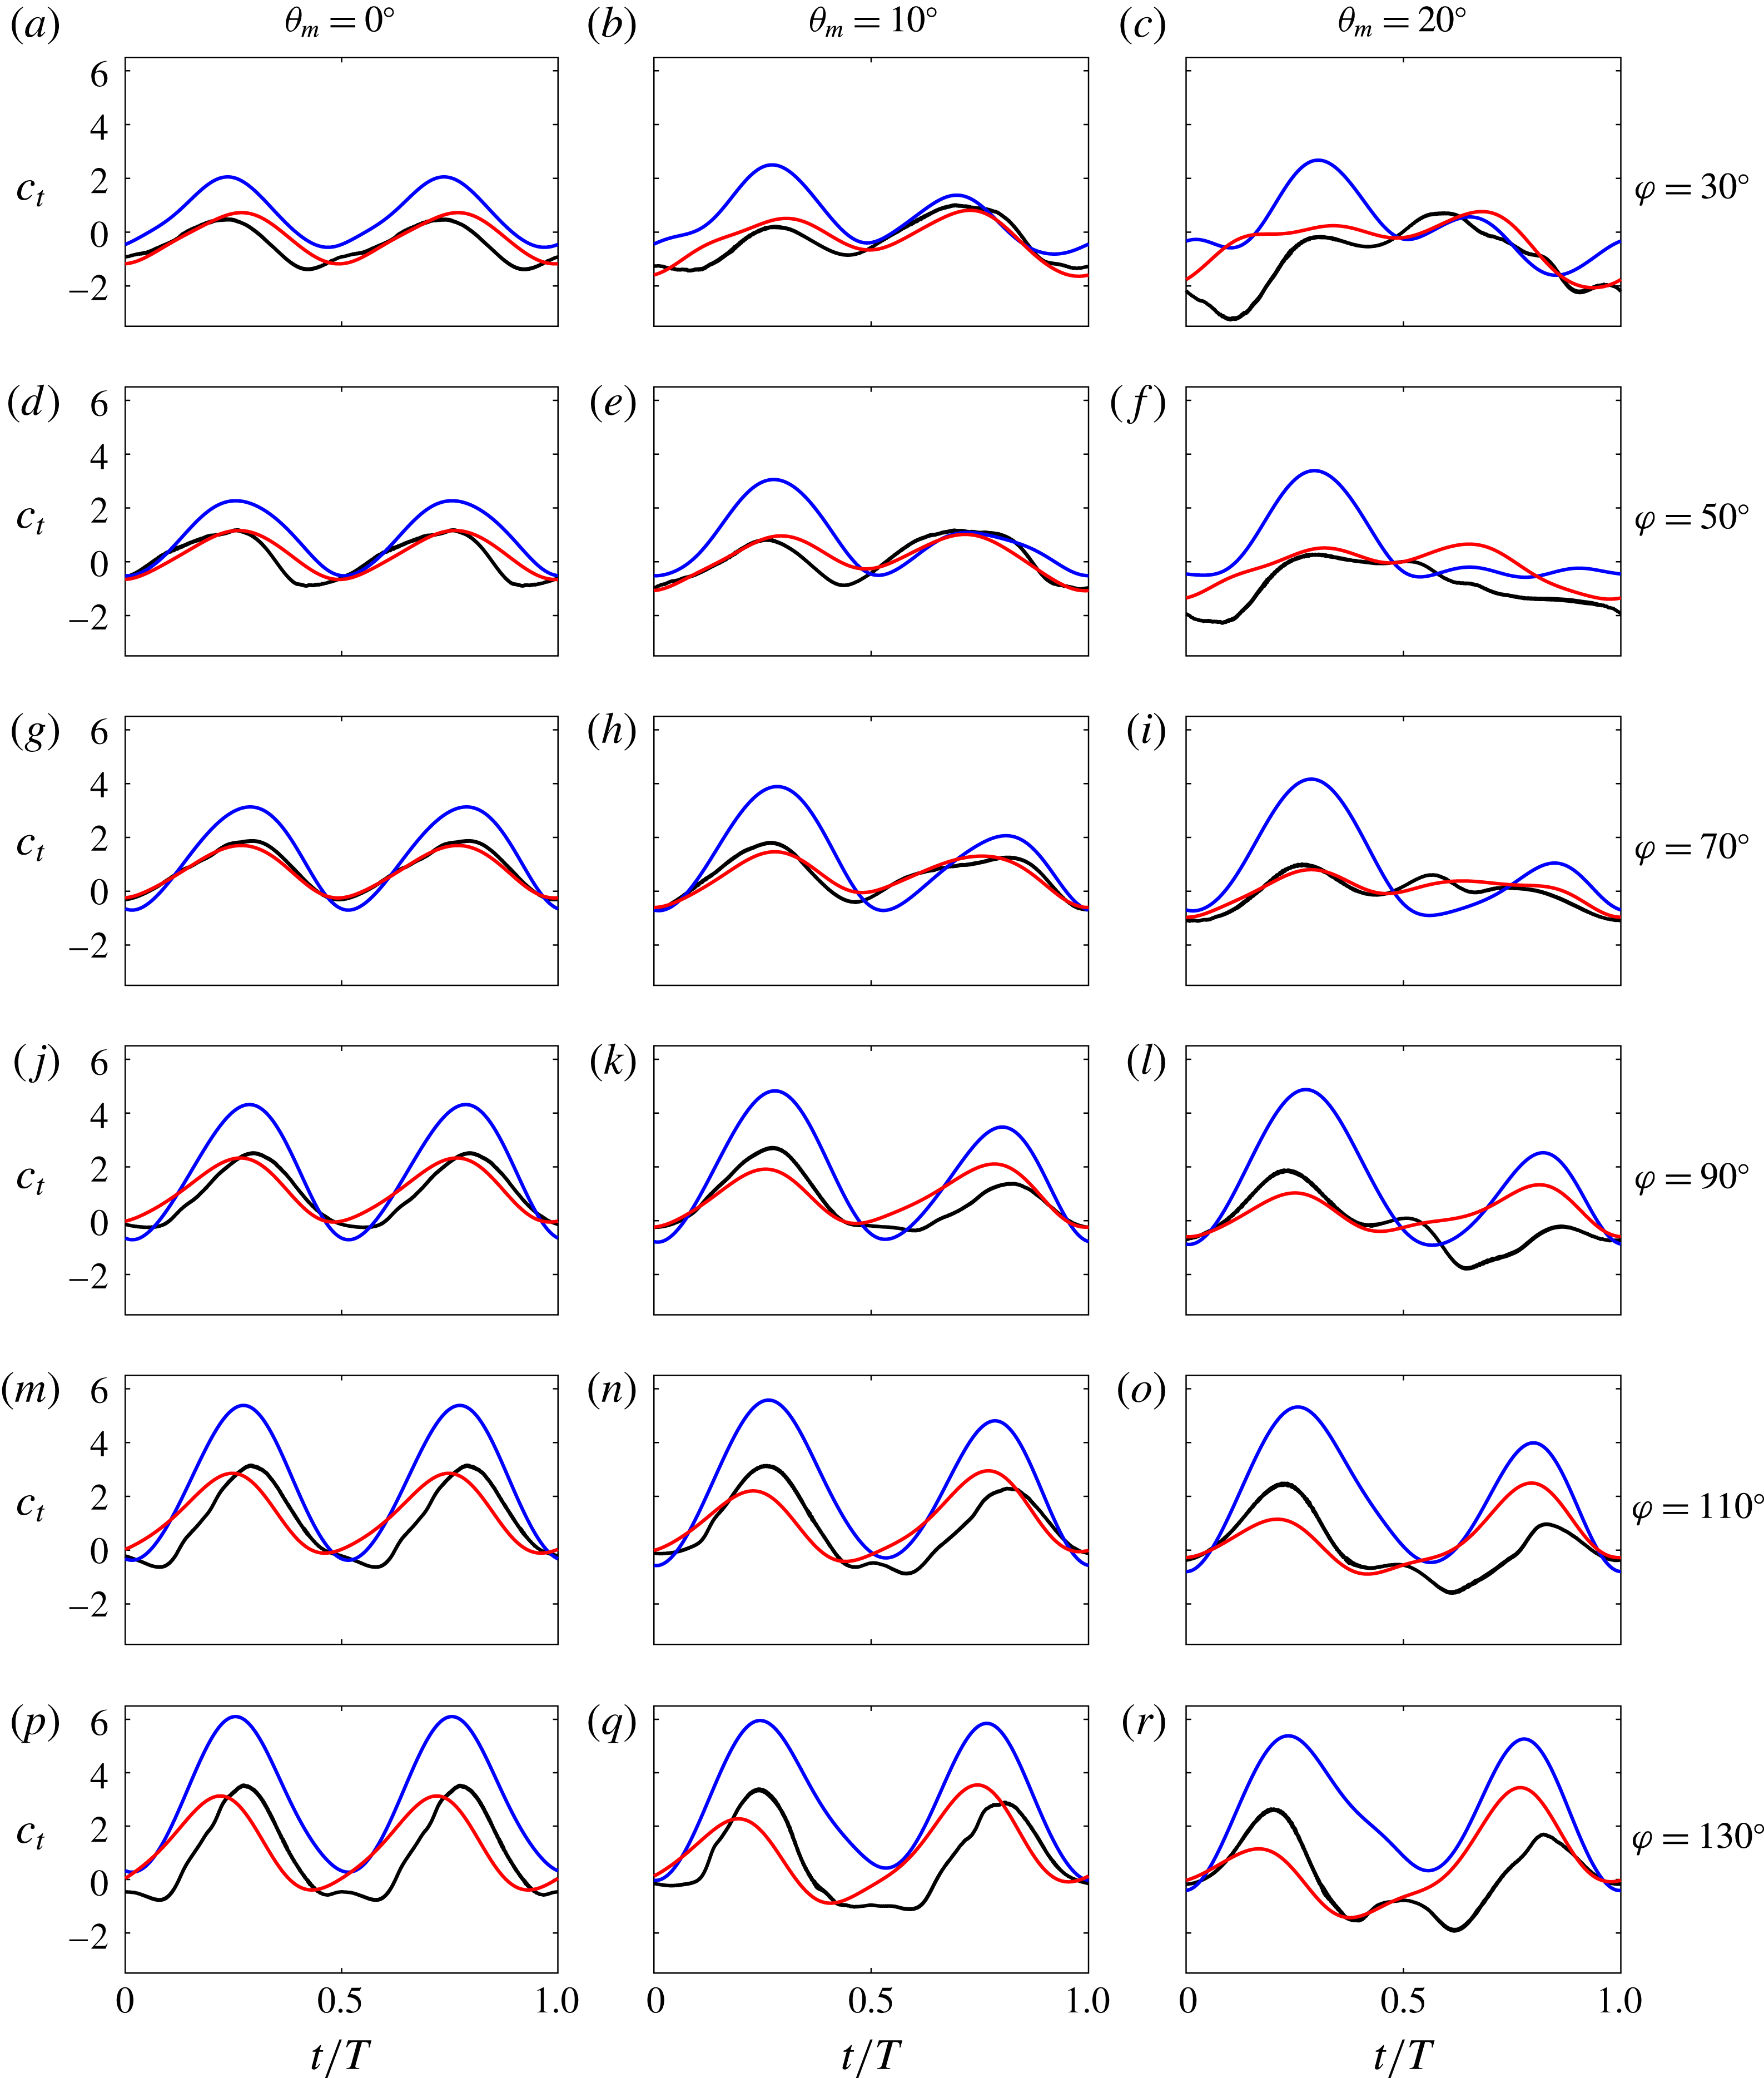
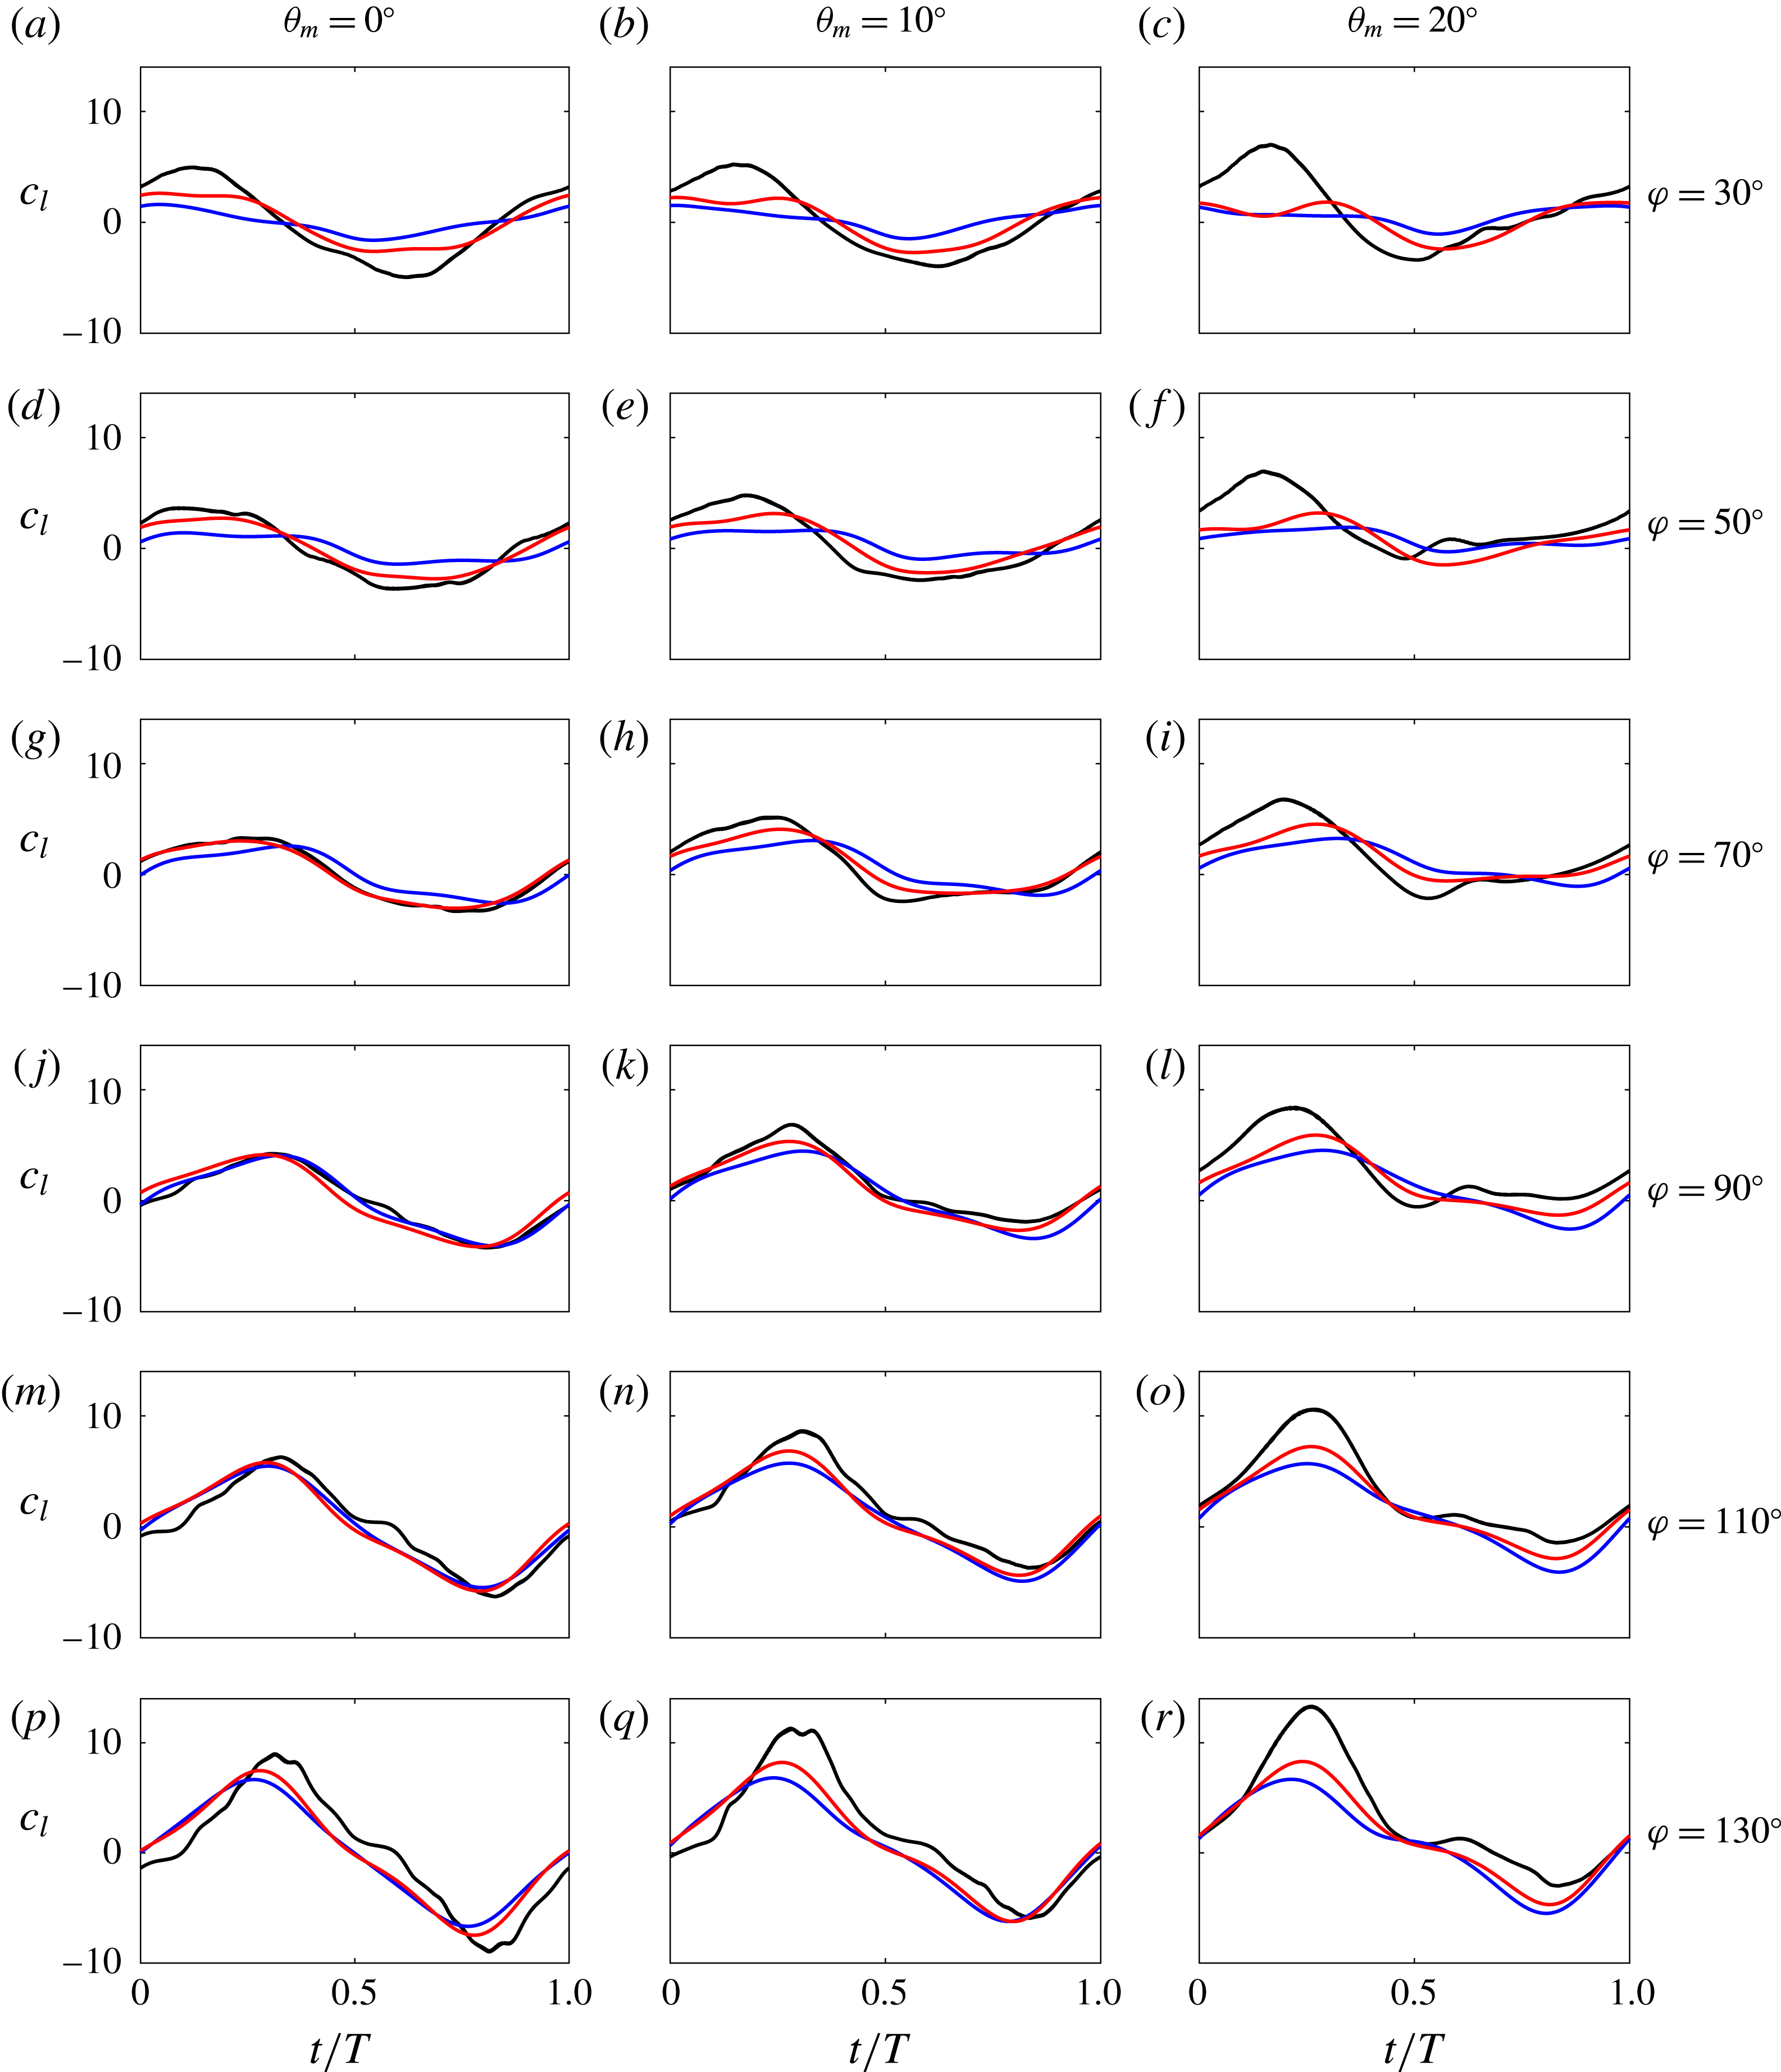
Table 3 shows a quantitative comparison of the estimations of M1 and M2 in terms of the differences between the mean and instantaneous values of the lift and thrust coefficients of each model and the DNS. The data in table 3 are complemented by figures 13–15, which show the instantaneous force coefficients obtained with both models and with the DNS.
Starting with the thrust, the predicted mean and instantaneous values are consistently improved with M1 with respect to M2. Furthermore,
 $\overline{c}_{t,M1}$
shows good agreement with the DNS results, with differences between M1 and DNS lower than 20 % of the r.m.s. of the total thrust. The estimate of mean thrust becomes less accurate for cases with
 $\unicode[STIX]{x1D703}_{m}=20^{\circ }$
, with differences of the order of 50 % of the r.m.s. of the total force. Interestingly, cases with
 $\unicode[STIX]{x1D711}=70^{\circ }$
show the smallest differences in thrust for each
 $\unicode[STIX]{x1D703}_{m}$
. This can also be appreciated in the instantaneous values of
 $c_{t}$
shown in figure 13 (compare the results of (g,h,i) with the other panels). As with the mean values, the estimations of the instantaneous thrust coefficients of M1 are less accurate for
 $\unicode[STIX]{x1D703}_{m}=20^{\circ }$
. Moreover, when
 $\unicode[STIX]{x1D711}\geqslant 110^{\circ }$
, the instantaneous values of
 $c_{t}$
from M1 tend to peak earlier than the corresponding DNS values (see figure 13
m,n,p,q).
Total thrust obtained from the DNS (——, black) together with the estimations with M1 (——, red) and M2 (——, blue).

Total lift obtained from the DNS (——, black) together with the estimations with M1 (——, red) and M2 (——, blue).

Regarding the mean lift, the predictions of M1 are, in general, better than those of M2, except for cases B030, B050 and C030. However, for these cases, the
 $L_{2}$
norms of the differences between M1 and the DNS are smaller than those corresponding to M2 (see also figure 14
b,c,e). The predictions of M1 in terms of the r.m.s. of the lift coefficient improve with respect to M2 for all cases, except for A090 and A110. Cases with phase shift
 $\unicode[STIX]{x1D711}<90^{\circ }$
present differences in mean lift lower than 5 % of the r.m.s. of total lift and cases with higher phase shift
 $\unicode[STIX]{x1D711}\geqslant 90^{\circ }$
present differences lower than 20 %. Instantaneous values are very well captured for cases with
 $\unicode[STIX]{x1D703}_{m}=0^{\circ }$
,
 $10^{\circ }$
and
 $50\leqslant \unicode[STIX]{x1D711}\leqslant 110^{\circ }$
(figure 14). Again, a shift between both models and the DNS appears for the cases with higher phase shift (
 $\unicode[STIX]{x1D711}=130^{\circ }$
), and errors tend to increase when the mean pitch angle is increased to
 $\unicode[STIX]{x1D703}_{m}=20^{\circ }$
. For the latter, the peak in the lift during the downstroke is consistently underestimated by both models. Finally, for the symmetric cases (
 $\unicode[STIX]{x1D703}_{m}=0^{\circ }$
), the estimated mean lift is zero in both models (as expected). The differences that appear in cases A030 and A130 between the models and the DNS arise from the averaging process of the DNS data, due to the aperiodic nature of these cases.
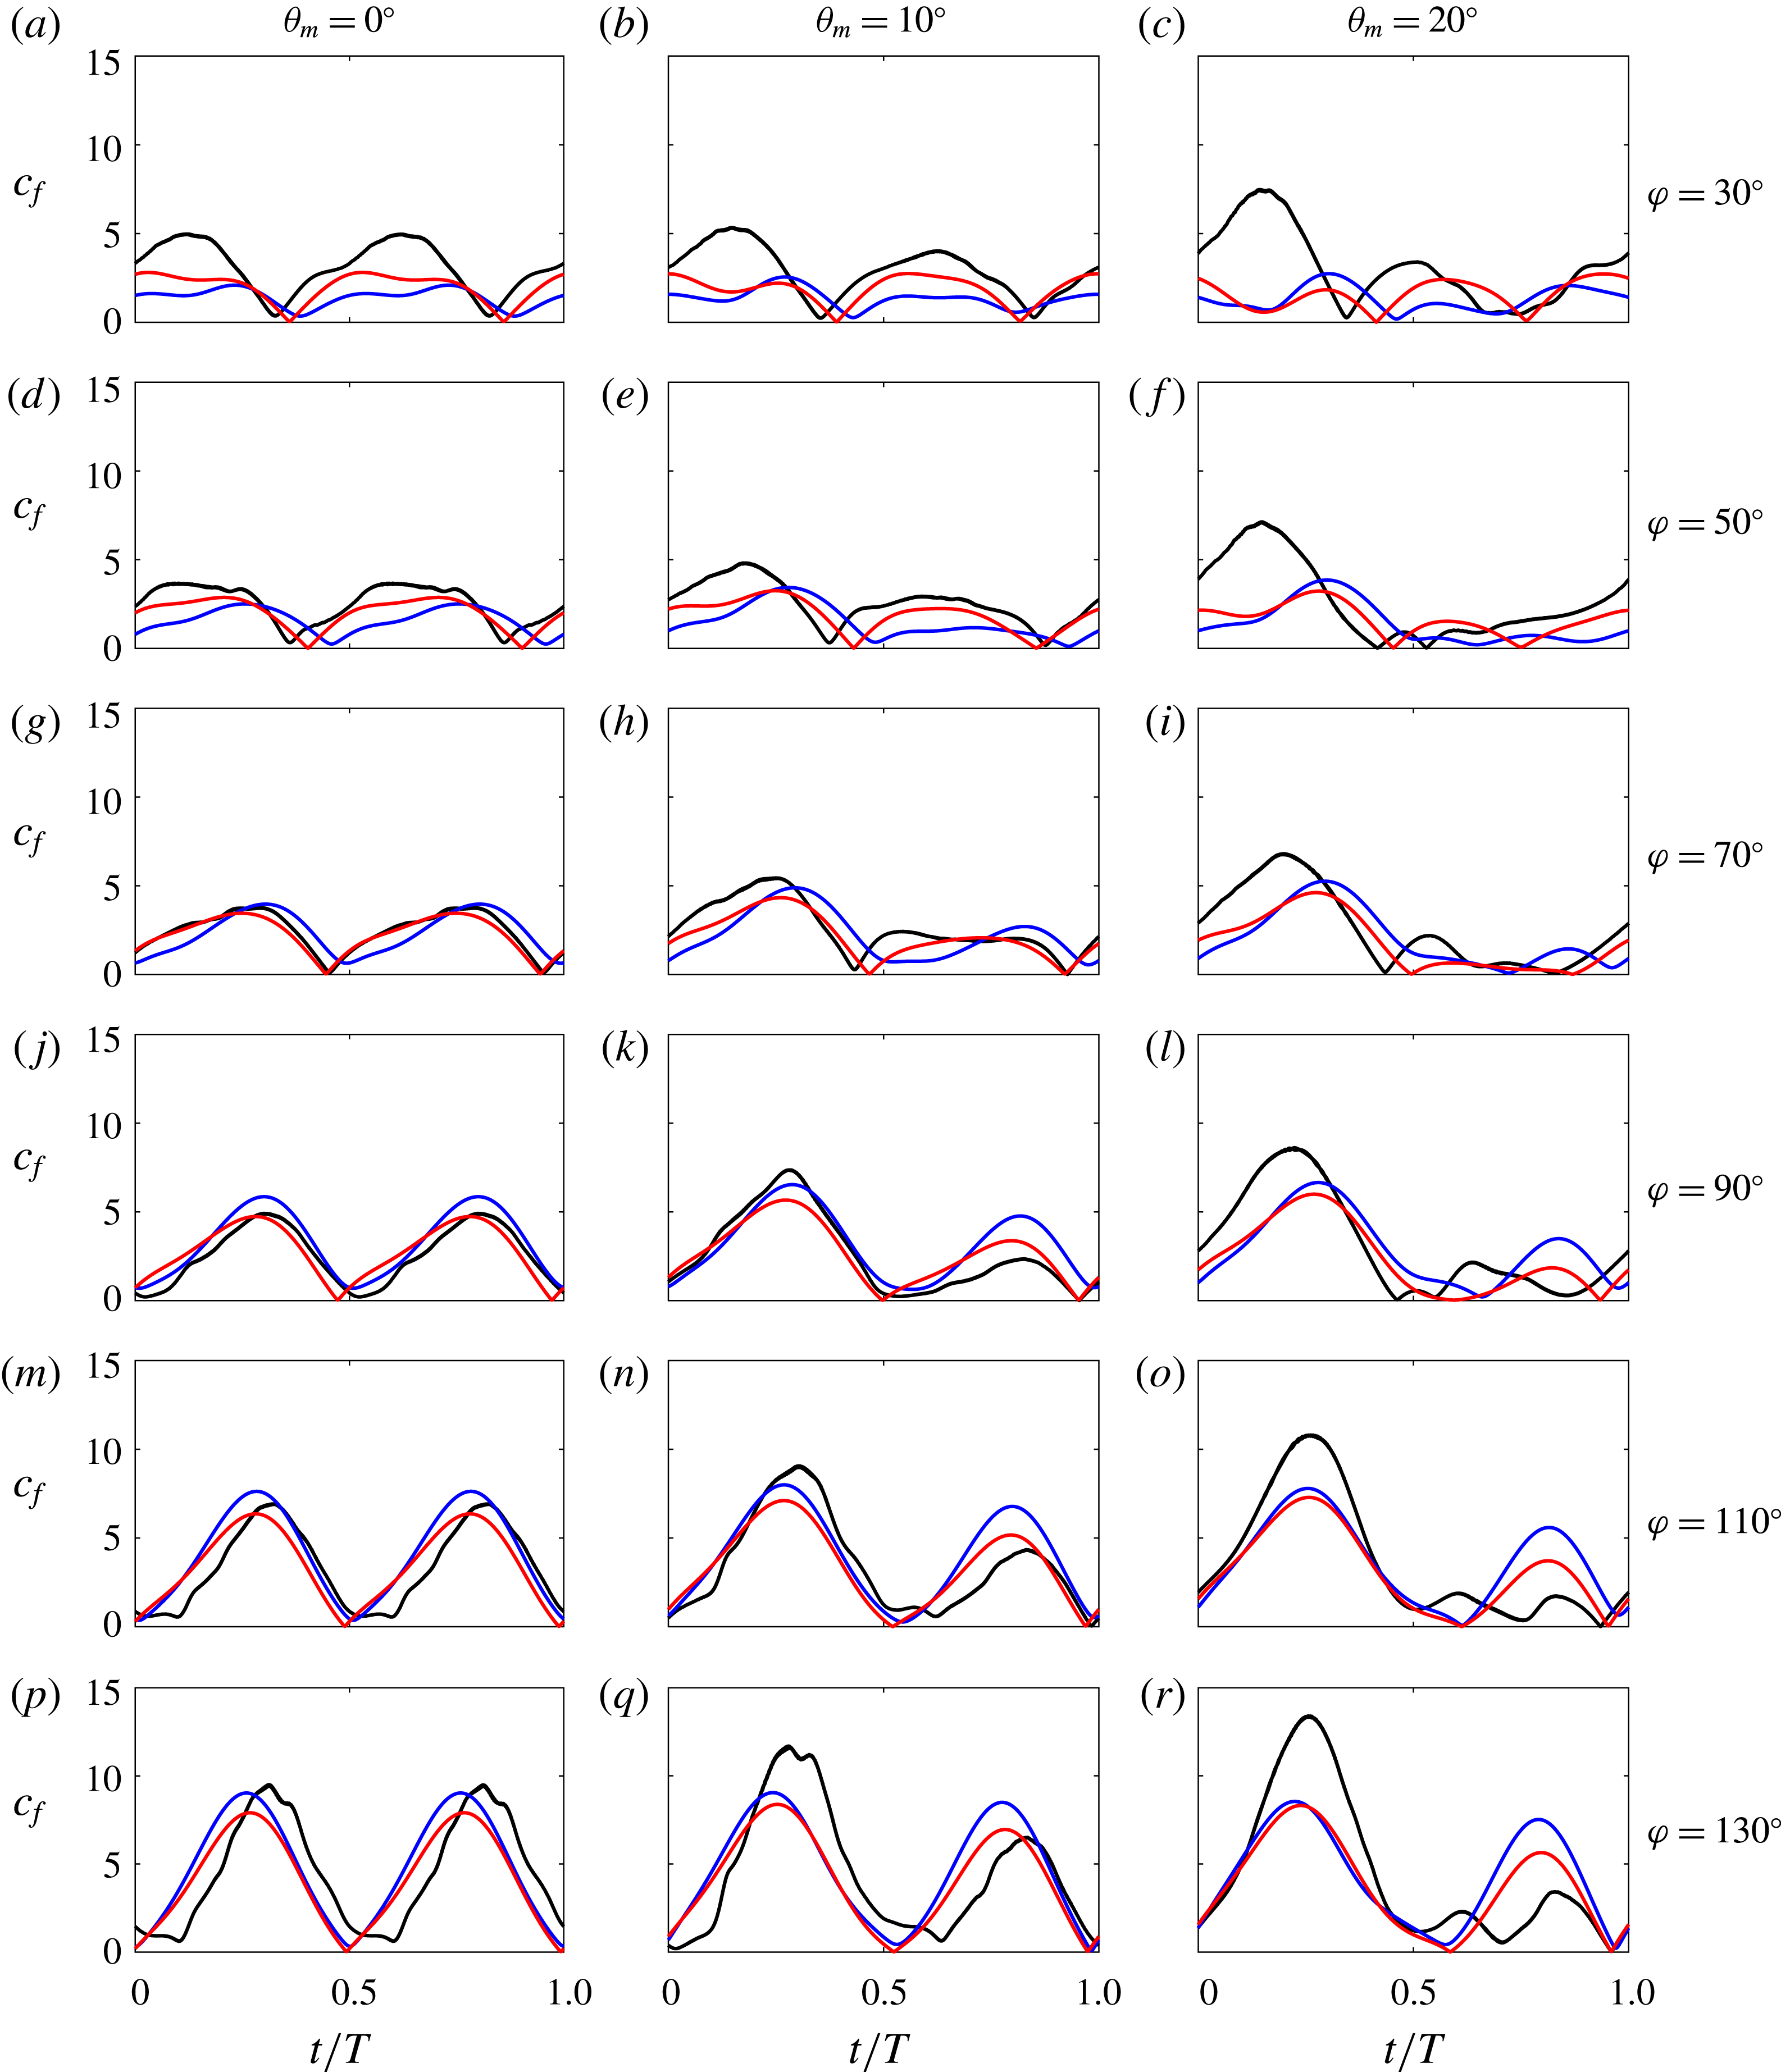
The different behaviour of the models in the prediction of lift and thrust coefficients is in part due to the ability of the models to predict the orientation of the aerodynamic force properly. In order to compare the two models and the DNS without taking this effect into account, figure 15 shows the total aerodynamic force coefficient, defined as
 $$\begin{eqnarray}c_{f}=\sqrt{c_{l}^{2}+c_{t}^{2}}.\end{eqnarray}$$
It can be observed in figure 15 that the agreement between both models and the DNS for
 $\unicode[STIX]{x1D703}_{m}=0^{\circ }$
,
 $10^{\circ }$
and
 $50^{\circ }\lesssim \unicode[STIX]{x1D711}\lesssim 110^{\circ }$
is reasonably good. For
 $\unicode[STIX]{x1D711}=30^{\circ }$
and
 $\unicode[STIX]{x1D703}_{m}=0^{\circ }$
,
 $10^{\circ }$
, the amplitude of
 $c_{f}$
from the DNS is larger than the values from both models. For
 $\unicode[STIX]{x1D711}=130^{\circ }$
and
 $\unicode[STIX]{x1D703}_{m}=0^{\circ }$
,
 $10^{\circ }$
, the magnitudes of the peaks of
 $c_{f}$
are reasonably captured, but the models are shifted in time with respect the DNS data. For
 $\unicode[STIX]{x1D703}_{m}=20^{\circ }$
, independently of the value of
 $\unicode[STIX]{x1D711}$
, the peak of
 $c_{f}$
during the downstroke is underestimated in both models, which suggests that the model used for the circulation (namely (4.5)) might not be properly capturing the development and evolution of the LEV for these high-angle-of-attack cases. It should be noted also that the differences between M1 and M2 in
 $c_{f}$
and
 $c_{l}$
(figures 14 and 15) are less apparent than in
 $c_{t}$
in figure 13. This suggests that the chord-normal orientation of the contribution of the vorticity within the flow is more important for the prediction of the thrust.
Finally, it should be noted that the model proposed here has some limitations. As discussed in § 4,
 $\boldsymbol{F}^{v}$
is approximately normal to the chord of the airfoil when the LEV is strong enough, and even in this case there is a small component of
 $\boldsymbol{F}^{v}$
tangential to the airfoil chord. This tangential component is unimportant for the cases discussed here, but it can be significant in some cases, like the pure heaving case. Indeed, for a pure heaving case at zero pitch angle, M1 predicts
 $c_{t}=0$
(since both vorticity within the flow and body motion components result in forces perpendicular to the chord). This means that further work is needed to widen the range of applicability of M1, in order to include pure heaving cases.
Total aerodynamic force modulus obtained from the DNS (——, black) together with the estimations with M1 (——, red) and M2 (——, blue).

7 Conclusions
In this work, we have generated and analysed a database of DNS of heaving and pitching airfoils, with large-amplitude motions, moderate Reynolds numbers and reduced frequencies of order
 $O(1)$
. In order to analyse the effect of the mean pitch angle and the phase shift, we have varied these parameters in the ranges
 $\unicode[STIX]{x1D703}_{m}\in [0^{\circ },20^{\circ }]$
and
 $\unicode[STIX]{x1D711}\in [30^{\circ },130^{\circ }]$
. In terms of the lift and thrust obtained by these configurations, we observe that as
 $\unicode[STIX]{x1D703}_{m}$
increases, the mean lift increases and the mean thrust decreases, with little variation in the amplitude of the instantaneous fluctuations. This is consistent with a change in the orientation of the force when
 $\unicode[STIX]{x1D703}_{m}$
varies, analogous to a change in the stroke plane. On the other hand, the effect of the phase shift is less intuitive: the net lift and thrust increase with
 $\unicode[STIX]{x1D711}$
for
 $\unicode[STIX]{x1D711}\lesssim 110^{\circ }$
, as well as the amplitude of their fluctuations. As a consequence, in our database, the maximum propulsion efficiency is obtained for
 $\unicode[STIX]{x1D711}=90^{\circ }$
and the maximum force is obtained for
 $\unicode[STIX]{x1D711}=110^{\circ }$
. This is consistent with previous investigations (Anderson et al.
Reference Anderson, Streitlien, Barret and Triantafyllou1998; Ramamurti & Sandberg Reference Ramamurti and Sandberg2001).
Subsequently, we have decomposed the total aerodynamic force following Chang (Reference Chang1992). We observe that for the considered kinematics, the contributions from the vorticity within the flow and the body motion are comparable, while the surface vorticity contribution is significantly smaller. The contribution of vorticity within the flow is influenced only by the vortices in the vicinity of the airfoil and is roughly perpendicular to the chord. It should be noted that since vorticity within the flow is the main contributor to the net aerodynamic forces, the effects of
 $\unicode[STIX]{x1D711}$
and
 $\unicode[STIX]{x1D703}_{m}$
are the same as discussed in the previous paragraph for the total forces. Conversely, for a given value of
 $\unicode[STIX]{x1D703}_{m}$
, the net contribution from body motion to the thrust and lift increases monotonically with
 $\unicode[STIX]{x1D711}$
.
Finally, based on the observations made from the force decomposition analysis, we have proposed and tested a reduced-order model for the aerodynamic forces. We computed the body motion contribution directly from Chang (Reference Chang1992), since it only depends on geometric characteristics of the airfoil (the auxiliary potentials) and on the kinematics. We modelled the vorticity within the flow contribution as a force perpendicular to the chord and whose modulus is proportional to the circulation of the airfoil. This circulation was calculated with the model of Pesavento & Wang (Reference Pesavento and Wang2004). The only parameters that need fitting are the constants
 $G_{T}$
and
 $G_{R}$
appearing in the model for the circulation. Our results show that these two constants can be fixed for the whole database, keeping a reasonable error in the force estimation, which suggests that the model is able to take into account the kinematic parameters that were varied in this study (
 $\unicode[STIX]{x1D703}_{m}$
and
 $\unicode[STIX]{x1D711}$
). Overall, the model is able to predict the mean thrust and lift with errors smaller than 20 % of the r.m.s. of the corresponding forces for
 $\unicode[STIX]{x1D703}_{m}=0^{\circ }$
and
 $10^{\circ }$
. From the point of view of the instantaneous forces, the agreement between the model and the DNS data is very satisfactory for
 $\unicode[STIX]{x1D703}_{m}=0^{\circ }$
and
 $10^{\circ }$
, and
 $50^{\circ }\lesssim \unicode[STIX]{x1D711}\lesssim 110^{\circ }$
. For
 $\unicode[STIX]{x1D703}_{m}=20^{\circ }$
, the instantaneous forces suggest that the error in the estimation of the mean forces is due to underestimation of the intensity of the LEV during the downstroke. The predictions of the proposed model are compared with those of a similar model from the literature, showing a noticeable improvement in the prediction of the mean thrust and a smaller improvement in the prediction of the mean lift and the instantaneous force coefficients.
Acknowledgements
The authors acknowledge the support received from the Spanish Ministry of Economy and Competitiveness through grant TRA2013-41103-P. This grant includes FEDER funding.
Supplementary movie
Supplementary movie is available at https://doi.org/10.1017/jfm.2017.508.
Appendix A. Grid refinement study
Evolution of (a) thrust and (b) lift for cases with
 $c/\unicode[STIX]{x0394}x=64$
(——, blue),
 $c/\unicode[STIX]{x0394}x=128$
(——, red) and
 $c/\unicode[STIX]{x0394}x=256$
(——, black). Errors obtained in mean (


In this section, we present the grid refinement study carried out to select the resolution used in the simulations. In order to save computational time, a smaller computational domain was employed in the grid refinement study, namely
 $12c\times 8c$
in the streamwise and vertical directions respectively. The parameters of the case under consideration correspond to case A090 reported in table 1. This is a case in which mean thrust is produced while the mean lift is zero. We have performed seven simulations varying the resolution from
 $c/\unicode[STIX]{x0394}x=64$
to
 $c/\unicode[STIX]{x0394}x=256$
, and the time step
 $\unicode[STIX]{x0394}t$
is set accordingly to keep a Courant–Friedrich–Levy number lower than 0.2. We study the convergence of the aerodynamic forces when increasing the resolution, and we use as reference data the results of the case with the highest resolution (
 $c/\unicode[STIX]{x0394}x=256$
). The time evolutions of the thrust and lift coefficients of three of the simulations are reported in figure 16(a,b). While some deviations are observed for the resolution
 $c/\unicode[STIX]{x0394}x=64$
with respect to the reference case, the results of the simulation with resolution
 $c/\unicode[STIX]{x0394}x=128$
are very close to those of the reference case. In order to quantify the differences, we define the errors in the mean and r.m.s. of the forces,
 $$\begin{eqnarray}\displaystyle & \displaystyle \unicode[STIX]{x1D716}_{t}^{mean}(r)=\frac{|{\overline{c}_{t}}_{r}-{\overline{c}_{t}}_{256}|}{{c_{t}^{\prime }}_{256}}, & \displaystyle\end{eqnarray}$$
 $$\begin{eqnarray}\displaystyle & \displaystyle \unicode[STIX]{x1D716}_{t}^{rms}(r)=\frac{|{c_{t}^{\prime }}_{r}-{c_{t}^{\prime }}_{256}|}{{c_{t}^{\prime }}_{256}}, & \displaystyle\end{eqnarray}$$
 $$\begin{eqnarray}\displaystyle & \displaystyle \unicode[STIX]{x1D716}_{l}^{mean}(r)=\frac{|{\overline{c}_{l}}_{r}|}{{c_{l}^{\prime }}_{256}}, & \displaystyle\end{eqnarray}$$
 $$\begin{eqnarray}\displaystyle & \displaystyle \unicode[STIX]{x1D716}_{l}^{rms}(r)=\frac{|{c_{l}^{\prime }}_{r}-{c_{l}^{\prime }}_{256}|}{{c_{l}^{\prime }}_{256}}, & \displaystyle\end{eqnarray}$$
 $r$
is the resolution of each case. Since the case under consideration produces no lift, the definition of
 $\unicode[STIX]{x1D716}_{l}^{mean}(r)$
does not need to have a reference mean lift. Figure 16(c,d) shows the errors as a function of the resolution. It should be noted that
 $\unicode[STIX]{x1D716}_{l}^{mean}(r)$
is not shown in figure 16(d) since it is smaller than
 $10^{-4}$
for all of the cases. In general, the errors decrease with increasing resolution. To achieve a compromise between the computational cost and the accuracy of the results, we decided to use a resolution of
 $c/\unicode[STIX]{x0394}x=128$
in our calculations. With this resolution, the errors for both the mean and the r.m.s. of the forces are smaller than 2 %, as shown in the figure.
Appendix B. Calculation of auxiliary potential functions
The force decomposition algorithm used in this work was first introduced by Chang (Reference Chang1992) and later used by Martín-Alcántara et al. (Reference Martín-Alcántara, Fernandez-Feria and Sanmiguel-Rojas2015). The algorithm requires two auxiliary potential functions
 $\unicode[STIX]{x1D719}_{x}$
and
 $\unicode[STIX]{x1D719}_{z}$
(see (2.2)), which are defined as
 $$\begin{eqnarray}\displaystyle & \unicode[STIX]{x1D6FB}^{2}\unicode[STIX]{x1D719}_{x}=0, & \displaystyle\end{eqnarray}$$
 $$\begin{eqnarray}\displaystyle & \unicode[STIX]{x1D735}\unicode[STIX]{x1D719}_{x}\boldsymbol{\cdot }\boldsymbol{n}=-\boldsymbol{n}\boldsymbol{\cdot }\boldsymbol{e}_{x}U_{\infty }\quad \text{at the body surface}, & \displaystyle\end{eqnarray}$$
 $$\begin{eqnarray}\displaystyle & \unicode[STIX]{x1D719}_{x}\rightarrow 0\quad \text{at infinity,} & \displaystyle\end{eqnarray}$$
 $$\begin{eqnarray}\displaystyle & \unicode[STIX]{x1D6FB}^{2}\unicode[STIX]{x1D719}_{z}=0, & \displaystyle\end{eqnarray}$$
 $$\begin{eqnarray}\displaystyle & \unicode[STIX]{x1D735}\unicode[STIX]{x1D719}_{z}\boldsymbol{\cdot }\boldsymbol{n}=-\boldsymbol{n}\boldsymbol{\cdot }\boldsymbol{e}_{z}U_{\infty }\quad \text{at the body surface}, & \displaystyle\end{eqnarray}$$
 $$\begin{eqnarray}\displaystyle & \unicode[STIX]{x1D719}_{z}\rightarrow 0\quad \text{at infinity,} & \displaystyle\end{eqnarray}$$
 $\boldsymbol{n}$
is a unitary vector normal to the surface of the airfoil pointing towards the fluid.
The auxiliary potential functions
 $\unicode[STIX]{x1D719}_{x}$
and
 $\unicode[STIX]{x1D719}_{z}$
are needed at every time step in which the force decomposition is to be applied. These potentials depend only on the airfoil geometry and on the direction of the free stream velocity, not on the heaving and pitching velocities and accelerations. It should be noted that the dependence on the orientation is linear, so that it is possible to show that for an arbitrary direction
 $\unicode[STIX]{x1D736}=\unicode[STIX]{x1D6FC}_{1}\boldsymbol{e}_{x}+\unicode[STIX]{x1D6FC}_{2}\boldsymbol{e}_{z}$
, the corresponding potential
 $\unicode[STIX]{x1D719}_{\unicode[STIX]{x1D6FC}}$
satisfies
 $$\begin{eqnarray}\displaystyle & \unicode[STIX]{x1D6FB}^{2}\unicode[STIX]{x1D719}_{\unicode[STIX]{x1D6FC}}=0, & \displaystyle\end{eqnarray}$$
 $$\begin{eqnarray}\displaystyle & \unicode[STIX]{x1D735}\unicode[STIX]{x1D719}_{\unicode[STIX]{x1D6FC}}\boldsymbol{\cdot }\boldsymbol{n}=-\boldsymbol{n}\boldsymbol{\cdot }\unicode[STIX]{x1D736}U_{\infty }\quad \text{at the body surface}, & \displaystyle\end{eqnarray}$$
 $$\begin{eqnarray}\displaystyle & \unicode[STIX]{x1D719}_{\unicode[STIX]{x1D6FC}}\rightarrow 0\quad \text{at infinity}. & \displaystyle\end{eqnarray}$$
 $\unicode[STIX]{x1D719}_{\unicode[STIX]{x1D6FC}}=\unicode[STIX]{x1D6FC}_{1}\unicode[STIX]{x1D719}_{x}+\unicode[STIX]{x1D6FC}_{2}\unicode[STIX]{x1D719}_{z}$
.
The linearity with the orientation eliminates the problem of having to compute the auxiliary potential functions at different time instants. Instead, the auxiliary potential functions are computed for a reference position of the airfoil, and then rotated (using (B 3)) and translated to the position of the airfoil at each time instant.
Auxiliary potentials (a)
 $\unicode[STIX]{x1D719}_{x}$
and (b)
 $\unicode[STIX]{x1D719}_{z}$
for an NACA 0012 airfoil at
 $\unicode[STIX]{x1D703}=0^{\circ }$
.

Finally, it should be noted that the auxiliary potential functions
 $\unicode[STIX]{x1D719}_{x}$
and
 $\unicode[STIX]{x1D719}_{z}$
only have analytical solutions for simple geometries, like ellipses (Martín-Alcántara et al.
Reference Martín-Alcántara, Fernandez-Feria and Sanmiguel-Rojas2015). For other geometries, like the NACA 0012 considered in the present work, they need to be computed numerically. This is done using the sharp-interface method of Mittal et al. (Reference Mittal, Dong, Bozkurttas, Najjar, Vargas and Von Loebbecke2008), which is based on an immersed boundary formulation where normal derivatives on the solid boundary are imposed by using image and ghost points. The implementation of the solver has been validated by computing the potential function for ellipses of different aspect ratios, and comparing the numerical results with the analytical solutions. For the computations of the potential functions at the reference orientation of the NACA 0012 airfoils (shown in figure 17), we have employed a computational domain of
 $30c\times 30c$
. This domain has been discretized using
 $6072\times 6072$
grid points in the chordwise and vertical directions respectively. The translated and rotated potential functions are then interpolated with a linear interpolator to the collocation points where the integrals of (2.2) are computed.
In order to compute the body motion contribution
 $\boldsymbol{F}^{m}$
to the total aerodynamic force, we present the values of the potentials
 $\unicode[STIX]{x1D719}_{x}$
and
 $\unicode[STIX]{x1D719}_{z}$
at the surface of an NACA 0012 airfoil in the reference position (figure 17
a,b).