I. INTRODUCTION
Flexible electronic devices with high portability, light weight, and high durability to mechanical impact have been developed for various applications such as displays, Reference Forrest1 batteries, Reference Nam, Kim, Yoo, Chiang, Meethong, Hammond, Chiang and Belcher2,Reference Li, Lee, Kim, Kim, Park, Kim, Shin, Choi and Ko3 solar cells, Reference Coakley and McGehee4 and electronic skins. Reference Someya, Sekitani, Iba, Kato, Kawaguchi and Sakurai5 With the flexible devices approaching the market, strong requirements are being placed on the mechanical and electrical performance during the long-term usage of the devices. In typical flexible device systems, consisting of various organic and inorganic materials, one of the weakest parts against mechanical deformation is the metal layer, which is used as an electrode or an interconnect.
The stability of metal films under mechanical deformation needs to be addressed for monotonic tensile loading as well as for fatigue failure. When a large strain is applied, the mechanical and electrical failure of a metal electrode on a flexible substrate occurs due to crack formation, Reference Zhu, Zhang, Gao and Zhang6,Reference Lee, Kim, Kim and Joo7 and a large effort has been made to improve the stretchability of thin metal films by improving the adhesion Reference Lu, Wang, Suo and Vlassak8 or the geometry of the electrodes. Reference Ahn, Duoss, Motala, Guo, Park, Xiong, Yoon, Nuzzo, Rogers and Lewis9–Reference Kim, Song, Won, Kim, Kim, Liu, Huang, Hwang, Zhang and Rogers11 Moreover, when small strains below the fracture strain are applied in a cyclic manner, the mechanical and electrical properties are found to degrade gradually due to fatigue damage, including the formation of extrusions and intrusions and/or cracks. Reference Schwaiger, Dehm and Kraft12–Reference Sim, Hwangbo, Kim, Lee and Vlassak14 The film thickness plays an important role in both monotonic tensile and fatigue failure because the mechanical properties of thin metal films strongly depend on the film thickness, e.g., see Ref. Reference Gruber, Böhm, Onuseit, Wanner, Spolenak and Arzt15 or for review, see Ref. Reference Nix16 and Reference Kraft, Gruber, Mönig and Weygand17. It has been reported that the fracture strain under monotonic tensile increases with the increase of film thickness due to the higher ductility of thicker films. Reference Niu, Liu, Wang, Ding and Sun18,Reference Lu, Suo and Vlassak19 However, under fatigue conditions, the lifetime is generally enhanced for thinner films compared to thicker ones, Reference Sun, Wang, Zhang, Liu, Zhang and Ding13,Reference Sim, Hwangbo, Kim, Lee and Vlassak14,Reference Wang, Volkert and Kraft20,Reference Schwaiger and Kraft21 unless very high strain amplitudes are applied. Reference Sim, Lee, Lee and Vlassak22 However, these studies were carried out for different film and substrate materials and a complete understanding of the role of the film thickness of metal films on flexible substrates in their stretchability for both monotonic and cyclic loading has not yet been achieved.
In this paper, we systematically investigate the film thickness effect on the stability of metal films with various thicknesses under monotonic and cyclic loading with a wide variation in the strain range by in situ monitoring the electrical resistance of the loaded films. The tensile and fatigue behaviors as a function of film thickness are compared and discussed by correlating damage formation with stress evolution under each condition. It will be shown that for large strains, thicker films showed superior stability, for both monotonic and cyclic loading, due to their higher ductility. However, in cyclic loading with small strain amplitudes, thinner films exhibited a longer fatigue life cycle. It is argued that this effect is related to the high strength of thinner films reducing the plastic strain and, thus, suppressing damage formation. Furthermore, it will be shown that for the phenomenological description of the fatigue lifetime well-known fatigue relations, according to Coffin–Manson or Basquin, Reference Coffin23,Reference Manson24 can be applied and the corresponding fatigue coefficients were determined. The obtained values are found to deviate from the values for bulk Cu with an increasing trend with decreasing film thickness. Thus, this study provides useful guidelines for implementing stretchable and highly stable metal films as electrodes and interconnects in flexible electronic devices.
II. EXPERIMENTAL
Cu films with a thickness of 200 nm, 500 nm, and 1 μm were deposited on a 125 μm thick polyimide (PI) substrate (Dupont, Kapton, Wilmington, DE) by thermal evaporation. The base pressure was 5 × 10⁻⁶ Torr, and the deposition rate was 25 nm/min. The electrical resistance change during tensile deformation was measured using a 4-point resistance measurement system (Keithley 6220, 2182A, Solon, OH) and a microtensile tester (Kammrath & Weiss, DDS-3, Dortmund, Germany). The mechanical stress in metal films was also measured using a microtensile tester (Shimadzu, MMT-500N, Seoul, Korea) with Cu films on PI punched out into a dog-bone shape of 4 mm width and 20 mm gauge length. The film stress during deformation was derived from two tensile tests, the first on the Cu film/PI substrate structure and the second on the PI substrate only after removing the film by etching with H2SO4. The difference in the measured force from the two tests divided by the initial cross-sectional area of the film gives the engineering film stress, neglecting residual stresses. This is justified since the residual stresses were low as no curvature of the substrate has been observed after sample preparation. The strain rate of the tensile tests for both the electrical resistance and the mechanical stress measurement was 2.5 × 10⁻⁴ s−1. In situ tensile tests were conducted inside a field emission scanning electron microscope (FE-SEM, FEI NovaLab 200, Hillsboro, OR) chamber to observe damage formation during tensile deformation. The surface topology was captured at tensile strains of 0, 3, 6, 9, 12, 20, 30, and 40%.
The fatigue behavior was investigated by a repeated bending test, which has been introduced in previous papers.
Reference Kim, Cho, Jung, Shin, Moon, Han, Nam, Joo and Choi25,Reference Kim, Shin, Jung, Cho, Kraft, Choi and Joo26
Cu films on PI cut by 4 mm width and 65 mm length are curved and gripped between two plates. While the upper plate is kept stationary, the lower plate repeats a linear motion, which induces fatigue damage in the sample. The curvature of the substrate induces a tensile strain in the film. Thus, the fatigue test can be considered to have pulsating tensile stresses. The electrical resistance during cyclic bending is measured using an electrical system (Agilent 34410A, Santa Clara, CA, and Keithley 7007, Solon, OH). In this study, the maximum applied strains, equivalent to the total strain range, were calculated by
 $\varepsilon = {{\left( {h_{{\rm{sub}}} + h_{{\rm{film}}} } \right)} \mathord{\left/ {\vphantom {{\left( {h_{{\rm{sub}}} + h_{{\rm{film}}} } \right)} {2r}}} \right. \kern-\nulldelimiterspace} {2r}}$
, where ε, h
sub, h
film, and 2r are the applied strain, substrate thickness, film thickness, and gap between the plates, respectively (r is the radius of curvature), and they were varied from 0.8 to 2.0% by changing the gap between plates. The sliding distance was 10 mm, and the moving frequency was 5 Hz, and the samples were stressed up to 5 × 10⁵ cycles. The damage morphology was studied afterward by using FE-SEM and focused ion beam (FIB, FEI NovaLab 200).
III. RESULTS AND DISCUSSION
A. Monotonic tensile tests
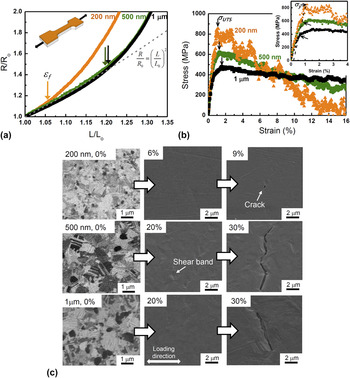
Figure 1(a) shows the normalized electrical resistance changes of the 200 nm, 500 nm, and 1 μm-thick-Cu films during monotonic tensile deformation. At the initial stage of the tensile test, the electrical resistance increases according to the theoretical curve of R/R 0 = (L/L 0)2 related to the geometry change during elongation of the samples. Reference Lu, Suo and Vlassak19 It can be seen that at certain strains the measured curves deviate from the theoretical one. We use a deviation of 2% from the theoretical values as a criterion for failure. For the 200 nm thick film a failure strain of about 6.7 ± 1.0% is found compared to 19.9 ± 1.8%, and 20.6 ± 1.6% for the 500 nm and 1 μm thick films, respectively.
(a) Normalized resistance changes of 200 nm, 500 nm, and 1 μm thick Cu films during tensile deformation. The dashed line indicates the theoretical resistance change as a function of geometry change. Reference Kim, Song, Won, Kim, Kim, Liu, Huang, Hwang, Zhang and Rogers11 Crack nucleation strains (εf) were determined by 2% deviation from the theoretical curve. (b) Stress evolution for the same Cu films during monotonic tensile deformation. The inset shows the stress at small strain. Here, the stress at 0.2% plastic strain (dashed line) was determined as a measure of the yield strength. (c) FIB images before tensile testing and in situ SEM images of the Cu films during deformation. First cracks were observed at 9, 30, and 30% strain in 200 nm, 500 nm, and 1 μm-thick-Cu films, respectively.

As shown in Fig. 1(c), the additional resistance increase can be attributed to damage and crack nucleation in the metallic thin films. The evolution of the surface topology during tensile deformation was captured by in situ SEM tensile testing. For the 200 nm thick film, the crack formed in a strain regime between 6 and 9%. For both 500 nm and 1 μm thick films, cracks started to form after straining to more than 20% but prior to 30%. These observations match well with the failure strains of the resistance measurements in Fig. 1(a). It should be noted that the crack nucleation strain of the 500 nm thick film was similar to that of the 1 μm thick film, but both were much larger than that of the 200 nm thick film, which agrees with previous reports. Reference Sim, Hwangbo, Kim, Lee and Vlassak14,Reference Niu, Liu, Wang, Ding and Sun18,Reference Lu, Suo and Vlassak19
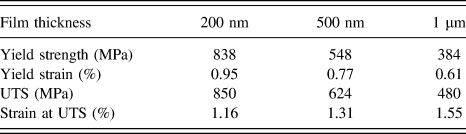
As shown in Fig. 1(b), the film stress as a function of strain, obtained from uniaxial tests, clearly exhibits a thickness dependence. The yield stress (YS) was determined using the 0.2% offset method as shown in the inset, and the ultimate tensile strength (UTS) was determined as the maximum stress. The measured material properties for all films are listed in Table I. As the film thickness decreases from 1 μm to 200 nm, both YS and UTS increase significantly by almost a factor of four, which is consistent with data in the literature. Reference Gruber, Böhm, Onuseit, Wanner, Spolenak and Arzt15,Reference Yu and Spaepen27 Besides the role of the film thickness, the increase in strength can be attributed to the smaller grain size of the thinner film [see Fig. 1(c)]. More importantly, the stress–strain behavior is clearly different for the different film thicknesses. The thickest film (1 μm) shows strain hardening behavior such that the flow stress after the onset of yielding increases from 384 to 480 MPa. Then, the flow stress decreases slightly with increasing strain. In contrast, no strain hardening is observed for the 200 nm film as the YS and UTS are almost identical, and the flow stress decreases right after yield. The 500 nm thick film shows an intermediate behavior. Consistently, the strain at UTS increases with film thickness from 1.16 to 1.55% (see Table I). However, these values are much smaller than the strain at which cracking is observed. By considering the results of Figs. 1(a)–1(c), no significant deviation of the electrical resistance from the geometrically predicted increase was observed at the early stage of tensile deformation (strains up to about 5%), while the stress–strain curves clearly indicate that plastic deformation starts at much lower strains. It can be argued that a significant increase in electrical resistance occurs only with crack formation in the film as these macroscale defects have a strong effect on electron scattering. Reference Lu, Wang, Suo and Vlassak8,Reference Lu, Suo and Vlassak19 In contrast, dislocation activities, which occur according to the stress–strain behavior at strains below 1%, affect much less the resistivity and related changes cannot be resolved in our experiment. The earlier crack nucleation of the 200 nm thick film compared to the 500 nm and 1 μm films can be also correlated with a difference in the deformation morphology. As shown in Fig. 1(c), a number of deformation bands were observed on the surface for the 500 nm and 1 μm thick films before crack nucleation, indicating significant plastic deformation. In contrast, the 200 nm thick film did not exhibit topological changes on the surface prior to crack formation, which is consistent with the more brittle behavior. Hence, our different tensile tests confirm that the failure strength increases with decreasing film thickness, but the ductility is reduced significantly as reported for other nanocrystalline metal films. Reference Gruber, Arzt and Spolenak28 As a result, as shown in Fig. 1(a), the electrical resistance remains more stable for thicker films under monotonic tensile conditions because thicker films exhibit higher crack nucleation strain and, thus, a larger stretchability.
Material properties of Cu films as measured by monotonic tensile testing.

B. Fatigue
The fatigue tests of the Cu films were carried out for strains ranging from 0.8 to 2.0%. It should be noted that with increasing strain both strain amplitude as well as the mean strain increase. The maximum strains exceed the strains related to YS and for the larger strain ranges even the ones related to the UTS (see Table I).
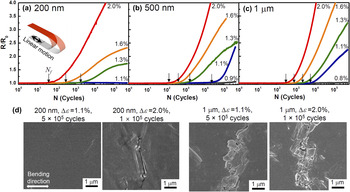
Figure 2(a) shows the normalized electrical resistance as a function of the number of cycles for the 200 nm thick Cu film for various strain ranges. For the lowest strain amplitude (1.1%), the electrical resistance did not change even at 5 × 10⁵ cycles, and no fatigue damage was observed on the film surface after the fatigue test, as shown in Fig. 2(d). When larger strain ranges were applied (1.3 and 1.6%), the resistance did not increase at an early stage, but started to increase after a certain number of cycles. Here, cracks were observed due to fatigue damage [Fig. 2(d)]. By applying an even higher strain range (2.0%), the resistance increased earlier and went up to a greater extent.
Normalized electrical resistance of (a) 200 nm, (b) 500 nm, and (c) 1 μm thick films as a function of the number of bending cycles for various strain ranges. The arrows indicate the fatigue crack nucleation cycles (N f) defined by 2% resistance increase. (d) Damage morphologies of 200 nm thick Cu films (5 × 10⁵ cycles with 1.1% and 1 × 10⁵ cycles with 2.0% strain range) and 1 μm thick Cu films (5 × 10⁵ cycles with 1.1% and 1 × 10⁵ cycles with 2.0% range).

The thicker films show in principal the same behavior but already in somewhat smaller strain ranges. For example, the cyclic deformation in a strain range of 1.1%, at which no resistance change occurred for the 200 nm thick film up to 5 × 10⁵ cycles [Fig. 2(a)], caused a resistance increase for 1 μm and 500 nm thick films after 5350 cycles [Fig. 2(c)] and 10,700 cycles [Fig. 2(b)], respectively. Also, the surface morphology around the cracks is quite different. As shown in Fig. 2(d), many extrusions are observed around cracks in the thicker films after the fatigue test while there are no or only small extrusions in the 200 nm thick film. To investigate the effects of strain amplitude and film thickness on fatigue failure systematically, we define a resistance increase of 2% as the failure criterion to determine the number of cycles to failure, N f [indicated by the arrows in Figs. 2(a)–2(c)].
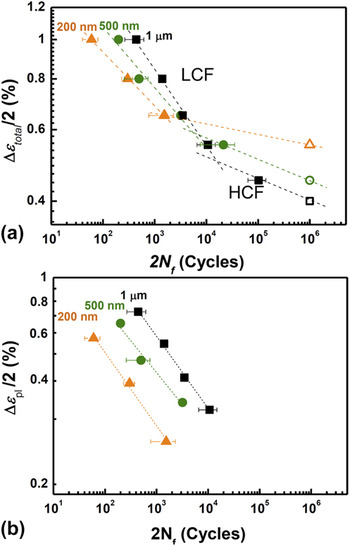
The number of cycles to failure as a function of the total strain range is plotted in Fig. 3(a) for all film thicknesses. Of course, the lifetimes decrease with increasing strain amplitude. Two regimes can be identified, which we refer to as low cycle fatigue (LCF) and high cycle fatigue (HCF), which are related to high and low strain ranges, respectively. It should be noted that for the samples tested in the low strain ranges, no resistance increase is observed until 5 × 10⁵ cycles, and no fatigue cracks are found. However, Cu as a fcc metal is known to have no endurance limit which implies that the fatigue failure is expected to occur eventually even in these small ranges. Reference Dieter29,Reference Suresh30 Due to time restrictions, the fatigue tests were stopped at 5 × 10⁵ cycles and the corresponding experiments were marked by open symbols in Fig. 3(a). For the 1 μm, 500 nm, and 200 nm thick films, the maximum strains, for which no damage occurred within 5 × 10⁵ cycles, are 0.8, 0.9, and 1.1%, respectively. Thus, as shown in Fig. 3(a), the thinner film shows a longer lifetime in the HCF regime. This is in general agreement with previous reports that the thinner the film the longer the fatigue life. It is argued that this is related to the higher strength of thinner films Reference Schwaiger, Dehm and Kraft12,Reference Sun, Wang, Zhang, Liu, Zhang and Ding13,Reference Wang, Volkert and Kraft20,Reference Schwaiger and Kraft21 or to damage annihilation at grain boundaries in fine grained films. Reference Schwaiger, Dehm and Kraft12 This argument is supported by the thickness dependent strength of the thin films studied in this work (Table I). For instance, a maximum strain of 1.1% in the fatigue test is well beyond the strain at YS for the 1 μm thick film. Thus, extensive dislocation motion is expected to occur during cyclic deformation, leading to the formation of extrusion and intrusions, as shown in Fig. 2(d), and ultimately to crack formation. In contrast, the 1.1% maximum strain is close to the elastic limit of 200 nm film. Therefore, dislocation motion is much less pronounced and apparently not enough to initiate fatigue damage within 5 × 10⁵ cycles. In summary, thinner films exhibit a superior fatigue resistance in the HCF regime because of their higher strength.
(a) Fatigue strain–life curves of 200 nm, 500 nm, and 1 μm thick Cu films using the total strain amplitude (Δεtotal/2). In case that the electrical resistance did not change until 5 × 10⁵ cycles, a lower limit for N f at 5 × 10⁵ cycles is given and marked by open symbols. Errors denote the standard deviation for at least three samples. (b) Fatigue strain–life curves using the plastic strain amplitude (Δεpl/2) which was obtained by subtracting the elastic strain from the total strain.

In contrast, in the LCF regime, the fatigue life is shorter for thinner films, as shown in Fig. 3. In this regime, fatigue failure occurs between 102 and 104 cycles. This “thinner is weaker” trend is opposite to that in the HCF regime, and has not been unambiguously reported in previous reports except for the recent work by Sim et al. Reference Sim, Lee, Lee and Vlassak22 The opposite trend of the thickness dependent fatigue failure in the LCF regime can be attributed to the strong but rather brittle behavior of the 200 nm thick film. This also relates to the change in the fatigue failure mechanism of the 200 nm film compared to the thicker films in the LCF regime. As shown in Fig. 2(d), both the 200 nm and 1 μm films formed cracks after 1 × 10⁵ cycles when a strain range of 2.0% was applied. However, the crack morphology is distinctly different. For the 1 μm thick film, the typical dislocation-induced fatigue damage was observed, i.e., large extrusions and intrusions combined with meandering cracks. On the other hand, for the 200 nm thick film cycled with 2.0% strain range, sharp straight cracks are observed with no or much smaller extrusions and intrusions. This trend can be related to an expected ductile-to-brittle transition for metallic thin films with decreasing film thickness. Reference Gruber, Arzt and Spolenak28 The change of the fatigue failure mode was also reported from the dislocation-mediated extrusion and subsequent crack formation to rather brittle crack propagation. Reference Wang, Volkert and Kraft20,Reference Zhang, Volkert, Schwaiger, Wellner, Arzt and Kraft31 As discussed in Sec. III. A, the monotonic tensile tests [Figs. 1(a) and 1(b)] clearly showed the stronger but brittle behavior of the 200 nm thick film compared to the thicker films. Thus, it is argued that, at a given strain in the strain-controlled fatigue test, a higher stress occurs in the thinner film since plastic deformation by dislocation activity is reduced significantly. The higher stress in thinner films favors crack formation and intergranular crack propagation instead of intragranular failure. Reference Lu, Suo and Vlassak19,Reference Gruber, Arzt and Spolenak28 Furthermore, for the strong 200 nm films, the excess strain energy cannot be dissipated by plastic deformation and thus fracture processes are favored. This argument is in agreement with studies on thin film adhesion which have shown that thinner films are more prone to delamination since less energy can be dissipated at the tip of the interface crack. Reference Dauskardt, Lane, Ma and Krishna32 In conclusion, thinner films are more vulnerable for fatigue damage when the strain is large enough that local damage sites are created from which cracks can nucleate and propagate.
C. Fatigue coefficients
To describe the thickness dependent fatigue life cycle in a quantitative manner, we analyze the number of cycles to failure, N f, in Fig. 3 by applying the Coffin–Manson and Basquin relationships. Reference Coffin23,Reference Manson24,Reference Suresh30
 $${{\Delta {\varepsilon _{{\rm{total}}}}} \mathord{\left/ {\vphantom {{\Delta {\varepsilon _{{\rm{total}}}}} 2}} \right. \kern-\nulldelimiterspace} 2} = {{\Delta {\varepsilon _{{\rm{el}}}}} \mathord{\left/ {\vphantom {{\Delta {\varepsilon _{{\rm{el}}}}} 2}} \right. \kern-\nulldelimiterspace} 2} + {{\Delta {\varepsilon _{{\rm{pl}}}}} \mathord{\left/ {\vphantom {{\Delta {\varepsilon _{{\rm{pl}}}}} 2}} \right. \kern-\nulldelimiterspace} 2} =\; {{\sigma _{\rm{f}}^\prime } \mathord{\left/ {\vphantom {{\sigma _{\rm{f}}^\prime } E}} \right. \kern-\nulldelimiterspace} E}{\left( {2{N_{\rm{f}}}} \right)^{ - b}} + \varepsilon _{\rm{f}}^\prime {\left( {2{N_{\rm{f}}}} \right)^{ - c}}\quad {\rm{.}}$$
Although the equation was originally formulated for the fatigue life pertinent to fracture of the bulk specimen, it was found that the relationship is also valid for the number of cycles to crack initiation in thin films. Reference Cooper and Fine33–Reference Laird and Krause35 Hence, we extracted the fatigue parameters of the Coffin–Manson equation from the total strain versus N f or from the plastic strain versus N f as shown in Figs. 3(a) and (b), respectively. Since the plastic strain is dominant in the LCF regime, the strain–life curve can be commonly described by using the strain range, Δεtotal, as shown in Fig. 3(a):
 $${{\Delta {\varepsilon _{{\rm{total}}}}} \mathord{\left/ {\vphantom {{\Delta {\varepsilon _{{\rm{total}}}}} 2}} \right. \kern-\nulldelimiterspace} 2} \approx {{\Delta {\varepsilon _{{\rm{pl}}}}} \mathord{\left/ {\vphantom {{\Delta {\varepsilon _{{\rm{pl}}}}} 2}} \right. \kern-\nulldelimiterspace} 2} = \varepsilon _{\rm{f}}^\prime {\left( {2{N_{\rm{f}}}} \right)^{ - c}}\quad {\rm{,}}$$
where Δεpl/2 is the plastic strain amplitude, εf ′ is the fatigue ductility coefficient, and c is the fatigue ductility exponent. In Fig. 3(b), the fatigue lifetimes are plotted versus the plastic strain amplitudes, Δεpl/2. These are estimated by subtracting the yield strain, obtained from the monotonic tensile test in Fig. 1(b) and Table I, from the total strain amplitude. In the log–log plots of the total and the plastic strain amplitudes versus fatigue lifetime as shown in Figs. 3(a) and 3(b), respectively, the strain amplitude at 2N f = 1 gives obviously the fatigue ductility coefficient and the slope provides the fatigue ductility exponent.
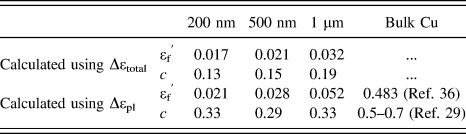
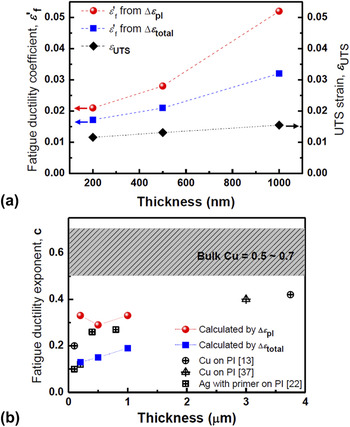
The fatigue ductility coefficient, εf ′, and the fatigue ductility exponent, c, as a function of film thickness are listed in Table II, and plotted in Figs. 4(a) and 4(b). With increasing film thickness, the fatigue ductility coefficients calculated for the total strain and for the plastic strain increased from 0.017 to 0.032 and from 0.021 to 0.052, respectively. These ductility coefficients are an order of magnitude smaller than 0.483 for bulk Cu. Reference McDowell36 As shown in Fig. 4(a), the value of the fatigue ductility coefficient is in a similar range to the strain at UTS (∼0.015) obtained from the monotonic tensile tests. Furthermore, the thickness dependence of the fatigue ductility coefficient is consistent with that of the UTS strain. Both increase with increasing film thickness (see also Figs. 1(a) and 1(b)).
Fatigue ductility coefficient (εf ′) and fatigue ductility exponent (c) obtained from the Coffin–Manson relationship. The values were calculated by the total strain range and the plastic strain range by subtracting the elastic strain from the total strain range.

(a) Fatigue ductility coefficients, εf ′, calculated using the total strain range and the plastic strain range in the bending fatigue tests, and UTS strains obtained from monotonic tensile tests as a function of film thickness. (b) Fatigue ductility exponents, c, calculated using the total strain range and plastic strain range, and the reported values for thin films and bulk materials from the literature. Reference Sun, Wang, Zhang, Liu, Zhang and Ding13,Reference Sim, Lee, Lee and Vlassak22,Reference Kraft, Schwaiger and Wellner37

Figure 4(b) shows the fatigue ductility exponent as a function of film thickness. With the increase of the film thickness from 200 nm to 1 μm, the fatigue ductility exponents obtained from the total strains increased from 0.13 to 0.19. These values are in the same range of 0.1–0.4 reported for thin films, Reference Sun, Wang, Zhang, Liu, Zhang and Ding13,Reference Sim, Lee, Lee and Vlassak22,Reference Kraft, Schwaiger and Wellner37 but smaller than 0.5 to 0.7 for bulk Cu. Reference Dieter29 When we plot the fatigue ductility exponents determined by the total strain with values from the literature [Fig. 4(b)], the increasing trend with respect to film thickness is clearly seen, and it can be extrapolated that films with a thickness of 10 µm or so will reach the value of the bulk material.
Furthermore, the fatigue ductility exponents were calculated using the plastic strain amplitude as plotted in Fig. 4(b). The values are larger than those from the total strain and are independent of the film thickness (Table II). This change of fatigue ductility exponents can be attributed to the different portions of elastic and plastic strain for different film thicknesses in a given strain range. As the film thickness increases, the portion of the plastic regime increases due to the low strength of the thicker film (see Table I).
D. Implication of the thickness dependence for flexible electrodes
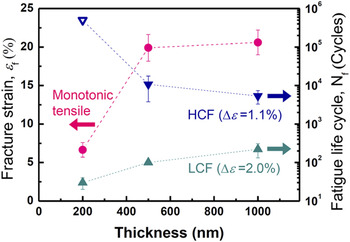
Understanding the thickness dependent fracture and fatigue damage is very important to design flexible electronic devices. As shown in Fig. 5, the fatigue crack nucleation cycles for the 1.1 and 2.0% strain range as a function of film thickness were plotted together with the crack nucleation strain during monotonic tensile tests. The crack nucleation strain (εf), which can be used as an indicator of the stretchability of the film, increases with increasing film thickness. This thickness dependence is similar to the one for crack nucleation during fatigue testing when high strain amplitudes are applied (LCF regime, Δε = 2.0%). Hence, thicker films exhibit better mechanical reliability under large strain conditions, e.g., during fabrication in a roll-to-roll process and/or in applications when a few cycles with large strain are applied. On the other hand, the fatigue life in the low strain regime (HCF regime, Δε = 1.1%) shows the opposite thickness dependence. Here, the thinner film shows longer fatigue life due to higher strength of the thinner films. Therefore, for the long-term applications with many cycles at fairly small strain amplitudes, the use of thinner films would be more appropriate.
Crack nucleation strain (εf) in monotonic tensile and fatigue life time, N f for the 1.1 and 2.0% cyclic strain range as a function of film thickness.

IV. CONCLUSION
The deformation and fatigue behavior of Cu films with thickness between 200 nm and 1 µm for different strain ranges were investigated using in situ monitoring of electrical resistance. It is found that for monotonic tensile deformation, the thicker films have a larger stretchability concurring with higher fatigue resistance for large strain ranges. On the other hand, in fatigue tests with low strain amplitudes, the thinner films show better fatigue resistance because of their higher strength. For large strain ranges, the fatigue ductility coefficient and the fatigue ductility exponent were measured for the different film thicknesses, and compared to bulk values. It is found that the fatigue ductility exponent decreases with decreasing film thickness indicating that thinner films are apparently less sensitive to fatigue effects. However, the fatigue ductility exponent is more or less independent of film thickness. This study provides useful information to adapt the stretchability and stability of metal thin films for applications as electrodes in flexible electronics. It is shown that the design of highly stable flexible electrodes needs to consider the described opposing thickness effects with respect to the stress/strain conditions during fabrication and service.
ACKNOWLEDGMENTS
This work was supported by the Global Leading Technology Program of the Office of Strategic R&D Planning (OSP) funded by the Korean government (Ministry of Trade, Industry and Energy) (No. 10042537). IS is supported by KIST Research Funding (2E24692). B. J. Kim also acknowledges support of the KIT guest program for his stay at the Institute for Applied Materials. The work was also supported by the Helmholtz Virtual Institute VI-530.