Introduction
Social protection policies for old age have undergone a significant shift in Latin America. During the last years, 12 countries of this regionFootnote 1 have implemented non-contributory pension schemes which, in general, offer a small benefit to elderly individuals who are not entitled to receive any other pension and live in poverty. The amount of the benefit, coverage (targeted or universal) and access requisites vary widely in the region, but given the popularity and inherent long-term fiscal commitment of these programmes, it can be said that this is a major change in the strategy to deal with social protection and poverty in old age. Although the structural pension reform of the 1990s and 2000s helped to make contributory pension systems more financially sustainable across Latin America, pension coverage rates remained low, with acute differences between rural and urban areas and among income groups (Rofman and Oliveri Reference Rofman and Oliveri2011).
An important issue, raised by governments and international support institutions (such as the World Bank and the Inter-American Development Bank) with respect to these programmes, is the assessment of the impacts on different outcomes related to the wellbeing of the recipients. Particular attention has been paid to variables such as labour supply, retirement decisions, saving behaviour and health. Such empirical attention has yielded mixed results. For example, it has been found that non-contributory pensions do not reduce the labour supply of old individuals in Mexico, but the reduction is very large in Brazil (Olivera and Zuluaga Reference Olivera and Zuluaga2014). However, there is a lack of studies that focus on a summary indicator of different dimensions of old age wellbeing. In this respect, a concept used widely in the ageing literature, Successful Ageing (SA), can help to understand more fully the effects of non-contributory pensions on multi-dimensional wellbeing. As the implementation of the concept of SA has proved to be rather rigid (estimating the share of individuals with SA versus usual ageing), the present study will enrich this approach by incorporating the counting method for multi-dimensional poverty developed in the economic literature.
As some of the non-contributory pension programmes have started to produce information to measure the impact on the recipients, this study profits from its access to a unique data-set carried out for that specific purpose (Encuesta de Salud y Bienestar del Adulto Mayor (ESBAM)). This survey is the baseline of Peru's Pension 65 programme collected by the National Institute of Statistics (INEI) in December 2012 and comprises 4,151 elderly individuals living in poverty in half of Peru's regions. At the time of the survey, about 250,000 individuals were already enrolled in Pension 65, representing 16 per cent of the 65+ population.
Although research on ageing was long influenced by the view of a linear deterioration in age and focused on losses, the introduction of the SA concept in Rowe and Kahn's (Reference Rowe and Kahn1987) seminal article has contributed to a more positive view of this developmental period. Indeed, the age-related changes in physiological, physical and cognitive functions, though considered a part of normal ageing, showed a wide range of individual variation and could be modified by some environmental factors. In this context, the idea behind the concept of SA is to distinguish why some individuals experience their course of ageing better than others and which factors should be improved to increase the number of people with SA. Moreover, as SA summarises different important dimensions for elderly individuals, this concept is also useful to account for the overall quality of life of the elderly population. This is particularly relevant because persons with SA have better capacities of adaptation and adjustment to age and daily life changes (de Moraes and de Azevedo e Souza Reference de Moraes and de Azevedo e Souza2005).
It has long been a topic of debate about what exactly the definitions of SA and usual ageing are and how they should be measured. This is not an easy task due to the multi-dimensionality of the concept and the heterogeneity in age and cultural background among elderly adults (Cosco et al. Reference Cosco, Prina, Perales, Blossom and Brayne2014). In the first place, SA refers to the avoidance of disease, maintenance of physical and cognitive functioning, and engagement in an active lifestyle (Rowe and Kahn Reference Rowe and Kahn1997). Moreover, a proposal has been made to include indicators of subjective wellbeing in the measure of SA and rely less on biomedical and physical functioning aspects (Ng et al. Reference Ng, Broekman, Niti, Gwee and Kua2009; Zelikova Reference Zelikova2013). Interestingly, in a sample of ten Latin American and European countries, health, independence, social relationships and life satisfaction are the components most frequently and consistently cited by elderly individuals on what is important for ‘ageing well’ (Fernandez-Ballesteros et al. Reference Fernandez-Ballesteros, Garcia, Abarca, Blanc, Efklides, Moraitou, Kornfeld, Lerma, Mendoza-Numez, Mendoza-Ruvalcaba, Orosa, Paul and Patricia2010). On a similar note, Hung, Kempen and de Vries (Reference Hung, Kempen and de Vries2010) performed a meta-analysis of the literature on healthy ageing and related concepts (including SA) and detected that, in general, lay definitions of SA include more domains (independence, family, adaptation, financial security, personal growth and spirituality) and diversity than those provided and analysed by the academic researcher.
In general, socio-economic, physical and psychological variables have been observed as regularly influencing SA. The review by Depp and Jeste (Reference Depp and Jeste2006) revealed that the most significant variables, and the ones positively correlated with SA, are younger age; non-smoking; absence of disability, arthritis and diabetes; greater physical activity; more social contacts; better self-rated health; absence of depression and cognitive impairments; and fewer medical conditions. The large majority of evidence on SA is focused on industrialised countries and mostly in specific populations of elderly individuals. Less is known about SA in developing countries and populations of elderly and poor individuals.
In the case of Latin America, there is evidence that adults are reaching old age with more chronic diseases and physical disabilities than adults in more developed countries (Alvarado et al. Reference Alvarado, Zunzunegui, Beland and Bamvita2008; Avila-Funes et al. Reference Avila-Funes, Amieva, Barberger-Gateau, Le, Raoux, Ritchie, Carrière, Tavernier, Tzourio, Gutiérrez-Robledo and Dartigues2009; Runzer-Colmenares et al. Reference Runzer-Colmenares, Samper-Ternent, Al Snih, Ottenbacher, Parodi and Wong2014). Associated with SA in Brazil, Chaves et al. (Reference Chaves, Camozzato, Eizirik and Kaye2009) and de Moraes and de Azevedo e Souza (Reference de Moraes and de Azevedo e Souza2005) report family relations and friendship, health and perceived wellbeing, functional capacity and psycho-social support, and family income. Regarding the analysis of SA among the poor, there is a lack of studies that focus on this specific population. As an exception, Chung and Park (Reference Chung and Park2008) report, for a sample of low-income South Koreans, that material or social success are less important in determining SA. The authors found that SA is positively associated with: (a) a positive attitude towards life, (b) the success of adult children, and (c) relationships with others.
The vast majority of studies assessing SA present the estimated share of individuals ageing with success in opposition to those individuals who experience usual ageing. Nonetheless, it is difficult to compare studies, not only because of different sample selections and designs, but also because of the use of different indicators of SA and thresholds indicating the dichotomy between SA and usual ageing. According to the review by Depp and Jeste (Reference Depp and Jeste2006), the average share of individuals belonging to the SA group is approximately one-third. Given the multi-dimensionality of SA, it is rather arbitrary to select a particular threshold to determine who is experiencing SA or usual ageing. Hence, it is preferable to take a more flexible approach. Recent developments in economics in accounting for multi-dimensional poverty and wellbeing (see e.g. Alkire and Foster Reference Alkire and Foster2011) seem to provide an adequate base on which to build a more flexible measure of multi-dimensional SA, without losing the variability in the different degrees of ageing quality experienced by the individuals.
Dating back to the works by Sen (Reference Sen1985, Reference Sen, Nussbaum and Sen1993), the concept of poverty, as inherently multi-dimensional and encompassing dimensions beyond income, has gained prominence in social research. As pointed out by Bourguignon and Chakravarty (Reference Bourguignon and Chakravarty2003), it has extended the use of a threshold of subsistence income or consumption (poverty line) to determine who is and who is not poor. An individual is considered poor if his or her income falls below the poverty line, and therefore, the poverty rate in the country is the share of individuals classified as poor. However, the problem with this approach is that poverty (or deprivation of wellbeing) also depends on attributes that are non-monetary and that cannot be purchased in the market (e.g. health, literacy, self-esteem, food security, etc.). This is why multi-dimensional measurement is needed. Some key developments in theoretical and methodological ways to deal with the estimation of multi-dimensional poverty in a counting approach are discussed in Atkinson (Reference Atkinson2003) and Alkire and Foster (Reference Alkire and Foster2011). When following the counting approach, one first looks at each relevant dimension and assesses whether the individual is deprived of such dimensions according to specific deprivation cut-offs. A failure is assigned the value of one, otherwise a zero is assigned. Once all dimensions are transformed into zero or one, they are summed up to detect the number of dimensions in which the individuals are deprived. The result is a continuum of values for each individual, where the minimum value is zero and the maximum is the total number of dimensions considered in the analysis. According to the union approach of the poverty counting method, individuals are considered to be poor if they are deprived in at least one dimension. But according to the intersection approach, individuals are considered poor if they are deprived in every dimension. A third approach indicates that a person is poor if the number of experienced deprivations exceeds a second and overall cut-off located between the union and intersection approaches.
The comparability between the multi-dimensional poverty counting approach and SA is evident. First, both concepts are fundamentally multi-dimensional. Second, SA rates success instead of deprivation, so that one might consider achievements (success) in each dimension instead of deprivations, and consequently assign a value of one if the value in the dimension exceeds the achievement cut-off, or assign a zero if otherwise. Third, in the current state of the SA empirical literature, an individual is considered to be ageing successfully if he or she rates successfully in each dimension under analysis, which is equivalent to the above-mentioned intersection approach.
The objective of this study is to account for the number of relevant dimensions in which the individual is successful. To do this, we report and use the complete distribution of successful indicators to assess the determinants in the numbers of achievements. This way of analysing SA allows us to move beyond the dichotomy of SA–usual ageing entrenched in the SA literature, and take full advantage of the observed variation in success.
Data and methodology
Data
The data were drawn from ESBAM, which is a unique survey conducted by Peru's INEI in December 2012 in 12 administrative regionsFootnote 2 (half of the total number in Peru). This survey includes a detailed questionnaire for persons aged 65–80 years on socio-economic conditions, subjective wellbeing, expectations, beliefs, and several self-reported subjective and objective health measures, anthropometrical measures (circumference of the waist, calf and arm, as well as armspan and weight), blood sampling and arterial blood pressure. This is an extraordinary opportunity to enhance our knowledge on the quality of ageing in a population of poor and elderly adults. Consequentially, these data and the implemented analysis can shed light on how to help the poor and elderly to age even better. Furthermore, ESBAM contains socio-economic questions at the household level and for each household member. Detailed questions on expenses and income were also recorded. General information was collected in face-to-face interviews, while data on anthropological measures, arterial blood pressure and blood samples were collected by medical technicians. The goal of this data-set is to establish the baseline for the evaluation of Pension 65, which is a recently implemented non-contributory pension programme administrated by the Ministry of Development and Social Inclusion of Peru (MIDIS). The cash transfers of this programme are targeted to individuals aged 65+ who do not receive a contributory pension and live in extreme poverty.
The population in ESBAM comprised individuals aged between 65 and 80 years who lived in particular households classified as poor by the national targeting score system SISFOH. Under this system, each household receives a score computed with variables such as material conditions, assets, incomes, education level, household size and occupation. Then, according to some thresholds in the score, the government classifies each household as extreme poor, non-extreme poor or non-poor, with the goal of targeting the recipients of social assistance. The sampling selection was probabilistic, independent in each region, stratified in rural/urban areas and carried out in two steps (first selecting census units or villages and then households). After excluding 65 individuals who were assisted by a proxy in answering the questionnaire (mostly persons with severe impairments such as blindness and deafness), the sample comprised 4,151 individuals. This number slightly decreases because of missing values in some variables of interest. No major limitations were found while collecting the data. Indeed, 3,083 out of 3,200 targeted households were successfully interviewed, which represented a success rate of 96.4 per cent.
Distinguishing SA and usual ageing
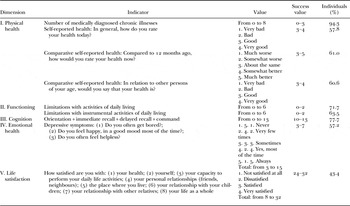
Similar to other empirical studies on SA (Chaves et al. Reference Chaves, Camozzato, Eizirik and Kaye2009; Hodge et al. Reference Hodge, English, Giles and Flicker2013; Ng et al. Reference Ng, Broekman, Niti, Gwee and Kua2009), several indicators – grouped in five dimensions – were used to assess SA among the poor and elderly Peruvians. The dimensions and their corresponding indicators were: (a) good health (low number of illnesses, good self-rated health), (b) efficient daily living functioning (good activities of daily living and instrumental activities of daily living measures), (c) efficient cognitive functioning (high scores on the cognitive measure adapted from the Mini Mental State ExaminationFootnote 3 ), (d) good emotional health (lower depressive symptoms), and (e) high life satisfaction (in eight different domains). These dimensions were chosen because they include the aspects mentioned by Rowe and Kahn (Reference Rowe and Kahn1997) as well as indicators of subjective wellbeing (i.e. good emotional health and life satisfaction) as has been recommended by several authors (e.g. Cosco et al. Reference Cosco, Prina, Perales, Blossom and Brayne2014). More details of each indicator and their specific thresholds are reported in Table 1.
Dimensions and indicators of Successful Ageing

Source: Encuesta de Salud y Bienestar del Adulto Mayor database, authors' elaboration.
Determinants of SA
The variables used in the present study as potential mediators of SA are also commonly employed in other related studies, although the richness of variables investigated in ESBAM allowed ageing quality to be studied more comprehensively than in other studies. These variables were classified in three categories: socio-demographic, physical and psychological variables. The socio-demographic category included 12 variables: gender (1 = male, 0 = female), age, marital status (1 = married or living with partner, 0 = other), education (1 = illiterate, 0 = literate), working status (1 = working, 0 = retired or unemployed), pensioner condition (1 = receiving a pension, 0 = not receiving a pension), health insurance (1 = has health insurance, 0 = no health insurance), total annual household income (expressed in monthly Nuevos Soles, the monetary unit of Peru), household size, ethnicity (1 = indigenous mother tongue, 0 = other), area of living (1 = urban, 0 = rural) and food insecurity index. It must be noted that food insecurity, measured at the household level, can be an important source of stress for the household and can ultimately lead to starvation. In this respect, ESBAM closely follows the Household Food Insecurity Access Scale developed by Coates, Swindale and Bilinsky (Reference Coates, Swindale and Bilinsky2007). The index consists of nine items referring to various difficulties encountered in accessing food, and each item is rated on a four-point intensity scale (4 = always, 3 = often, 2 = sometimes, 1 = rarely, 0 = none). Hence, the best (no food insecurity) and worst (maximum food insecurity) possible outcomes of food insecurity are 0 and 36, respectively.
The physical variables category included ten items. A dummy variable was used to indicate the presence of anaemia in the individual according to the haemoglobin level of the blood sample that was extracted during the interview and compared to the World Health Organization's thresholds by gender. The Mini Nutritional Assessment (MNA) score was also used to assess the conditions of malnutrition. This instrument is commonly used in samples of older individuals and reveals a good ability to identify frail and elderly individuals at risk of undernutrition and malnutrition (Harris and Haboubi Reference Harris and Haboubi2005). It is composed of items related to diet quality, mobility, disease history and anthropometrical measures. Importantly, the MNA has also been used in the Survey on Health and Well-being of Elders, a large-scale study implemented during the early 2000s in seven capital cities of Latin America and the Caribbean (Albala et al. Reference Albala, Lebrão, León Díaz, Ham-Chande, Hennis and Palloni2005). The original MNA reports a score from 0 to 30 and allows for the categorisation of individuals who are malnourished (<17), at risk of malnutrition (17–23.5) or enjoy normal nutritional status (>24). For comparability reasons with the original version, it was only possible to compute a MNA score ranging from 0 to 22, thus it is preferable to use the MNA in a continuous form. A dummy variable indicating abnormal blood pressure was also computed according to World Health Organization norms. Blood pressure was measured for each participant by medical technicians. Five dummy variables indicating whether the individual reported any type of physical disability (sight, hearing, speech, body extremities and others) were also assessed. Finally, two dummy variables were computed to indicate either past or present smoking behaviour and present habitual alcohol consumption.
The psychological variables category included items to assess: empowerment, self-esteem, cognitive-related disabilities and social support network size. As old age reduces individual autonomy and increases dependence on other household members or relatives, empowerment can contribute positively to the wellbeing of elderly people. The reason is that empowerment implies more bargaining power in pursuing one's own desires in regard to resources and decisions. The questions related to empowerment in ESBAM are: ‘Do you consider that your relatives treat you with respect?’ and ‘Do you consider that your relatives respect your opinions and interests?’ Answers were provided on scales with the options: 5 = Yes, always, 4 = Yes, most of the time, 3 = Sometimes, 2 = Seldom, 1 = Never. The score of empowerment was computed by summing up the answered scales, so that the lowest and highest scores were 1 and 10. Self-esteem was measured with the question ‘Do you see yourself as a valuable person?’ (5 = Yes, always, 4 = Yes, most of the time, 3 = Sometimes, 2 = Seldom, 1 = Never). As demonstrated in Robins, Hendin and Trzesniewski (Reference Robins, Hendin and Trzesniewski2001), this single item has a strong correlation with the ten-item Rosenberg Self-esteem Scale. For cognitive disabilities, a dummy variable was employed to indicate the presence of any cognitive-related disability. As in the case of physical disabilities, this variable was also self-reported. Regarding the size of the social support network, the respondents had to list the names of the main persons with whom they give or receive advice, companionship, care, information, food, money, etc. These persons can be relatives, friends, neighbours, religious groups, etc. Moreover, the respondents were also asked how much trust they feel with each of the listed persons, with the response options: 1 = much, 2 = fair, 3 = little, 4 = nothing. The variable for network size was computed as the number of reported persons with whom the individual feels much trust, i.e. their intimate, inner and trustworthy network. This measure of inner social support network is relevant for elderly people because of their greater frailty and dependence on other persons. Finally, the frequency of contact with the support network was measured in days per year.
Method
Unlike previous approaches aimed at distinguishing the group of individuals ageing successfully from the group of individuals with usual ageing, this study investigated specifically what factors were associated with performing better in a larger number of successful indicators, without imposing any threshold for determining who presents SA versus usual ageing. The goal was to move beyond the common dichotomy of SA and usual ageing, and take advantage of the full distribution of success along the set of available indicators. The reduced form equation, estimated with linear regression models (ordinary least squares (OLS)), was the following:
 $${y_i} = count\left( {{I_{\,ji}} \ge {{\bar I}_j}} \right)\; {\rm for}\; j = 1, \ldots 9.$$
 $${y_i} = \alpha + {\beta _k}{X_{ki}} + {\mu_i}.$$
The subscript j represents a given indicator (j = 1,…9) of SA, the subscript i indicates a particular individual from the sample and the subscript k stands for the determinants of SA. The variable
 ${\bar I_j}$
represents thresholds of success for each indicator j (values defined in Table 1). In this setting, the dependent variable Y
i
is equivalent to the total number of indicators in which an individual was successful (Equation 1).Footnote
4
Equation 2 is the model to estimate, which includes a vector of X
k
different determinants of SA and an normally distributed error term μ
i
. This strategy allowed the arbitrariness of conforming two exclusive groups (SA and usual ageing individuals) to be overcome. Other studies on SA have routinely employed that strategy and hence have removed almost all variation contained in the SA indicators. It could very well be the case that within the groups of SA and usual ageing adults, there are individuals with very dissimilar patterns of ageing. Furthermore, some indicators could be strongly correlated, so that the approach employed in this study seems more flexible to reduce measurement errors in the computation of the quality of ageing.
The main interest of the present study was to uncover the effects of relevant variables in the favouring or limiting of SA in a number of indicators. As discussed above, these indicators are part of dimensions considered to be important in measuring the quality of ageing of elderly individuals. However, it is also important to look at each indicator and its determinants to understand better the conditions enhancing a good performance on the indicator. In this way, public policies oriented towards improving the living conditions of the old-age population can be focused on certain indicators that are more likely to be affected by these policies. Therefore, a further section of analysis will investigate the main determinants for each indicator of SA. As each indicator I
ji
is a dummy variable taking the value of one if the indicator value reaches at least the threshold (
 ${I_{ji}} \ge {\bar I_j}$
), or zero otherwise, each indicator can be analysed with linear probability model (LPM) regressions. In this case, the interest is in the average effects of the determinants on each indicator. The reduced equation used to estimate for each indicator j is the following:
 $${I_{\,ji}} = \delta + {\beta _k}{X_{ki}} + {\varepsilon _i}.$$
The independent variables entering into the regressions are in standardised values (mean = 0 and standard deviation = 1) with the exception of the dummy variables. Furthermore, the regressions use robust standard errors.
Results
Distribution of SA
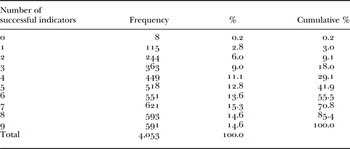
The distribution of population by successful indicators, shown in Table 2, revealed that 14.6 per cent of the individuals analysed in the sample are successful in all nine indicators. In the standard approach employed in the SA literature, the researcher would interpret this figure as the proportion of individuals with SA while the proportion with usual ageing would be 85.4 per cent. However, in our counting approach we do not simply intend to establish these two groups. Instead, we look at the variance in the contribution of each indicator (see Table 2). For example, 18 per cent of the sample satisfied a maximum of three indicators with success, and 29.2 per cent satisfied eight or nine indicators.
Distribution of population by successful dimensions

Source: Encuesta de Salud y Bienestar del Adulto Mayor database, authors' elaboration.
Determinants of multi-dimensional SA
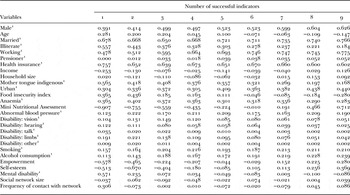
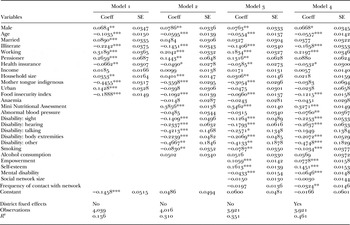
First, the standardised means of the variables employed in the analysis are shown in Table 3, while the results of the determinants of SA (Equation 2) are reported in Table 4.
Standardised means by successful indicators

Note: 1. Dummy variables are not standardised.
Ordinary least squares estimates for Successful Ageing

Notes: Coeff: coefficient. SE: robust standard error. The dependent variable is the number of successful indicators (from 0 to 9). The regressors are in standardised values, with the exception of dummy variables.
Significance levels: * p < 0.10, ** p < 0.05, *** p < 0.01.
The groups of variables were introduced one by one in the first three columns of Table 4, with Model 1 composed of only 12 socio-demographic variables. Model 2 included ten additional variables related to physical health and Model 3 added a further five psychological health-related variables. The final model (Model 4) included dummies for each district of the respondent (fixed effects). The goal of this last specification was to capture unobservable characteristics at the local level, such as labour market conditions, community deprivation of health and basic services, healthy environments, etc.
Looking first at Models 1–3 (see Table 4), it is clear that being male and younger was associated with more successful indicators. Having any of the variables signalling better socio-economic position contributed to having more successful indicators. In particular, this was the case for being literate, speaking the Spanish mother tongue, working and receiving pensions. Surprisingly, having any type of health insurance was negatively associated with the number of successful indicators. In contrast, the food insecurity index was negatively and significantly associated with the number of successful indicators, meaning that the more starved and stressed for food provision the individuals were, the lower their SA was.
Regarding the physical health-related variables added into Model 2, anaemia was not significant but the MNA score was significant in explaining a larger number of successful indicators. Interestingly, once MNA was removed from each model specification, anaemia was significant and positive in every model, meaning that MNA score and anaemia are highly correlated. Regarding the effects of permanent disabilities, all physical disabilities were statistically significant and negatively associated with SA. Finally, of the two risk behaviours considered, only smoking was statistically significant and negatively related to SA whereas no effect was observed for alcohol consumption.
Concerning the psychological variables introduced in Model 3, empowerment and self-esteem were positively and significantly associated with a larger number of successful indicators. Moreover, having a mental disability was negatively associated with SA. Neither of the two variables related to social support were statistically significant, although the frequency of contact with the social network became significant and, quite surprisingly, negative once the size of the social network was removed.
Model 4 was more demanding because it included fixed effects for districts as a way to control for unobservable characteristics at the community level. Therefore, some estimators previously found to be statistically significant lost their significance. This was the case for being a pensioner, income, indigenous mother tongue and living in urban areas. In this model, having abnormal blood pressure and frequent contact with the social support network are statistically significant and negatively associated to SA indicators.
In sum, the socio-economic determinants passing the most demanding model specification (Model 4) and being positively associated with the number of successful indicators were: being male, younger, more educated, working, having no health insurance registration and reporting less food insecurity. The physical health-related variables positively affecting SA were good nutritional status (high MNA scores), normal blood pressure, lack of physical disabilities and non-smoker. Finally, SA was positively associated with high empowerment, self-esteem, being free of any mental disability and having less frequent contact with the social support network.
Determinants of individual dimensions of SA
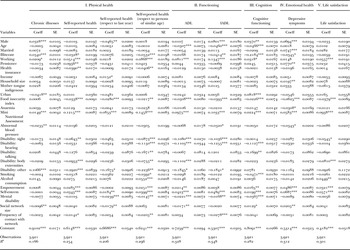
The LPM regressions corresponding to each indicator of SA (Equation 3) are reported in Table 5. The model specification for each regression includes all determinants previously considered and district fixed effects. Recall that in the LPM, the dependent variable takes the value of 0 or 1, while in the OLS estimates, the dependent variable is the number of successful indicators and ranges from 0 to 9; therefore, the magnitude of the OLS coefficients will be larger than the LPM coefficients. It is notable that the MNA score is statistically significant and positively associated with every indicator. A similar performance was observed for the food insecurity index and self-esteem: both were statistically significant in all indicators with the exception of chronic illnesses. Food insecurity was negatively related to each indicator, which is a very important finding for public policy because it reveals the key role of nutrition and food intake security in the wellbeing of the poor and elderly population. Furthermore, self-esteem is positively related to all indicators, a finding which should be taken into consideration by public interventions geared towards the improvement of the quality of ageing. Other important variables with a large number of statistically significant results are working (with seven), empowerment and other disability (both with six), and male, sight disability, social network size and mental disability (each with five).
Linear probability model estimates for each indicator of Successful Ageing

Notes: Coeff: coefficient. SE: robust standard error. ADL: activities of daily living. IADL: instrumental activities of daily living. Includes district fixed effects. The dependent variable is a dummy indicating success in the indicator. The regressors are in standarised values, with the exception of dummy variables.
Significance levels: * p < 0.10, ** p < 0.05, *** p < 0.01.
Discussion
The main goals of the present study were to offer an overview of the patterns of ageing in a large sample of elderly Peruvian individuals living in poverty and to provide insights about which variables influence the quality of ageing in this population. The analysed data are drawn from the ESBAM survey implemented in December 2012 by Peru's INEI and MIDIS, which is the baseline of the governmental non-contributory pension programme Pension 65.
The quality of ageing was rated according to nine indicators associated with the dimensions of physical health, daily life functioning, cognition, emotional health and life satisfaction. Although the proportion of older Peruvian adults who were reported as satisfying all these indicators was only 14.6 per cent, there is a sizeable heterogeneity along the distribution of success for each indicator. Consequently, the present analyses take advantage of the complete distribution of success along the set of available indicators without imposing any specific threshold to distinguish SA from usual ageing. In this way it differs from previous research that mostly focused on the dichotomy of SA versus usual ageing. The interest was on assessing what factors were associated with performing better in a larger number of successful indicators. In particular, the empirical strategy consisted of regressing a comprehensive set of determinants of SA on the total number of indicators that an individual achieves with success.
Among the socio-economic variables, it was found that working, education, lower food insecurity, male, younger and lack of health insurance registration were positively linked to the number of successful indicators. Some associations, such as gender or age, have been reported in other studies (see e.g. Depp and Jeste Reference Depp and Jeste2006; Hsu Reference Hsu2005), whereas others are rather novel or surprising. It should be noted that the preferred model specification is the one controlled by fixed effects of the districts where the respondents live. The reason is that this model is more demanding because it controls for unobservable characteristics at the community level and, hence, removes part of the explanatory power of the variables. Therefore, some estimators previously found to be statistically significant lose their significance. This is the case for being a pensioner, income, indigenous mother tongue and living in urban areas. All these variables are highly correlated to distinct socio-economic differences among districts. For example, given that pensioners tend to live in urban localities and the indigenous population is mainly agglomerated in rural or highland districts, it was expected that fixed district effects would reduce or even remove the statistical significance of such variables. All these results account for the concentration of some individuals in specific, more economically deprived, geographical areas and the importance of dealing with unobservable factors at the community level. Moreover, unlike models without fixed effects, the variables of abnormal blood pressure and contact frequency with the social support network were statistically significant and negatively associated with SA indicators.
Another interesting finding is the positive and strong association between working and quality of ageing. The status of being employed can help old-age individuals to maintain good levels of cognitive functioning and mobility, although one must be cautious in interpreting this finding given the endogeneity between retirement and health. Rohwedder and Willis (Reference Rohwedder and Willis2010) argue that individuals can self-select into retirement if the cognitive demands associated with the job are intolerable, so that the decision of retirement can be endogenous with the state of the cognitive functioning.Footnote 5 The surprising negative association between having any type of health insurance and the number of successful indicators could be explained by the fact that individuals with poor health are self-selected into health insurance. Another possible explanation is that being affiliated with health insurance is administrative information and does not mean that the individual is really using the insurance. In Peru, a large percentage of poor people are enrolled in the Sistema Integral de Salud (SIS), which is a largely subsidised health scheme for persons living in poverty, and at the same time, evidence suggest that SIS affiliates do not use it.Footnote 6
The physical health-related variables positively affecting SA, after the inclusion of district effects, were good nutritional status (high MNA scores), normal blood pressure, not smoking, and low self-reported disabilities of vision, hearing, body extremities and ‘other’ areas. The relatively strong and statistically significant coefficient of MNA, probably explained by the importance of efficient nutrition and low sarcopenia for physical and cognitive functioning (see Choquette et al. Reference Choquette, Bouchard, Doyon, Senechal, Brochu and Dionne2010; Shatenstein et al. Reference Shatenstein, Ferland, Belleville, Gray-Donald, Kergoat, Morais, Gaudreau, Payette and Greenwood2012), calls for more empirical attention on nutritional aspects, which have not been studied in depth in the SA literature (an exception is Ng et al. Reference Ng, Broekman, Niti, Gwee and Kua2009). Furthermore, results of the regressions revealed that the MNA score is highly correlated with anaemia, so that this instrument could perhaps replace the costly and time-consuming activity of extracting and analysing blood samples in further evaluations. On a similar note, the negative influence of abnormal blood pressure and smoking on SA can be related to the negative effects of these variables on health and cognitive functioning (Brady, Spiro and Gaziano Reference Brady, Spiro and Gaziano2005; Meisler Reference Meisler2002). Regarding self-reported physical disabilities, these limitations can strongly impact the performance of daily life activities (e.g. Wahl and Heyl Reference Wahl and Heyl2003) and in consequence affect the quality of ageing. For example, having poor sight may restrict the individual in his or her ability to read medical instructions and correctly take the adequate doses of medications (Windham et al. Reference Windham, Griswold, Fried, Rubin, Xue and Carlson2005).
Four out of five investigated psychological variables were significant determinants of SA. Having high self-esteem, high empowerment, being free of any mental disability and having less frequent contacts with the social support network were associated with a better quality of ageing. This last result could appear counterintuitive, though empirical research on the links between ageing and psycho-social network are still scarce. The available evidence shows mixed results as some studies have suggested the existence of a positive association (de Moraes and de Azevedo e Souza Reference de Moraes and de Azevedo e Souza2005), a negative association (Chaves et al. Reference Chaves, Camozzato, Eizirik and Kaye2009) or no apparent association (Hodge et al. Reference Hodge, English, Giles and Flicker2013). This discrepancy can be explained by variations in SA assessment (i.e. more or less measurement of psycho-social aspects) and the absence of a clear and unique definition of psycho-social network (Hodge et al. Reference Hodge, English, Giles and Flicker2013). Perhaps it is the quality of the social support network, instead of frequency or quantity of contacts, that likely matters in SA. An example of this is given in Chaves et al. (Reference Chaves, Camozzato, Eizirik and Kaye2009), who note that interactions with unloved acquaintances might represent a psychological burden.
Our finding on empowerment lends support to the idea that older individuals with more bargaining power in pursuing their own desires with respect to resources and decisions can also increase their wellbeing (Giles et al. Reference Giles, Davis, Gasiorek and Giles2013). Good self-esteem is more strongly associated with the indicators of emotional health and life satisfaction than with the indicators of the other dimensions (Table 5). This observation is congruent with other studies that point out that self-esteem is an important component of mental health and efficient coping strategies for stressful life events (Ben-Zur Reference Ben-Zur2002). Furthermore, Cha, Seo and Sok (Reference Cha, Seo and Sok2012) have shown that self-esteem is a strong determinant of SA.
From a policy perspective, the results of this study report a remarkably stable effect of three variables on SA that can be relatively easy to measure, monitor and be affected by public intervention. These are the food insecurity index, MNA and self-esteem. The food insecurity index was measured at the household level with questions referring to various difficulties in accessing food, whereas the MNA is aimed at identifying the risks of under-nutrition and malnutrition with items related to diet composition, mobility and anthropometrical measures. Food insecurity can lead to starvation and represents an important source of stress for the household and its members living in poverty, and a low MNA score relates to a poor quality of nutrition. Self-esteem was measured with a single item which is highly correlated with the ten-item Rosenberg Self-esteem Index. Although the evaluation of the programme Pension 65 has not been carried out yet, an important impact of this programme on the recipients might be an increase in their nutritional state, food security and self-esteem. Nevertheless, the economic transfer provided by the programme could be insufficient to have an impact on these variables given the needs of other (and younger) household members who could demand part of these transfers. This question and similar ones can only be answered empirically with another wave of ESBAM.
Although the literature on SA is extensive, our paper has shown that the use of the multi-dimensional poverty counting approach developed in the economic literature is promising to improve our understanding of wellbeing in old age. Indeed, in public policy circles, the use of multi-dimensional synthetic indicators is gaining prominence, and hence, we believe that the concept of SA can be well taken and applied by policy makers if this is assessed with a multi-dimensional counting approach. Another contribution of our paper is that the focus is on a unique sample of individuals who face different age-related challenges than typical samples used to assess SA. This last aspect is particularly relevant for countries with significant proportions of their elderly living in poverty. Although the situation of elderly people in Peru is not strictly equal to that of other middle-income countries, it may be the case that our results can be used as evidence of how wellbeing is determined in old age.