Introduction
Recently, the economics literature has taken a broader population health approach to understanding the determinants of health by considering the influence of social capital in addition to determinants like income, education, employment status, and housing. Under one conception, social capital has been described as a community-level phenomenon that affects the health and health behaviours of individuals. Social capital, in this sense, is a collective resource used to achieve common goals that could not be achieved by individuals operating alone (Macinko and Starfield, Reference Machado and Santos Silva2001). Putnam (2001) for example, developed an index using per capita membership rates in voluntary organizations to measure civic participation levels and found them to be negatively associated with both adverse health behaviours and mortality (Folland, Reference Folland2006).Footnote 1
While the Putnam index measures the extent of participation or engagement in community social capital (CSC), the Petris Social Capital Index (PSCI) measures per capita employment in a range of community and social service organizations, capturing the extent of CSC infrastructure (Petris Center on Health Care Markets and Consumer Welfare, 2004). Brown et al. (2006) found that the proportion of the PSCI attributable to religious groups had a strong negative effect on the number of cigarettes consumed. Others have used measures of relative income inequality as a proxy for CSC and have found that higher inequality leads to worse health outcomes (Kawachi et al., Reference Kawachi, Kennedy, Lochner and Prothrow-Stith1997).
Others suggest that social capital is better understood at the individual level in which people use personal social networks to strengthen social support, social influence, social engagement, and attachment (i.e., interpersonal bonding), and access to scarce resources (Portes, Reference Portes1998; Berkman and Glass, Reference Berkman and Glass2000) The list of varied measures includes: number or presence of friends (Rose, Reference Rose2000; Hyyppä and Mäki, 2001), membership in a formal or informal group (Rose, Reference Rose2000; Hyyppä and Mäki, Reference Hyyppä and Mäki2001), trust (Veenstra, Reference Veenstra2000; Rose, Reference Rose2000; Hyyppä and Mäki, Reference Hyyppä and Mäki2001; Barefoot et al., Reference Barefoot, Maynard, Beckam, Brummett, Hooker and Siegler1998), sense of control over one’s life (Rose, Reference Rose2000). Much evidence shows that ISC has a positive impact on physical and mental health (Hawe and Schiell, Reference Hawe and Schiell2000; Kawachi et al., Reference Hyyppä and Mäki1997; Kawachi et al., Reference Kawachi, Kennedy, Lochner and Prothrow-Stith1999; Lomas, Reference Lomas1998; Subramanian et al., Reference Subramanian, Kim and Kawachi2002).
What is less evident is whether social capital has an impact on health services – an important process outcome as illustrated in Figure 2 of Richard Scheffler’s introduction – since there are very few studies that consider this question (Scheffler, Reference Scheffler and Brown2008). Individual-level social capital (ISC) in the form of neighbours and friends may improve knowledge about available health resources or increase awareness that treatment is needed (Deri, Reference Deri2005; Aizer and Currie, Reference Aizer and Currie2004; Hendryx et al., Reference Hendryx2002). These links may also provide transportation that can increase access to the health system.Footnote 2 Increases in the supply of CSC – as measured by the PSCI – may also be associated with reduced utilization if these resources substitute for formal health services.
Most studies do not simultaneously consider the impact of ISC and CSC on health, health behaviours, or health service utilization. Some authors have constructed a CSC variable as an aggregation of individual social capital values (see Poortigna, 2006, for example). In such instances, CSC may appear insignificant alongside ISC since the former is derived from the latter. Moreover, a measure of CSC must not assume that the average person’s ISC applies to the entire population (i.e., fallacy of composition). Berkman et al. (2000) and Veenstra et al. (2005) explore the ways in which health, health care utilization, and social capital (particularly ISC) interact, and suggest that social networks may influence the health of members through physiologic pathways like health behaviours that are partially influenced by health care access and utilization. However, the reverse could hold. The direct impact of social capital on health may also have an effect on health care utilization.
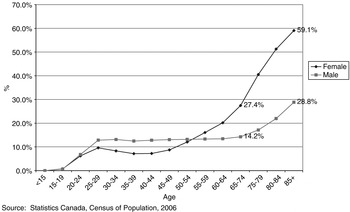
Another element that has not been fully explored is the interaction between age and social capital. One reason to think that the effect of social capital, at whatever level, may differ by age group is that seniors may be more likely to live alone. Presumably, the importance of interactions between individuals and community resources becomes more paramount for health the more isolated the living situation. Those living alone may be at greater risk for poor physical and mental health because the support of an immediate family structure may be missing. This may occur at various stages of life: examples include early adulthood, when a person first leaves their original family unit, and later life, when children leave home and/or a spouse becomes ill or dies. According to the 1971 Canadian Census, the average household size was 3.7. This average declines to 3.0 by 2006 with over 26% of households – one-third of them seniors – containing an individual living alone. Further, lone-person households increased by approximately 25% from 1996 to 2006 (Statistics Canada, 1971–2006; Canadian Community Health Survey 1.1, 2000–2001). As can be seen in Figure 1, there is a strong age–sex gradient with females more likely than males to live alone at older ages.
Persons living alone by sex: Canada, 2006

While isolation may occur at all ages, there is particular concern about the health risks of social isolation among seniors (Abbott and Sapsford, Reference Abbott and Sapsford2005). A growing segment of the population, seniors may therefore be able to benefit more from the presence of social capital than others (Marziali and Donahue, Reference Marziali and Donahue2001). Consequently, it is important to understand the implications of social capital for health care utilization both as populations age and as social norms shift away from reliance on extended family in most developed countries.
In this paper, CSC is measured by the PSCI and ISC is measured through a survey-derived perception of attachment to community. The aim is twofold: first, to determine whether CSC influences health care utilization independently and in the same direction as ISC and, second, to determine whether the impact of social capital on utilization differs by age group. These relationships are examined using data from Canada – an optimal laboratory in which to examine these effects since there is no cost sharing at point of service within its national health system. Hence, a major financial barrier to seeking care is removed allowing for a clearer determination of the effects of social capital on utilization.
Data sources
The Canadian Community Health Survey (CCHS) is a cross-sectional survey produced by Statistics Canada of 133,300 individuals across Canada. The CCHS targets persons aged 12 years or older who live in private dwellings in the ten provinces and the three territories.Footnote 3 For this study, data from the first wave (1.1) (2000–2001) are used because they contain the most extensive information on social capital. CCHS sampling master weights were used to simulate results at the population level.
The survey includes data on the economic, social, demographic, occupational, and environmental correlates of health. This includes information regarding age, gender, income, labour force participation, education, living arrangements, drinking and smoking habits, nutrition, health status, health care access, and health care utilization (GP physician visits and number of annual nights as a hospital inpatient). GP visits were the primary measure of utilization because they are driven by both patient choice (behavioural factors) and biomedical factors (illness/physician clinical judgment). Specialist visits were excluded because GPs function as gatekeepers to such services in Canada, impeding the contribution of social capital – or lack thereof – toward initiating specialist utilization as sometimes happens with GP services.
Since the number of nights as a hospital inpatient are mainly driven by biomedical factors and therefore less likely to be impacted by social capital than physician visits, this measure of utilization is used only to reinforce the results obtained regarding GP visits. Moreover, the sample size was small (< 10% registered hospital inpatient stays), and the question on hospital utilization focused on the aggregate number of annual nights rather than the more classic measure of length-of-stay.
Individual social capital (ISC) was measured by responses to the question: ‘How would you describe your sense of belonging to your local community?’ Survey participants could answer: A – very strong, B – somewhat strong, C – somewhat weak, D – very weak, E – don't know, F – refusal, and G – not stated. There were a total of 121,697 respondents in the foregoing analysis who answered one of the choices A through D.
To measure community social capital (CSC), the PSCI is employed. This validated index uses the percentage employed in religious and community-based organizations within a defined geographic area to measure supply-side community-level social capital (Brown et al., Reference Brown2006).Footnote 4 Data were obtained on paid employment in these organizations (North American Industry Classification System [NAICS] codes: 8131–8139) from the 20% of the population asked to complete the long form of the 2001 Canadian Census. The categories of organizations used in constructing the PSCI include:
8131: Religious organizations
8132: Grant-making and giving organizations
8133: Social advocacy organizations
8134: Civic and social organizations
8139: Business, professional, labour and other membership organizations
The CCHS and Census data were merged based on the sole geographical variable, Census Metropolitan Area (CMA), shared between the two datasets. (There are 25 CMAs across Canada.) Since not all respondents lived in a CMA, there was substantial loss in the sample size from the merging process with the census data as well as from the elimination of observations with missing responses for the survey questions used in the analysis. The CCHS over-sampled residents in rural areas to ensure sufficient coverage of the vast geography of the country; therefore, only 49,480 of the 133,300 CCHS respondents (37.1%, which, when weighted, corresponds to 75% of the population) resided in census metropolitan areas – the common geographical designation between the two datasets. Missing data on income eliminated another 4,613, individual social capital eliminated 3,329, and various other right-hand side variables eliminated 2,183 more observations. The final sample size was 39,355 across all provinces with the exception of Prince Edward Island – the only province without a municipality meeting the criteria for a Census Metropolitan Area.
Methods
The analysis was structured as a two-part model (Greene, Reference Greene2003). First, the probability of visiting a physician (GP) was estimated using a probit equation. Second, service intensity (number of GP visits in the last 12 months) was modeled separately, using ordinary least squares regression with a Heckman correction for clustering of errors within each of the CMAs (Cluster Error Correction OLS or CEC-OLS) (Greene, Reference Greene2003). Since these data were skewed, service intensity was log transformed.
In addition to ISC and CSC, the explanatory variables included age (age <45, age 45–64, age 65, and over), sex, diet, education, income (household and CMA), home ownership, labour force participation, living arrangements (e.g., living alone, with others, common law/married), health status (number of chronic health conditions), immigrant status, region, urban location, having a regular GP and degree of migration within a CMA. Behavioural risk factors (e.g., smoking, alcohol consumption) were also included since they have been found to influence utilization of physician services (Sturm, Reference Sturm2002). ISC and CSC were also interacted with the age categories to determine whether the impact of social capital differed by age while holding health status and the other explanatory variables constant.Footnote 5
Quantile regression – a semi-parametric method – was also applied to GP physician utilization allowing for the analysis of these data without imposing a distribution (Winkelmann, Reference Winkelmann2006). This approach enabled us to determine if changes in any of the explanatory variables affected the shape of the distribution around the conditional mean. Specifically, we examined whether the impact of social capital differed between those with high and low numbers of GP visits. The ‘jittering’ techniqueFootnote 6 was used to adapt quantile regression to count data permitting examination of lower-end quantiles with large numbers of observations with no observed physician visits (Machado and Santos Silva, Reference Lomas2002). Statistical analyses were performed using SAS v9.1 and STATA v8.0.
It should be noted that the results from the CEC-OLS and the quantile regression are not strictly comparable. The quantile approach used the entire distribution, whereas the second stage CEC-OLS equation excluded those without any GP visits. To see the implication of this, consider the case of a mean-preserving spread (e.g. increasing the proportion of the distribution in the top quantile and in the bottom quantile by amounts that leave the average (mean) of the distribution unchanged). Since the quantile regression includes the entire distribution, the measure of the central tendency of the distribution will not change. Because, in the truncated distribution, the proportion of observations in the upper tail will have increased but the extra observations moved into the bottom tail will drop out, the mean of the truncated distribution will increase. In the regression context, it would then be possible to find a variable that increases the mean of the truncated distribution (CEC-OLS) and has no effect on the mid-point of the full distribution (quantile).
Results
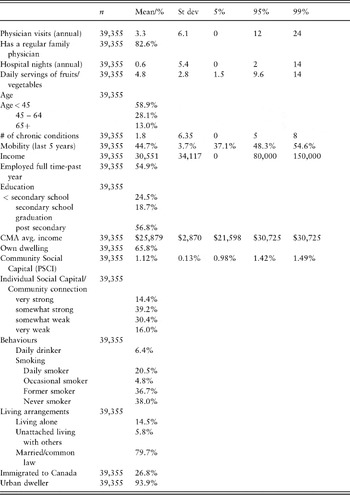
As Table 1 indicates, the survey sample is reflective of the age distribution of the entire population with age < 45 = 58.9%, age 45–64 = 28.1%, and age 65 = 13.0% of the total. A majority (56.8%) had post-secondary education and owned their own dwelling (65.8%). The vast majority of people (79.7%) were married or in a common-law relationship. Approximately 26.8% were immigrants and 82.6% reported having a regular GP. In terms of health behaviours, 20.5% were daily smokers and 36.7% were former smokers. Approximately 6.4% reported that they were daily drinkers. Less than 10% of the sample registered an overnight stay in hospital and the average number of annual GP visits was 3.3 with a maximum in excess of 24 visits. The average value of the PSCI was 1.12%.
Descriptive statistics (weighted data)

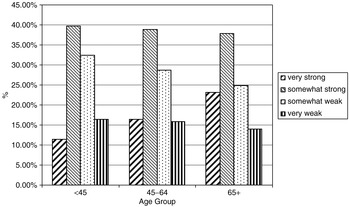
The distribution of the ISC variable by age group is depicted in Figure 2. The gradient strongly suggests that current seniors have much stronger ISC than the generations following them. Over 23% of seniors report having very strong community connections, while less than 17% of those age 45–64 and less than 12% of those < 45 reported likewise. The opposite age-based gradient is observed with the other levels of ISC reported.
Individual social capital by age group (level of self-reported connection to local community)

Propensity and intensity of GP visits
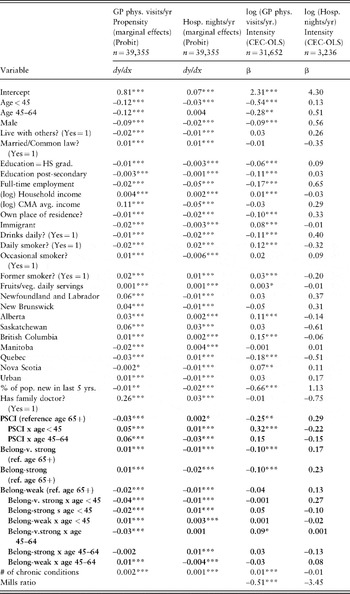
The probit and CEC-OLS regressions for physician visits and hospital nights were estimated both with and without the ISC variables included to establish whether the inclusion of ISC added new information to the models and/or confounded the effects of CSC. Since the exclusion of ISC did not impact the magnitude or significance of the other variables, only the full model results are shown in Table 2.
Two-part regression results for annual GP visits and hospital nights

Notes: ***significant at the 1% level, **significant at the 5% level, *significant at the 10% level.
Log likelihood Log likelihood R-sqr adj. R-sqr adj.
–5910246.0 p < 0.01 –3230397.3 p < 0.01 0.09 p (> F) <0.01 0.13 p ( > F) < 0.01
The results indicate that seniors are more likely (12%) than younger cohorts to visit a GP, although this effect is mitigated by increased CSC/PSCI (3% less likely for 1% increase in PSCI). The observed effect of CSC/PSCI on younger cohorts is the reverse with positive associations between CSC and GP visits. The effects for ISC were generally opposite and smaller in magnitude to those for CSC with seniors experiencing more physician visits, while younger cohorts experienced fewer visits in response to increased ISC.
Regarding other effects, higher education was associated with a slightly decreased likelihood of a visit, while higher household income and average community (CMA) income were associated with an increased likelihood. It is interesting to note that home ownership, a proxy for wealth, had the opposite effect to the income variables. Also, working full-time was negatively related to the probability of a visit.
The effects with regard to hospital nights were generally smaller in magnitude and in the same direction as those noted for visits with the notable exception of CMA average income and the social capital variables. Given that it is unknown whether a survey responder’s aggregate hospital nights are referring to one or several hospital stays, it is difficult to definitively interpret the impact of these variables on hospital inpatient utilization.
A number of variables were included to capture differential access to GPs. Not surprisingly, those who indicated having a regular GP were more likely to have at least one visit (26% more likely than those without a regular GP). Higher average CMA income was positively related to likelihood of visits, perhaps reflecting greater supply of physicians in wealthier communities. Despite controlling for differential access and health status, immigrants were still less likely to visit a GP, possibly reflecting the delay newcomers face in finding a GP.
Regarding the intensity (CEC-OLS) equations, much the same relationship was observed between the explanatory variables and the number of GP visits as in the propensity models. One exception involved immigrants who were less likely to initiate a GP visit than non-immigrants, even though there were more visits among those who utilized physician services. A one standard deviation increase in the PSCI (0.13%) is association with a 3.25% (= –0.25* 0.13) decrease in physician visits among seniors with a small net increase responding to age < 45 (0.93% = 0.13*[–0.25 + 0.32]). Given that seniors account for 23.3% of primary care visits but only comprise 14.8% of the population, the overall decrease in physician visits from a one standard deviation increase in the value of the PSCI is approximately 5% or a $225 M annual offset (NPDB, Reference Marziali and Donahue2001).Footnote 7 Likewise, those over age 65 with the strongest ISC had 1.3% (= –0.10*0.13) fewer physician visits compared to those reporting the weakest levels of ISC while no significant effects were noted for younger cohorts. It should be noted that both forms of social capital had no significant effects on the number of hospital nights.
A selection effect was also found as evidenced by the significance of the Inverse Mills Ratio in the CEC-OLS equation for GP physician visits.
Quantile regression
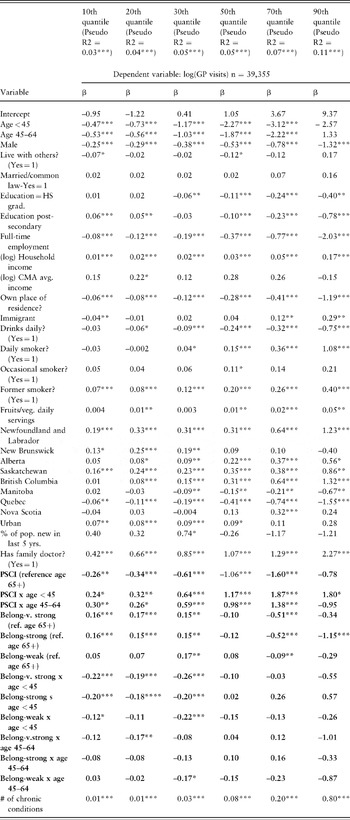
Table 3 reports the coefficient estimates for six different quantiles. CSC reduced seniors’ GP utilization at the median and 70th quantiles – as well as at the 40th and 60th quantiles (not shown). The results suggest that the effect of the PSCI may be most prominent in the mid-range of utilization – those with three to five GP visits per year. Again, the effect of changes in the PSCI on younger age groups (under 45 and 45–64) was minimal.
Quantile regression results for GP visits

Notes: ***significant at the 1% level, ** significant at the 5% level, *significant at the 10% level.
ISC increased seniors’ GP utilization, but the effects were both smaller and largely concentrated at the lower end of the utilization distribution. However, there was one quantile (the 70th) that showed a reverse effect. This result is important because it helps to indicate that the negative association between ISC and GP visits noted in the intensity models in Table 3 is not uniformly observed throughout all quantiles.
Discussion
Social capital had a noteworthy impact upon utilization of GP services but less so regarding hospitalization. The results suggested that greater CSC decreased the likelihood and number of visits for seniors, while the effects of ISC were both smaller and more ambiguous than those for CSC. While CSC had the largest impact on seniors in the mid-range of utilization – three to five GP visits per year – ISC increased utilization among the lowest utilizers of GP services, while decreasing it among those at the 70th quantile. One possible interpretation is that having a network of friends and family assists mostly by arranging/encouraging the first few visits with a GP, but that at higher levels it is possible that ISC helps to avoid the need for further GP visits. That neither form of SC impacted upon the high end of the utilization distribution supports the contention that the highest levels of utilization are driven primarily by health status and that, amongst people with low utilization, there is a significant proportion that are either healthy or are in need of some personal assistance in establishing initial GP contact. One key ‘non-finding’ was that living alone, in itself, is not determinative of GP utilization at any age since interactions between living alone and the age-group variables were insignificant and hence were left out of the models. In general, the issue of social isolation and health care utilization is more complex than simply considering one’s residential situation.
These findings are not necessarily contradictory since each form of social capital probably operates through different mechanisms: ISC perhaps serves an enabling (complementary) role by improving access (e.g. transportation services) among low utilizers, while CSC might serve as a substitute for GP visits that might involve counseling/caring services. Regarding hospital services, the impact of CSC on the propensity to use such services – though statistically significant – was smaller than for GP services and the impact of ISC was also small though opposite in sign to that noted for GP services. Not surprisingly, social capital had little noticeable impact on the intensity of hospital utilization since hospital length of stay is mostly dependent on clinical judgment rather than behavioural and social capital factors. Future qualitative research is needed to better understand the precise mechanisms by which ISC and CSC impact utilization.
Since the PSCI measures employment in charitable, non-profit and social service sectors, it captures the structural aspects of social capital (Petris Center on Health Care Markets and Consumer Welfare, 2004). Therefore, it seems reasonable that more structural CSC would act to reduce the need for primary care. For example, ‘Meals-on-Wheels’ programs, by keeping seniors properly fed may improve or maintain their health and reduce their need for GP visits. However, it is possible that the coefficients on the PSCI may have been affected by selectivity bias if relatively ill people move to an area with high CSC. Health status (number of chronic conditions) was therefore included to addresses this concern.
ISC may operate via networks of friends and family. These networks ensure that an individual receives medical attention when necessary and may even provide transportation to access health services. Unfortunately, the CCHS questionnaire did not define ‘community’ so it is not possible to be definitive. Moreover, there is a possibility that the ISC measure may be endogenous. That is, an individual that visits a GP frequently may, as a result, have an increased sense of community attachment. To refute this, the quantile regressions show that ISC is more consistently significant at the low end of utilization rather than at the upper end of the distribution. If more frequent GP visits raised the stock of ISC, then one would expect the impact of ISC to increase with utilization not lessen as these results indicate. To be cautious given the lack of a suitable instrument, a variable indicating good access to a GP was included in the models to control for potential endogeneity from the direct effect of health care utilization on social capital. Regarding whether there were still indirect endogenous effects through health, the health status variable involving the number of chronic conditions was removed to determine whether the social capital variables were impacted. Confounding would be expected if such endogeneity exists, but given there were no noticeable changes, this possibility is minimized. Further, given that health status is a stock variable accumulated over time, the direction of causality is thereby better determined in this cross-sectional data.
The finding that higher education is associated with a slightly decreased likelihood of a visit supports Grossman’s argument that more educated people are more efficient producers of health and therefore require fewer visits ceteris paribus (Grossman, Reference Grossman1972). The positive relationship between household income and likelihood of a visit suggests that visits are viewed as a normal good consistent with the findings of van Doorslaer et al. (2004). However, home ownership, a proxy for wealth, was negatively related to likelihood of a visit. Also, working full-time was negatively related to the probability of a visit, suggesting that there was perhaps a higher opportunity cost associated with physician visits among these workers.
With regard to policy concerns, governments may consider a number of options in response to the results contained herein. While the tendency has been for increased funding of home care and institutional care in Western societies over the last number of years, it might be time to reconsider support for community-based programs targeting seniors and informal care providers to support ‘ageing in place’. Many social problems become medicalized and, as these results imply, substantial improvements in utilization – in terms of both access and over-utilization – could be attained without relying on the medical community. Recognition that community-based programs and informal care providers constitute an important part of the health care continuum will help to deal with the impending burdens on health care systems dealing with an increasingly aged population in the coming years. Recently, many jurisdictions have sought to make health care provision more flexible by increasing choice among alternative providers. Cash-benefit programmes have been developed in various European countries in the form of personal budgets, consumer-directed employment of caregivers, and direct payments to caregivers or care recipients (Glendinning et al., Reference Glendinning, Davies, Pickard and Comas-Herrera2004). There are also tax breaks for informal care providers and community-based organizations as an incentive to locate in certain underserved areas – akin to free-enterprise zones – as available policy options. As well, improved navigation tools, such as ‘211’ telephone numbers introduced in Toronto, will help to make better use of whatever supply of services is currently available.
This paper began with a question as to whether social capital had a differential impact by age group. The results suggested that social capital mattered more for seniors within the mid-range of GP utilization. This may simply be a cohort effect if older people are part of a generation that had a stronger sense of volunteerism or community as compared to younger cohorts. Alternatively, older people may actually benefit more from both social networks and the types of services represented in the PSCI. What is of utmost concern, however, is the age gradient observed in Figure 2 in which younger cohorts appear less connected to their community than do the current lot of seniors. With the impending retirement of the much larger baby boom generation, the implication of lower levels of ISC among younger cohorts on future health care utilization cannot be ignored. Replication of the current analysis on subsequent years of data might provide further insight as to whether larger amounts of ISC are acquired at older ages or whether there are true differences between the generations in this regard.
It appears that social capital is an important factor affecting not only health, but that it has an impact earlier in the process-at the level of service utilization. This relationship was evident in cross-section and future research should assess whether it holds over time.