I
When Charles Dow computed the first Dow-Jones Industrial Average Index in 1896, his goal was to construct an index that could measure changes in market sentiment. His approach was crude by modern standards since he simply took the average of the prices of a select number of securities and neglected dividend payments. Nevertheless, this rough measure is still reported in the news headlines on a daily basis. In a similar vein, nineteenth- and early twentieth-century historians have measured stock market trends with a limited number of securities, sometimes without even taking the relative importance of companies into account. The concept of a market portfolio, consisting of a weighted sum of every asset in the market, with weights proportional to their market capitalisation, only gained importance when equilibrium models such as the Capital Asset Pricing Model were published. Hence, when calculating an index in pre-computer days, no particular attention was devoted to weighting schemes (with some notable exceptions, such as in Cowles Reference Cowles1938), nor to the inclusion of dividends. The selected stocks were assumed to represent the economy. One can argue that Dow's approach merely represents an application of the Pareto principle (also known as the 80–20 rule or the law of the vital few), which states that, for many events, roughly 80 per cent of the effects stem from 20 per cent of the causes. The remarkably high correlations often reported between the Dow-Jones Industrial Average Index and broader-based indices such as the S&P500 seem to confirm the Pareto principle.
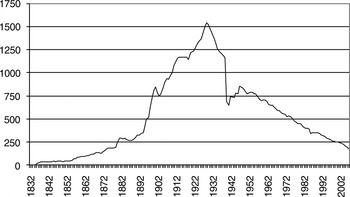
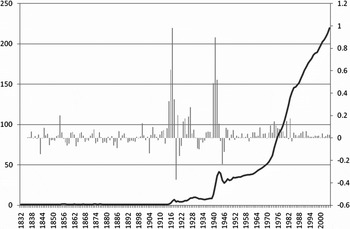
In this article, we calculate a market-weighted return index for the 20 largest stocks listed on the Brussels Stock Exchange (BSE) over the period 1833–2005, based on a new, unique and high-quality database. While the importance of the BSE on a world scale is nowadays negligible, in the past it was among the top ten stock markets of the world (Neymarck Reference Neymarck1911, p. 442). The BSE was the most important Belgian stock exchange in the nineteenth and twentieth centuries. It was a very international and open market, with listed companies from all over the world. This is not surprising, as Belgium was the first country to take part in the Industrial Revolution on the European continent (Bairoch Reference Bairoch1982, pp. 269–312). Much foreign capital (largely French and German) flowed to the BSE and was subsequently reinvested abroad (Chlepner Reference Chlepner1930; Maddison Reference Maddison1995). Before World War I, Belgium was, per capita, among the top foreign direct investors. In the period between the two World Wars, there were more than 1000 companies and more than 1500 stocks quoted on the BSE (see Figure 1). Contrary to some other countries where only a few sectors developed, the Belgian economy was widely diversified with important activities ranging from railways, tramways, coal mining, steel and glass to banking, telecommunications and electricity.
Evolution of the (end of the year) number of stocks at the BSE (1832–2005)

We find that a market-weighted return index for the 20 largest stocks, which we call the SCOB20 index, captures relatively well the most important stylised facts of the value-weighted return of all shares listed on the BSE in this period. Our results support the empirical practice of limiting return indices to just the largest stocks of an economy. The indices take into account the exact dividends, the timing of the dividend cash flows and all capital operations. We are therefore able to decompose total returns into capital gain returns and dividend returns, which is not possible with most historical return series. We show that, to construct a credible return index, it is crucial to fully take into account dividends. Unfortunately, most countries' historical records do not include precise dividend data for the nineteenth century.
The remainder of the article is structured as follows. In Section II we describe our dataset. In Section III we discuss the methodology used to construct our indices. In Section IV we discuss the historical context of the evolution of the SCOB20 index and the Belgian all-shares index. In Section V we investigate whether the SCOB20 index is a good proxy for overall market returns. In Section VI we discuss the delisting bias. Finally, we conclude in Section VII.
II
The data used in this article were taken from the database of the SCOB (Studiecentrum voor Onderneming en Beurs) Research Centre of the University of Antwerp. This database includes end-of-the-month stock prices, dividends, interests, ex-dividend day and the number of stocks for all stocks ever quoted on the BSE. The SCOB database is unique for several reasons. First, the data go back to 1832, making Belgium one of the very few countries for which such a long time series is available. Second, the data have been well conserved in the official quotation lists available from 1832 onwards. There was hardly any need to rely on newspaper information. We only lack the official lists of 1833, 1835–8, 1840–5 and 1848–52. To fill these gaps, we use the IPO information lists of the Belgian Ministry of Foreign Affairs (Belgium, Relevé des côtes 1867) as well as the price lists printed in the official gazette Le Moniteur Belge (Belgium, Moniteur Belge). A publication of the official stock brokers (Commission des Agents de Change 1855) filled the remaining gaps. Third, complete information on dividends, capital operations, sector affiliation and number of quoted stocks is available. A lack of information on dividends, in particular, is one of the biggest difficulties when constructing historical time series for other markets. Last but not least, many high-quality secondary sources allowed us to double check the data. In Belgium, the secondary literature on company, stock and dividends information is rather abundant and early, occurring in several important publications (Trioen Reference Trioen1839; Demeur Reference Demeur1857–4, Reference Demeur1876–84; Courtois Reference Courtois1855–1883; Van Damme Reference Van Damme1859; Vitu Reference Vitu1864) in addition to financial newspapers such as Moniteur des Intérêts Matériels (various issues) and Het Handelsblad. The official price lists contain information on dividends from 1873 onwards. From 1893, the annual Recueil Financier (1893–1975), as well as the monographs by Coppin, provide a wealth of information (Coppin Reference Coppin1893–1901; Recueil Financier, 1893–1975). Company information is extracted from Frère and Laureyssens (Frère Reference Frère1938, Reference FRère1951; Laureyssens Reference Laureyssens1975). For recent decades, information is found in the Memento der Effecten, (internal) Euronext company files (with detailed information on capital operations) and the newspaper Financieel-Economische Tijd (subsequently De Tijd), which has published a detailed survey of all corporate operations on a monthly basis from 1992 until now (Financieel-Economische Tijd; De TIJD; Het Handelsblad; Journal du Commerce d'Anvers; L'Avenir; Memento der Effecten).
III
In this section we outline our methodology to construct the SCOB all-shares index and a narrower (blue chip) SCOB20 index. After discussing the computational issues, we address some stock selection issues.
First, in order to measure the investment performance on the Belgian stock market, we calculate a Laspeyres market capitalisation–weighted nominal price (capital gain without dividends) and a total nominal return (with dividends) index by linking monthly returns by the chain method. The index reflects the evolution of the value of 100 Belgian Francs (BEF) invested in Belgian-based stocks from the end of 1832 on. The indices are constructed as follows:
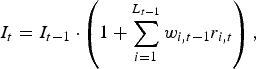
where I t is the value of the index at the end of period t, w i,t−1 is the weight attached to stock i at time t−1, L t−1 is the number of stocks at the end of month t−1 and r i,t is the ordinary return of stock i, including (excluding) dividends for the total return (price) indices. Dividends are included at the end of the ex-dividend month. We set I equal to 100 at the end of 1832. The weights used are the relative market capitalisations:
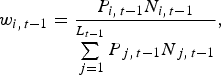
where N i,t−1 is the number of outstanding shares for stock i at the end of period t−1. Of course, adjustments for stock splits and reverse splits, bonus stocks, inscription rights and attribution rights are made. We take the geometric average (time-weighted rate of return) as an indicator of the return on investment.
Volatility typically is measured by the standard deviation of returns, which is calculated based on monthly returns in order to capture intra-year volatility. However, when annualising the variance, we adjust for potential autocorrelation (11 lags), as the hypothesis that there is no autocorrelation in the monthly return data is rejected by the data. The annualised variance is:

where ρj is the return autocorrelation at lag j.
Besides nominal returns, we also compute real returns. The consumer price index (CPI) is used to deflate the nominal series. For the period before World War I, we use data from Michotte and Van de Velde (Michotte Reference Michotte1937, pp. 346–57; Van de Velde Reference Van De Velde1943, pp. 21–5). For the period after World War I, we use data from the Ministry of Economics (Belgium, CPI-index 1920–2008). The biggest problem with respect to estimating inflation is the highly murky price evolution during the two World War periods. We follow the methodology proposed by Van de Velde (Reference Van De Velde1943) for World War I by taking the official price index, as this index approximately followed the real price evolution. For World War II we compute inflation as a weighted average of inflation based on the official price index and the index on the black market (National Bank of Belgium 1951, p. 224, table 22.2). More specifically, we take 75 per cent of the official market rate and 25 per cent of the black market rate. Although somewhat arbitrary, these proportions approximately correspond to what people spent on both markets.
Second, we consider stock selection issues. The SCOB database contains various kinds of stocks (common stock, preferred stock, etc.). We only select common stocks, and ignore bonds and other instruments with mixed characteristics (Fisher and Lorie Reference Fisher and Lorie1964, pp. 1–21; Reference Fisher and Lorie1968, pp. 291–316; Reference Fisher and Lorie1977). We also restrict the sample to stocks traded on the spot market. There are several reasons for this. First, stocks that were listed on the forward market had to be listed on the spot market, but not vice versa, implying that the spot market had wider coverage. Second, there are no continuous data on the forward market, as it was closed from 1940 until 1950 due to World War II and its aftermath, while spot market data are available for this period. Third, before 1871 there was no forward market. Indeed, forward contracts were not officially allowed and were considered a form of gambling (known as exception de jeu). Fourth, between 1871 and 1914 the forward market was comprised nearly exclusively of foreign stocks.
We only take into account Belgian-based companies, even when they invested mainly abroad, such as steel producer Société Métallurgique Dniéprovienne du Midi de la Russie (founded in 1886 and mainly producing in Russia) and Belgian Congo companies such as Union Minière du Haut Katanga (founded in 1906). However, no foreign-based companies (‘cross-listings’) are in our sample.
All data are taken from the SCOB database, which offers end-of-the-month prices, dividends, interests, ex-dividend day and number of stocks from the BSE. Whenever a given stock does not trade on the last day of a month, the previous price is used. In general, whenever the default opening price is missing we take either one of the following (in order of preference): previous price, bid and ask prices or external prices (as available in the Prix Courant published in the Le Moniteur Belge). All stocks ever quoted are available, so selection bias is avoided. We always consider the number of stocks admitted on the official quotation list. This number can be smaller than the total number of stocks issued.
We define the SCOB20 as an index comprising the common stock of the 20 companies that had the largest market capitalisation on the last day of the previous year. The SCOB20 therefore does not suffer from survivorship bias, as we select stocks without any look-ahead knowledge (the same applies to the all-shares index). As for the all-shares index, the SCOB20 index uses market capitalisation weights. We keep the composition of the SCOB20 constant during the year and rebalance at the end of the year. In the exceptional case that a SCOB20 company delists, it is only replaced at the end of December. There was one year in which the twentieth and twenty-first companies had identical market capitalisations; in that case we included both of them in the index.
IV
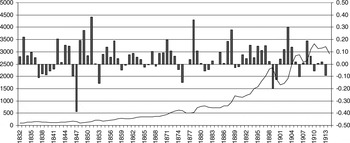
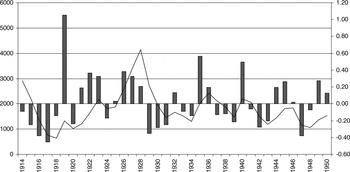
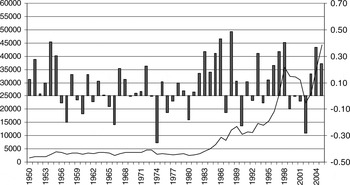
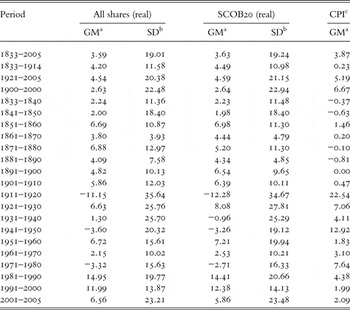
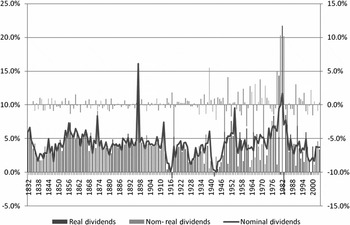
In order to put the realised stock market performance into perspective, in this section we discuss the historical context of the evolution of the SCOB20 index and the all-shares index (Chlepner Reference Chlepner1930; Van der Wee Reference Van Der Wee1997; Van de Velde Reference Van De Velde1943; Mommen Reference Mommen1994). Yearly nominal and real capital gain and total returns for the SCOB20 and the all-shares index are tabulated in Table 1, while Table 2 reports, for different subperiods, the geometric average return and volatility for the all-shares return index and the SCOB20 index, as well as the CPI. Furthermore, Figures 2, 3 and 4 show yearly total returns and the total real return all-shares index for the periods 1832–1914, 1914–50 and 1950–2005, respectively. At the end of this section, we also discuss the market constituents of our stock exchange indices. As the performance of the BSE was, to a large extent, driven by some dominant sectors, a breakdown of the market constituents into sectors can help one to understand the evolution of the indices considered in this study.
Total returns and the total teturn SCOB all shares index (1832–1914)

Total returns and the total return SCOB all shares index (1914–1950)

Total returns and the total return SCOB all shares index (1950–2005)

Annual indices SCOB20 and all shares (capital gain, total return, both nominal and real)

Notes: CG stands for capital gain; TR for total return, 1832 = 100.
Source: SCOB database. Version 2008.05.
Summary data on total return for the all shares and SCOB20 (real) data (all numbers are in percentage points)

aGeometric mean. bAnnualised standard deviation. cCPI (average inflation by period).
Source: SCOB database. Version 2008.05.
First, we discuss the period 1833–1914, which was characterised by moderate inflation and sometimes even deflation; and a rather stable currency: compared to the period after World War I, the BEF had the same purchasing power in 1913 as in 1832. Furthermore, in this period there were no dividend taxes and almost no company taxes. It was also a period of ‘capitalism for the few’, with huge disparities in income and wealth, extremely low wages, hardly any social protection for the working class and, on the political side, restricted voting rights for the vast majority of the population (although more so in the early years). This had consequences for the stock exchange. Stocks had an extremely high nominal value (on average, 1000 BEF a share, approximately the same as one year's labour wage), limiting participation in the stock market and causing liquidity problems, reinforced by the very strict government regulation of the stock market until 1867. Before 1873 it was extremely difficult to set up a limited liability company, as a Royal Decree was needed. A listing on the stock exchange also required government intervention. Interest rates were capped at 6 per cent for commercial loans. From 1865 until 1873 a set of fundamental institutional reforms transformed the legal system completely by removing almost all impediments to founding companies and stock exchange listings.
The period 1833–1914 starts with the Gründerjahre of Belgian capitalism (1833–48). The mixed banks Société Générale (established 1822) and Banque de Belgique (established 1835), the first universal banks in the world, financed the rapid upswing of an impressive number of new companies in a wide range of industries. The Belgian government financed a basic national railway system, which came into existence within a few years (1835–43). Economic life was regulated and the basic structures of a modern market economy were laid down. They were, however, not well established. In the absence of a lender of last resort, private banks could issue their own money. This had terrible consequences for the economy. Belgium went through two economic and financial crises in 1837–8 and 1847–8. The negative real return of −39.06 per cent in 1848 was the largest negative return recorded in Belgium over the period 1833–2005.
The crisis of 1848 resulted in the founding of the National Bank of Belgium in 1850, with the intention to bring stability to financial markets. In 1851 an interest guarantee system for constructing railways by private companies was established, which gave a boost to the construction of new railways and to railway-related industries such as coal mining and steel. As a result, the real capital gain index (starting in 1833 at an index value of 100) climbed from 55.94 in 1848 to 110.49 in 1852. During 1865–73 the Belgian economy liberalised, participating in a Europe-wide economic liberalisation movement. From 1865 on, interest rates could be freely determined in Belgium. In 1867 the liberalisation of the stock exchanges was initiated. This liberalisation was completed with the law of 1873 freeing-up the founding of limited liability companies. Belgium would not be involved in the first French–German War (1870–1), and it actually profited from an inflow of French and German capital after the war.
The period 1871–1914 represents the high days of European economic power and the first period of economic globalisation. Belgian firms invested heavily in countries as far flung as Argentina, Russia, Egypt and China (Peeters Reference Peeters and Bovykin1998, pp. 101–25; Cuyvers and Van Bets Reference Cuyvers and Van Bets2009, pp. 189–210). Belgium also colonised the Congo. From the crisis of 1848 until the outbreak of World War I, Belgian shareholders were spared from large negative returns. Total real returns climbed as high as 6.54 per cent for the decade 1891–1900 and 6.39 per cent for the decade 1901–10.
World War I would put an end to economic globalisation, to monetary stability and to relatively peaceful European relations. At the same time it would bring democratisation of the Belgian political system and improve the miserable conditions of the working class. During World War I, Germany occupied Belgium and exploited the Belgian economy on a tremendous scale. Many firms were completely destroyed, machinery was deported and a lot of money was issued to finance the German war efforts (de Kerckhove de Denterghem Reference De Kerckhove De Denterghem1927). Moreover, the Russian Revolution of 1917 made Foreign Direct investments in that country worthless, which hit Belgium especially hard, being one the main investors in Russia. The overall economic consequences were disastrous: World War I left Belgium with one-third of its fixed capital destroyed, a substantial part of its Foreign Direct investments permanently lost, monetary instability, a tremendous loss of purchasing power for its currency and a high government debt.
The interwar years were characterised by a highly unstable monetary situation, two devaluations of the BEF (in 1926 and 1935), a large banking crisis and a deep economic depression. Surprisingly, all this turmoil did not result in large negative average returns. However, this average hides very diverse evolutions. In the first decade after the war, total real returns average around 8.08 per cent for the decade 1921–30. However, after the ‘monster’ returns of 67 per cent and 83 per cent in 1926–7, the stock market in 1929–31 recorded three consecutive large negative returns of, respectively, −35 per cent, −34 per cent and −35 per cent. Overall, the decade 1930–40 was a disastrous one at the BSE. World War II brought an end to this. Within a few months, stock prices had nearly doubled in nominal terms. In real terms this resulted in a 44.32 per cent return in 1940.
During World War II, Belgian industry worked for occupying Germany. Therefore, in contrast to World War I, the industrial, transport and mining infrastructure was not destroyed, and firms continued to make profits and dividends continued to be distributed. Nevertheless, due to high inflationary pressure, the overall total real returns were -3.26 for the 1941–50 decade.
The period 1946–60 was characterised by post-war reconstruction; the beginning of the European integration process and the decolonisation process of the Belgian Congo (1960) and Ruanda-Urundi (1962). Returns on colonial stocks were among the highest in the world in the 1950s, strongly contributing to the soaring total real return of 7.21 per cent for the decade 1951–60 (Buelens and Marysse Reference Buelens and Marysse2009, pp. 135–66).
The next decade, although generally characterised as the ‘golden sixties’, brought poor performance for investors, with an average total real return of only 2.53 per cent. The effects of decolonisation were felt (the companies involved are in our sample) and could not be sufficiently compensated by the European integration process. Moreover, a structural crisis in some major sectors of the Belgian economy, especially coal mining, was felt at the time.
During 1973–80 Belgium went through one of the most severe economic crises of the post–World War II period, culminating in a combination of towering inflation and high unemployment (‘stagflation’). Inflation, already a permanent phenomenon in Belgium after World War II, reached 15 per cent in 1974, driving the short rate on T-bills up to 17 per cent around 1980–1. As a result, total (geometric) returns were negative in the period 1971–80 in real terms (−2.71 per cent).
From the 1980s onwards, the importance of the BSE greatly diminished. The Cooreman–De Clercq Law of 1982 (inspired by the Monory Law in France) tried to give a boost to the stock market by providing important fiscal incentives to buy stocks. Similar to other countries, the next decades lead to impressive equity returns: 14.41 per cent (1981–90) and 12.38 per cent (1991–2000). But this bull market could not hide that the composition of the BSE was rapidly changing: fewer stocks were listed; fewer Belgian companies survived; and a few sectors, such as financials, came to dominate the listings. During the 1990s, far-reaching technological and institutional changes took place at the BSE.
Various sectors have dominated the BSE throughout its history. We select the most important ones: the financial sector (banks and holding companies); transport (railways and tramways); steel and non-ferrous metal; coal mining; and the sector chemicals, oil and electricity. The ‘other’ category is rather diversified, including companies from the following industries: glass, food, breweries, land companies, water, as well as many others. Table 3 reports the relative importance of these sectors in each year of the period 1833–2005.
Breakdown of the sectors contained in the (all shares) stock market indices (percentage of market cap)

Source: SCOB database. Version 2008.05.
The financial sector clearly dominated the BSE in the beginning, as the two universal banks, Société Générale and Banque de Belgique, were of paramount importance to the Belgian economy. Their market share diminished gradually as the transport sector grew in importance. In 1862 transport accounted for 32.33 per cent of total market cap, compared to 31.36 per cent for banks. As in many other countries, private railway was the most important non-financial industry on the BSE during the nineteenth century. Coal mining companies were also very important. In the nineteenth century, Belgium was one of Europe's biggest coal producers. And coal mining became the most important non-financial industry after World War I, with 25.32 per cent of market cap in 1918. However, it was to soon decline to only 4.43 per cent by 1927. In the meantime, chemicals, oil and electricity had taken over the leading position of the non-financial sector, with 21.01 per cent of market cap in 1928. It would come to dominate the BSE after World War II, with 54.57 per cent of market cap in 1981. From then on, the financial sector made a fast climb, primarily due to the transformation of many companies into holding companies, but also due to the increasing importance of several giant banks (e.g. Fortis and Dexia). Their share of market cap was 62.06 per cent in 2000, while chemicals, oil and electricity was second with 26.67 per cent.
V
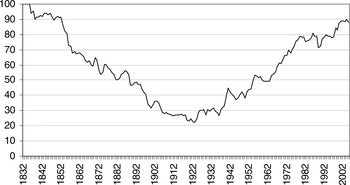
The number of data inputs needed to compute our SCOB20 is only a fraction of the full SCOB database. The question remains, however, whether researchers would infer economically and statistically different conclusions when taking a SCOB20-like index to proxy for market performance (Le Bris and Hautcoeur Reference Le Bris and Hautcoeur2010, pp. 1–43). Evidently, as the SCOB20 dataset is composed of a fixed number of companies, it represents a time varying percentage of total market cap (see Figure 5).Footnote 2 Quite naturally, when only a small number of stocks were listed, the results of the SCOB20 index and the all-shares index are nearly identical, but this is only the case for the first few years.
Market capitalisation SCOB20 as a percentage of total market capitalisation (Belgian-based companies only)

As can be seen in Figure 5, the evolution of market capitalisation of the SCOB20 is in line with the number of stocks quoted. In the early days the SCOB20 included the entire market, but very soon more stocks appeared, resulting in an ever-decreasing share of the SCOB20 in total market capitalisation, reaching its lowest level in the early 1920s. During the 1920s the number of stocks increased even further, but important merger and acquisition activity took place, resulting in an increasing share of the SCOB20 (Kurgan-Van Hentenryk Reference Kurgan-Van Hentenryk and Van der Wee1997, pp. 65–286). After World War II the decreasing number of Belgian-based firms on the BSE brought an ever-increasing market share of the SCOB20 in the total market capitalisation.
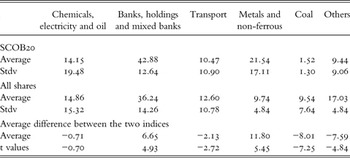
Of course, by selecting only 20 stocks out of the investment universe, we are likely to poorly mimic the industrial composition of the total market with only 3403 company-years (which is the number of selection years times the number of companies included in the SCOB20 in every year). The SCOB20 has been heavily dominated by the following industries: steel and metals (493 company-year observations), holding companies (489), bank and insurance (469), railways and tramways (447), non-ferrous metals (302), coal mining (271) and electricity and gas (208). The differences in industrial composition between the SCOB20 and the all-shares index are illustrated in Table 4. The most important sector in both the SCOB20 and the all-shares index was ‘banks, holdings and mixed banks’ (42.88 per cent of SCOB20 and 36.24 per cent of all-shares), whereas the smallest sector in SCOB20 (coal mining) had only 1.5 per cent of SCOB20, while it made up 9.5 per cent of the all-shares composition. Clearly, there are differences, and formally testing demonstrates that the following industries are significantly differently represented (at the 1 per cent level) in both indices: banks, holdings and mixed banks (t = 4.93), steel and non-ferrous metals (t = 5.45), coal mining (t = −7.25), and transport (t = −2.72). Only the chemicals, electricity and oil industry (t = −0.70) is not different between the indices. However, since asset pricing does not recognise industries as significant priced factors, we still might be able to ignore these differences and compute risk and return measures on the limited index to proxy for the market.
Differences in sector composition between SCOB20 and all shares (percentage of market cap)

Source: SCOB database. Version 2008.05.
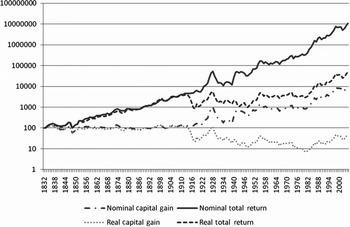
Since we cover a period of over a century, with numerous upswings and downswings of the business cycle, we focus on real returns in the discussion. Figure 6 displays the logarithmic capital gain and total return indices both in real and nominal terms. From the nineteenth century up to World War I, the nominal and real return indices virtually coincide. Inflation years and deflation years balanced each other out and kept the general price level stable. After World War I inflation became a prominent factor, as Figure 7 shows. It can also be noted that the difference between the real capital gain index and the total real return index grows continuously in the nineteenth century, indicating the importance of dividends (see Figure 8).
Logarithmic capital gain and total return indices (nominal and real terms)

Belgian CPI index (left scale) and inflation rates (right scale)

Nominal and real dividends

Over the whole period (1833–2005), the Belgian market realised a real total (geometric) return of 3.59 per cent per annum (see Table 2 above). For the SCOB20 data the total (geometric) return was 3.63 per cent. A t-test corrected for heteroskedasticity and autocorrelation does not allow rejecting the null hypothesis that the average return on the SCOB20 index equals the all-shares return over the period 1833–2005 at conventional levels of significance.
Focusing on various decades, large variability is clearly present. Real returns for the all-shares index vary between −11.15 per cent and 14.95 per cent. Three decades record a negative return: 1910–20, 1941–50 and 1971–80. Especially during the 1980s and 1990s, equity investors realised extremely positive returns. Based on the SCOB20, the quoted numbers change only marginally and the same bull and bear segments are identified. Moreover, the correlation between the 10-year geometric means of the all-shares index and the SCOB20 is 98 per cent.
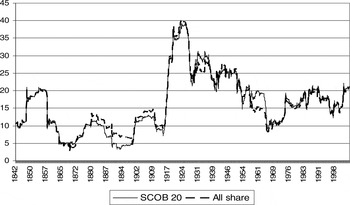
The annualised volatility for the overall period was 19.01 per cent for the all-shares index and 19.24 per cent for the SCOB20 index, and although it changed considerably over shorter time periods, the differences between standard deviations for the two indices are rather small. To evaluate their equality we used the Levene test. It is based on the analysis of variance of the absolute difference from the mean, as we know that returns are not normally distributed (making the traditional F-test less reliable). The resulting statistic for the Levene test has a p-value of 0.12, which does not allow us to reject the null hypothesis that the variances are equal at conventional significance levels. This is in line with our result on the total returns data and is further confirmed by the correlation between the two time series, which is extremely high (0.97). The two time series of 10-year volatilities (see Table 2) have a 98 per cent correlation. Even when we take smaller windows of economic volatility, the similarity is remarkable (see Figure 9).
Volatility (10-year (monthly) moving average) (1833–2005)

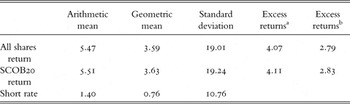
The equity premium measures the extra return above the (risk-free) short rate, and is one of the most widely used (and important) numbers in finance, with several applications (Salomons Reference Salomons2008, pp. 299–329; DeLong and Magin Reference Delong and Magin2009, pp. 193–208). In the long run, the equity premium was nearly identical for both indices (Table 5) and the t-statistic (−0.69) on the (monthly) difference of −0.016 between both equity premia indicates that we cannot reject the null that they are equal. (The compilation of the Belgian short rate series is explained in Appendix 1.)
A (geometric) excess return of about 2.8 per cent (4 per cent arithmetic mean) may appear low compared to American data, e.g. in Ibbotson, reporting an equity premium of 8.5 per cent (arithmetic) or 6.7 (geometric) (Ibbotson Associates 2006). Several other studies also report evidence of a substantial equity premium, although there is a wide difference even when reporting data on the same country (Fernandez Reference Fernandez2007). Interestingly, employing their new NYSE database for 1815–1925, Goetzmann, Ibbotson and Peng find an equity premium for 1815–1925 of only 3.76 per cent (arithmetic, compared to bonds) (Goetzmann et al. Reference Goetzmann, Ibbotson and Peng2001, pp. 1–32). Le Bris and Hautcoeur calculate returns and equity premia for the Paris Stock Exchange (1854–2007) (indices constructed in a way comparable to the present-day CAC40) (Le Bris and Hautcoeur Reference Le Bris and Hautcoeur2010). The arithmetic (geometric) equity premium they find is 3.45 per cent (1.98 per cent) for the period 1854–2006. The corresponding 1951–2000 values are 4.72 and 2.09 per cent. Dimson, Marsh and Staunton (Reference Dimson, Marsh and Staunton2002) calculate equity premia for 17 countries for the twentieth century. They report arithmetic equity premia of 6.14, 9.07 and 9.84 per cent for the UK, Germany and Japan, respectively, with corresponding geometrical values of 4.43, 3.83 and 6.67 per cent. Undoubtedly, the higher equity premium found in post-1926 US data is due to the exceptional situation the US was in. After World War I, and even more after World War II, it became increasingly obvious that the US would develop into the dominant economic power. To the extent that this was unanticipated, the ex post equity premium overestimates the expected risk premium. Corroborating evidence for this interpretation is found using UK data. For the period 1825–70, Turner finds extremely high returns (and correspondingly high equity premia) for the UK. In contrast, by linking the Grossman (Reference Grossman2002, pp. 121–46) and Acheson et al. (Reference Acheson, Hickson, Turner and Ye2009, pp. 1106–36) data, Ye and Turner (Reference Ye and Turner2010) find a premium of 3.24 per cent for the period 1825–1913 for the UK, which is clearly much lower and more comparable to our estimates for Belgium.
The equity premium for SCOB20 and all shares real data (1833–2005)

aExcess return (stocks compared to short rate) based on arithmetic mean, R_equity-R_risk free rate.
bExcess return (stocks compared to short rate) based on geometric mean. Excess returns are calculated as (1 + R_equity)/(1 + R_risk free rate) − 1.
Source: SCOB database. Version 2008.05.
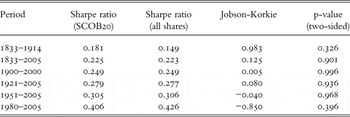
Finally, we compare the Sharpe ratios (Sharpe Reference Sharpe1994, pp. 49–58). The Sharpe ratio or reward-to-variability ratio is a widely used portfolio performance measure. We estimate it by dividing the sample arithmetic average excess return by the standard deviation of excess returns. The Sharpe ratio also varies considerably over time, but produces nearly identical results for the all-shares and the SCOB20 data in all subperiods (Table 6). Summarised over large periods Sharpe ratios (on an annual basis) vary between 0.14 and 0.42 for the all-shares data and between 0.18 and 0.40 for the SCOB20 data (see Table 6).
Sharpe ratios and corresponding Jobson-Korkie (and p values) (annual data) for SCOB20 data and all shares data

Note: A negative value of the Jobson-Korkie statistic indicates all shares outperform SCOB20, a positive value indicates SCOB20 is outperforming all shares. The Jobson-Korkie z statistic is asymptotically standard normally distributed.
Source: SCOB database. Version 2008.05.
To test for differences between these Sharpe ratios of the series, we use the corrected Jobson–Korkie pair-wise test of the equality of Sharpe ratios (Memmel Reference Memmel2003, pp. 21–3). Under the null hypothesis that the Sharpe ratios of two portfolios are equal, the test statistic asymptotically follows a standard normal distribution (with zero mean and a unit standard deviation for large samples). The test statistic for our series is very low (see Table 6) and the null hypothesis cannot be rejected.
These results show that both series approximate each other, notwithstanding the significantly different sector composition (see above). One can argue, however, that these results could be expected, as the market capitalisation of SCOB20 companies makes up a large part of all-shares companies. To investigate this issue, we performed a second series of tests on the period 1872–1967, when the SCOB20 index made up a relatively small part of the all-shares index. In Figure 5 it can be seen that during this period the SCOB20 companies accounted for less than 60 per cent of total market capitalisation. Repeating our analysis on this period results in similar conclusions: neither from an economic nor from a statistical perspective can we reject the equality of the SCOB20 average return, volatility, dividend yield and Sharpe ratio from their all-shares counterparts. Likewise, the correlation coefficient between the two time series is high (0.905), although somewhat lower than for the 1833–2005 time series.
VI
A final (and conceptually important) problem is delisting bias (CRSP 2001; CRSP 2008; Shumway Reference Shumway1997, pp. 327–40; Shumway and Warther Reference Shumway and Warther1999, pp. 2361–79). Whenever stocks delist, the last stock price on the stock exchange is used to calculate returns. However, if delisting results from bankruptcy, returns will be too high (as the latest stock price will never be zero). This calls for an adjustment of the final returns in cases of bankruptcy. Such adjustment will not be the same for the all-shares index and SCOB20 index. As SCOB20 data reflect the largest firms, they have arguably a lower propensity to fail, whereas small companies (that are, by definition, comprised in the all-shares index) have a higher default probability, so the delisting bias will not affect both samples similarly.
For the full period 1832–2005 the total number of stock delistings is 1790. We exclude delistings for which the final liquidation procedure is ongoing, and exclude stocks that are relisted in later years. As in CRSP, delisting returns are defined as the returns on securities after their removal from the stock exchange. Delisting returns are identified by comparing the value of a stock after its delisting with its price on the last day of trading. The value of a stock after the delisting is either an off-exchange price (or even off-exchange bid-ask prices) or the sum of a series of distribution payments.
We deal with delistings in three different ways. In strategy one, we consider the last stock exchange price as the end value of a stock, regardless of the delisting reason. This is the usual way in which most indices are calculated and it will introduce a delisting bias if the delisting value is different from the last trading price. In strategy two, we take the last stock exchange price as the end value of a stock in all cases except those where the delisting value is known to be zero (345 delistings, 19.21 per cent of all delistings). For these cases, we assume a delisting return of -100 per cent. In strategy three, we also assume a delisting return of -100 per cent (instead of the -30 per cent single replacement value of Shumway Reference Shumway1997) for stocks that delist for unknown reasons (139 delistings, 7.77 per cent of all delistings). Most of these stocks are likely to have a delisting value of zero. If they have a non-zero value, our procedure will introduce a negative bias.
The effects of the three ways of dealing with delistings on the overall results are minor, even in the case of strategy three. As this strategy implies a correction that is overall too strong (as not every delisting for which there is no information has zero value), it provides an upper limit to the correction for the delisting bias. In period 1872–2005, e.g. strategies one and two give a difference in return of only 0.02 per cent; if we compare strategies one and three the difference is only 0.05 per cent. This is in line with the results of CRSP. There is no change in the return for the SCOB20. The reason is obvious, as the constituent firms were large companies that very rarely went bankrupt because they were excluded from the SCOB20 before the final delisting.
The small effect of delistings on overall returns is probably due to two elements: (a) the rather limited number of delistings; (b) the observation that, if a stock is delisted, almost always a sharp drop in prices could be observed in the months before delisting.
VII
In this article we have introduced new return indices for the BSE over the years 1832–2005. We constructed these indices using monthly returns for all Belgian-based companies that at any point in time were listed on the BSE. The individual returns were averaged using market-capitalisation weights, thus obtaining a market value-weighted all-shares return index and a return index for the 20 largest stocks. We documented their risk and return characteristics over the entire period, as well as over several subperiods. We confirm that the dividend component in stock returns is of utmost importance to obtain accurate estimates for the total realised return on equity investments. Particularly during the period before World War I, this return component captures the bulk of total equity return, leaving hardly anything for the capital appreciation component.
By comparing the SCOB20 index returns to the all-shares return index, we showed that accurate performance estimates can be made based on limited data. Both returns are highly correlated. Moreover, both indices produce similar average return and risk estimates and their dividend yields are almost identical. For 1833–2005, a real total (geometric) return of 3.59 per cent per annum was realised by the all-shares index, whereas for the SCOB20 the total (geometric) return was 3.63 per cent; standard deviations were, respectively, 19.01 and 19.24 per cent. Our finding that it is possible to mimic the return on the overall stock market with a limited number of stocks provides evidence that only a small number of (the largest) stocks is needed to get a diversified (market cap-weighted) portfolio.
Appendix 1: The Belgian short-term interest rate
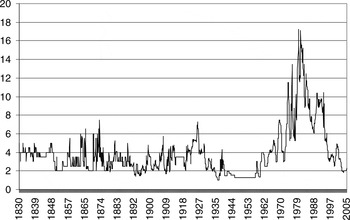
The short-term interest rate (Figure A1) was calculated based on the commercial paper (1833–1940) and T-bill rates (1940–2005). The commercial paper rates for 1832–1918 comes from the official quotation lists of the Antwerp Stock Exchange (where it was published on a daily basis until 1883) and from the newspapers Journal du Commerce d'Anvers, L'Avenir, Moniteur des Intérêts Matériels and Het Handelsblad. For the period 1919–40, we took data on the commercial paper rate from the National Bank of Belgium (1929, pp. 1–85; 1919–90). From 1940 onwards we used T-bill rates, compiled from Vanheurck (Reference Vanheurck1954, pp. 401–39) spanning 1940–5, and Baudhuin (Reference Baudhuin1958, p. 127) and Homer and Sylla (Homer and Sylla Reference Homer and Sylla1991, pp. 498–501) for the period 1945–57. For the period 1957–2005, the data come from the National Bank of Belgium (1929–90) and the financial newspaper Financieel-Economische Tijd and De Tijd (1991–2005). Publications on the short rate for Belgium are sparse; until now there has never been published one long-term series for Belgium on the short rate. A publication by a Belgian bank (Generale Bank 1992, pp. 1–8, 11–16) includes some graphs using the official discount rate as well as T-bills (from 1957 on).
The Belgian short-term interest rate (1830–2005)

Although T-bills were issued from 1833 (Nicolai Reference Nicolai1921) and their data are available until 1926 (Gérard Reference Gérard1928, pp. 215–48), the rate did not move very much, indicating it probably did not reflect the evolution of the money market very well. No T-bills were issued between 1926 and 1937. The rate on commercial paper (taux hors banque) was recognised by experts at the time, such as Léon Dupriez, a leading Belgian scholar (Dupriez Reference Dupriez1930, p. 124; Vanes Reference Vanes1967, pp. 342–79; IRES 1957, pp. 75–122), as being the best rate for the money market in the absence of T-bills.