Introduction
Research on advanced catalysts for electrochemical processes, particularly relevant to energy and the environment, is currently attracting increasing attention in various science and technology disciplines. Understanding and facilitating the charge-transfer kinetics at heterogeneous interfaces are the predominate strategy to advance electrochemical catalyst design and performance.
Piezotronics is an emerging concept to tune the charge separation and transport properties at heterojunctions.Reference Wang, Zhou, Song, Liu, Xu and Wang1–Reference Wang3 The core of piezotronics lies in the coupling between electrical polarizations and the internal electric field formed at the heterojunction interfaces.Reference Wu and Wang4–Reference Wang6 The unique band-tuning ability of the piezotronic effect provides a revolutionary paradigm to exceed the performance cap in many electrochemical systems.Reference Starr and Wang7 As electrochemical catalysis is sensitive to the electronic band structure at the solid–liquid interface, introducing an additional polarization to that interface can help manipulate the interfacial energy landscape, and thereby modulate the catalytic performance. Such a unique coupling opens a promising application direction for piezotronics leading a new route toward ultimate performance gain of electrochemical catalysis.
Piezotronics modulation can be implemented by using strained piezoelectric materials or the permanent polarization of ferroelectric materials, both of which are generally treated as surface polarization in this article. The operational conditions of piezotronics are not restricted by other factors, such as with or without light or an external bias. All of these conditions are discussed here. In addition, the piezoelectric polarization can be directly used as an exclusive driving force to catalyze electrochemical reactions—this has been called piezocatalysis, a new concept in energy transformation and catalysis.Reference Starr, Shi and Wang8
Piezoelectric polarization—Influence on near-surface energetics
Charged oxide surfaces support subsurface space-charge layers that can enhance the separation of photogenerated carriers and thereby reduce recombination losses. Beyond the trivial solution of polarizing the oxides with an external bias, there are two mechanisms for creating charged oxide surfaces. The first is to alter the pH of the solution that is in contact with the oxide surface.Reference Guo, Siretanu, Zhang, Mei, Li, Mugele, Huang and Mul9,Reference Song, Salvador and Rohrer10 This uniformly changes the charge state on the surface, similar to an external bias, and can be used with samples of any form factor. The second mechanism is to select materials that naturally have charged domains on their surfaces because of their crystallography or microstructure.
There are three types of complex oxides that intrinsically have charged surface domains. The first type is comprised of crystals with noncentrosymmetric structures that exhibit polar behavior. This includes piezoelectric materials such as ZnOReference Shi, Starr, Xiang, Hara, Anderson, Seo, Ma and Wang11 and tourmaline (a boron silicate mineral),Reference Yeredla and Xu12 and ferroelectrics such as BiFeO3,Reference Schultz, Zhang, Salvador and Rohrer13 BaTiO3 (BTO),Reference Giocondi and Rohrer14 and lead zirconate titanate (PZT).Reference Dunn, Jones and Gallardo15 Polar materials have a fixed polarization throughout their volume that creates uncompensated charge at the surface. When a ferroelectric material is cooled below its Curie temperature, a rich microstructure of ferroelectric domains is created such that at the surface, regions with uncompensated positive and negative charge develop.
The second type of these materials is ferroelastics, which also have a domain structure, such as WO3Reference Pisat, Rohrer and Salvador16 and BiVO4.Reference Munprom, Salvador and Rohrer17 While these materials do not have polarity in the bulk, they exhibit polarity at the surface, likely from the flexoelectric effect. The third type of complex oxides that have charged surfaces are those whose crystal structures create charged surface terminations. For example, cubic perovskite-structured SrTiO3 (STO) consists of alternating layers of Ti4+ and (SrO3)4– along 〈111〉. A (111) surface will therefore have a positive or negative charge.
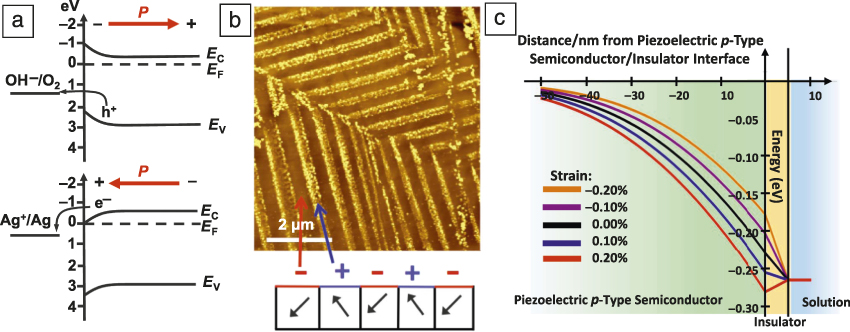
In practice, the surface is composed of domains of positive and negative charge separated by surface steps. When the surface is made of oppositely charged regions (from any of the previously mentioned sources), the subsurface band bending will differ in each region (Figure 1a), leading, for instance, to relatively photoanodic and photocathodic areas and selective electrochemical deposition (Figure 1b).Reference Giocondi and Rohrer18 Of the three types of oxides previously discussed with charged surface domains, those that have charge arising from the termination layer are the most practical to control because they can be easily adjusted through chemical treatments.Reference Zhu, Salvador and Rohrer19
Surface polarization and the influence on interfacial band structure. (a) Schematic energy-level diagrams for BaTiO3 in contact with a solution showing surface polarization-determined photochemical reactions (top: water oxidation; bottom: Ag+ reduction). (b) Topographic atomic force micrographs of ferroelectric BaTiO3 surfaces after the photochemical reduction of silver. The surface has photocathodic domains (bright contrast) that reduce Ag+ from an aqueous solution and photoanodic domains (dark contrast) that do not. The rise of surface charges is illustrated by the schematic below the images.Reference Giocondi and Rohrer18 (c) Calculated electrical potential profiles at a piezoelectric p-type semiconductor/insulator/solution heterojunction. The interfacial electronic band structure can be effectively tuned by straining a piezoelectric semiconductor.Reference German, Starr and Wang25 Note: p, polarization; E C, conduction band energy; E F, Fermi energy; E V, valence band energy.

One important criterion for a photocatalyst used in aqueous solutions (e.g., water splitting) is long-term stability. The main strategy that has been used to protect surface charges on photocatalysts is to deposit a thin layer of TiO2 on the surface. TiO2 has excellent stability in aqueous solutions and preserves the charge at the interface between the oxide and titania overlayer. For example, pulsed laser deposition (PLD) deposited TiO2 has been shown to stabilize the buried charge at interfaces with BaTiO3,Reference Burbure, Salvador and Rohrer20 BiFeO3,Reference Zhang, Schultz, Salvador and Rohrer21 and SrTiO3.Reference Zhu, Salvador and Rohrer22 More importantly, sol-gel-deposited titania layers have been used to stabilize charge at buried interfaces with BaTiO3Reference Li, Rohrer and Salvador23 and PbTiO3Reference Li, Zhang, Schultz, Liu, Salvador and Rohrer24 particulate catalysts, illustrating a practical path to scalable production of such heterostructured catalysts.
Alteration of surface charge will directly impact the near-surface electron-energy landscape (e.g., barrier height and depletion width), which in turn influences the interfacial charge exchange behavior (i.e., electrochemical processes). Quantification of the interfacial electronic band diagram is therefore essential to conceive a clear picture of piezotronics modulations in electrochemical catalysis. The Poisson’s equation is typically used for such quantification on the basis of equal interface potential and neutralized interfacial charges.Reference German, Starr and Wang25 In an electrochemical system, the semiconductor–liquid interface plays the most significant role in performance control. In addition, insulating layers, such as a surface protection layer or a catalyst layer, are often involved, which can impose additional influences on the interfacial charge balance and electronic-band alignment. Therefore, quantification of piezotronic regulation necessitates considering the influences of the solution’s pH, the isoelectric point (pHiso, the pH at which there is a net zero charge on the surface) of the solution-facing material, the insulating layer’s permittivity (εins), and the surface charge induced by the semiconductor.
Figure 1c illustrates calculated electric potential profiles across a semiconductor/insulator/solution heterojunction and compares how the potential is influenced by other factors. The amount of charge accumulation (or depletion) in the semiconductor increases with an increase in the difference between pH and pHiso, as well as with an increase in the value of εins. While this calculation is based on piezoelectric ZnO, significant polarization tuning can be expected if the semiconductor is replaced by high-performance piezoelectric or ferroelectric materials, such as PZT. In most practical electrochemical systems, the piezoelectric surface charge could induce band bending on the order of tens to hundreds of meV, which may introduce significant electrochemical performance variation. Based on the electrochemical system used, and the physical limits of the materials used therein, one may exploit different pathways of manipulating these variables to optimize the device performance by implementing the piezotronic effect.
Effects of piezoelectric polarization on photochemical reaction rates
Two of the principal losses associated with photochemical reactions are the recombination of the photogenerated carriers and the back reactions of intermediate species. Charged surfaces can ameliorate both of these losses. First, the subsurface space charges below differently charged domains move electrons and holes in opposite directions so they are less likely to recombine. Second, the photocathodic and photoanodic half reactions take place on different surface domains and make the recombination of intermediate species less likely.
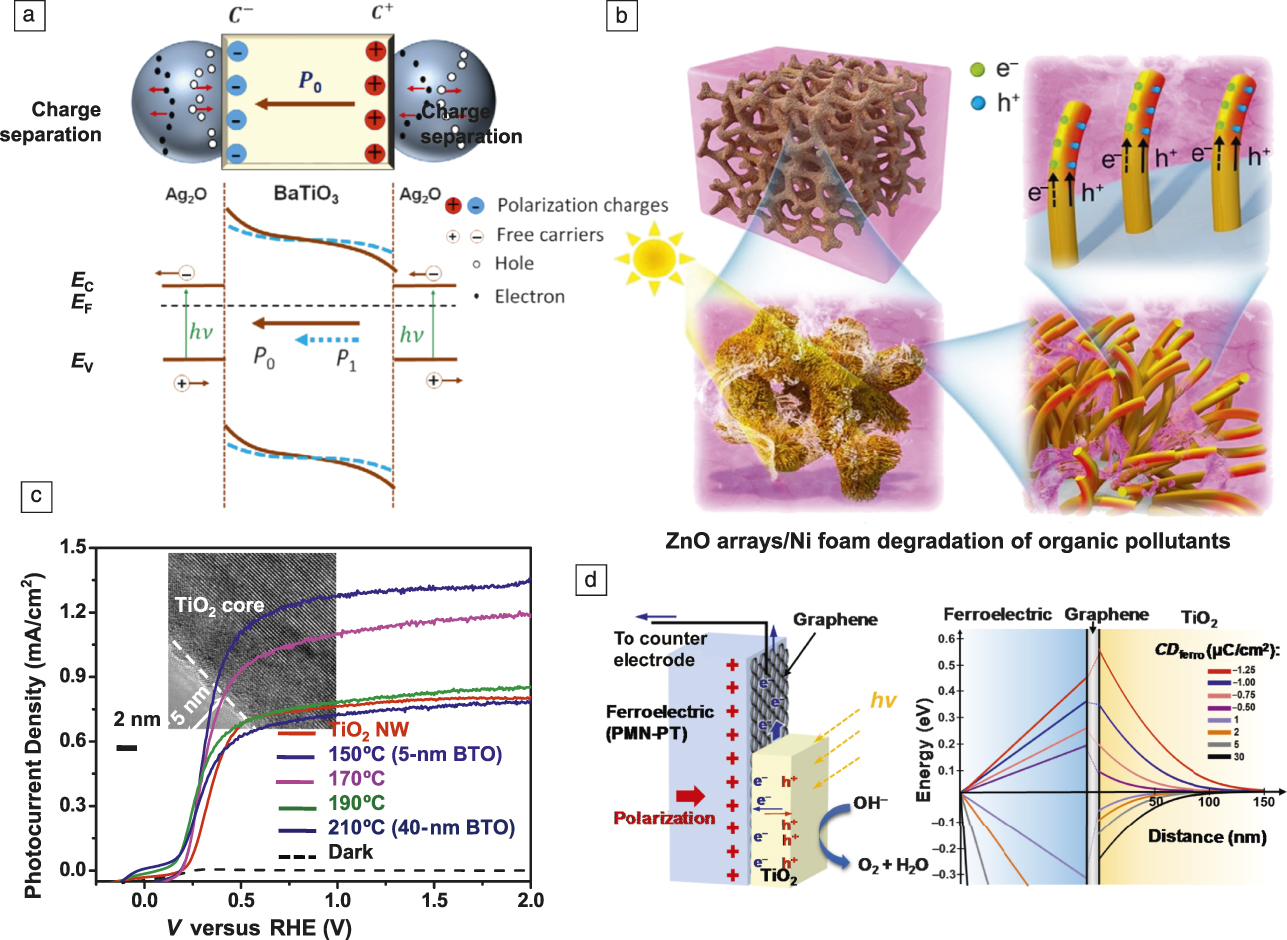
Evidence from experiments and simulations for the influence of charged surfaces on charge-carrier dynamics and photochemical reaction rates is abundant.Reference Kakekhani, Ismail-Beigi and Altman26–Reference Tiwari and Dunn29 For example, it has been reported that the charge-carrier lifetime in BaTiO3 in the ferroelectric state is 104 times larger than in the nonferroelectric state.Reference Morris, Pendlebury, Hong, Dunn and Durrant30 Simulations have shown that charge carriers are separated by charged surface domains, so that photogenerated carriers driven away from the surface in one domain can be collected at the surface of the neighboring domain and participate in surface reactivity rather than recombining.Reference Glickstein, Salvador and Rohrer31 Experiments comparing the photochemical reactivity of similar samples with and without charged surface domains have also concluded that the ferroelastic samples were more reactive.Reference Munprom, Salvador and Rohrer32 Studies of BaTiO3 powders with varying degrees of the tetragonal ferroelectric phase have shown that powders with more of the ferroelectric phase have the highest reactivity.Reference Cui, Briscoe and Dunn33 The surface-polarization-enhanced photocatalysts can be further improved by applying additional strain to the ferroelectrics. In a Ag2O-BaTiO3 hybrid photocatalyst, applying ultrasonic waves generated an alternating internal electric field, thereby facilitating the separation of photoinduced charges and providing a significant performance gain to the photocatalytic activity (Figure 2a).Reference Li, Sang, Chang, Huang, Zhang, Yang, Jiang, Liu and Wang34
Piezotronics modulation on photoelectrochemical (PEC) processes. (a, upper) The separation of electrons and holes in Ag2O nanoparticles attached to the two opposite surfaces of a BaTiO3 (BTO) nanoparticle that have opposite polarization charges due to the piezoelectric effect and (lower) the corresponding tilting in the bands.Reference Li, Sang, Chang, Huang, Zhang, Yang, Jiang, Liu and Wang34 (b) Synergetic effects between the piezoelectric field and photocatalysis of ZnO nanorod arrays/Ni foam. Top left: ZnO nanorods on 3D Ni foam. Bottom left: This 3D structure is under light illumination. Bottom right: Turbulence and eddies created at the ZnO/Ni interface by stirring the solution, which deforms the ZnO nanorods and generates a piezoelectric field. Top right: The piezoelectric field promotes separation of photogenerated electrons and holes, leading to enhanced photocatalytic activity.Reference Chen, Liu, Feng, Wang, Bian, Li and Wang36 (c) Positive ferroelectric polarization in BTO can largely enhance the PEC performance of TiO2 photoanodes. The plot shows the J ph-V curves of TiO2/BTO core–shell nanowire photoanodes. Inset is a high-resolution transmission electron microscope image showing the TiO2/BTO interface.Reference Yang, Yu, Starr, Yin, Li, Kvit, Wang, Zhao and Wang38 (d) Graphene charge collector has negligible influence on the electronic energy level shifting in the TiO2 photoanode. Left panel schematically shows the PMN-PT/graphene/TiO2 heterojunction for the piezotronic PEC setup; right panel is the calculated interfacial electronic energy level when the graphene layer was assumed to have a charge density of 1–10 × 1012 cm2 and the ferroelectric polarization was held constant at 15 μC/cm2.Reference Chen, German, Bong, Yu, Starr, Qin, Ma and Wang41 Note: NW, nanowire; P 0, initial polarization; P 1, polarization after Ag2O attachment; E C, conduction-band energy; E V, valence-band energy; E F, Fermi energy; h, Planck’s constant; ν, frequency; C –, negative surface charge ; C +, positive surface charge; PMN-PT, Pb(Mg1/3Nb2/3)O3-PbTiO3; CD ferro, ferroelectric charge density; V, voltage; RHE, reference hydrogen electrode.

Such strain-based polarization is also often seen in piezoelectric materials, which can arbitrarily switch the direction and intensity of surface polarization and offer more flexible tuning capability. Wurtzite ZnO, owing to its appreciable piezoelectric response and photoactivity, has been studied intensively in this regard.Reference Zhang, Liu, Zhu, Huang, Liu, Hu, Song, He, Liu and Zhai35 Taking into account the potential applications of photocatalysis in cleaning water and air, flow- or wind-driven piezo-promoted photochemical processes offer intriguing application opportunities for piezotronics in environmental engineering.
In a nanocomposite consisting of arrays of vertical ZnO nanorods on a three-dimensional (3D) Ni foam, piezoelectric polarization induced by deformation of the ZnO nanorods was used to separate photoelectrons and holes, promoting photocatalytic activity (Figure 2b).Reference Chen, Liu, Feng, Wang, Bian, Li and Wang36 This piezotronic effect raised the quantum efficiency of the ZnO nanorod–3D Ni foam structure more than 5×, where the enhancement was directly related to the velocity of the water flow in the testing system. Meanwhile, the 3D porous structure could further enhance the piezoelectric effect owing to some small water turbulence on the inner surface of the Ni foam. On the other hand, such a 3D structure is favorable for reactant diffusion and photocharge migration. This work showed that the piezotronic effect can be effectively integrated with other physical or chemical improvement strategies and optimize the performance of many practical photochemical processes.
Effects of piezoelectric polarization on photoelectrochemical performance
When the piezoelectric component is semiconducting, the piezotronic modulation can be further applied to the photoelectrochemical (PEC) process, where an external bias is involved to drive charge separation. In a typical PEC oxygen evolution reaction (OER) or hydrogen evolution reaction (HER), the piezoelectric polarization is able to expedite charge transfer and thus facilitate the catalyst performance. Since electrochemical catalysts are primarily insulators, the interfacial band structures showing the piezotronic influences can be closely represented by Figure 1c. ZnO is often examined as a model system of the piezotronic PEC effect, where the piezoelectric polarization is introduced by straining the electrode. As illustrated by a ZnO/Ni(OH)2 OER system, enhanced photocurrent density (J ph) was obtained under tensile strain, demonstrating enhanced OER activity, while a compressive strain led to a decreased J ph.Reference Li, Yu, Starr, Li and Wang37
Higher interfacial charge density can be introduced by ferroelectric materials, and significant piezotronic modulation can be expected. Since ferroelectric polarization is a spontaneous effect, it does not require an external strain to activate the modulation, making it more applicable for PEC catalytic systems. While charge transfer is still the main concern in this system, the insulating ferroelectric material has to be made with a small thickness (<30 nm) to allow charge tunneling. In this regard, a semiconductor core–ferroelectric shell nanowire (NW) structure is particularly advantageous. As shown by a TiO2/BTO core–shell NW-based photoanode, the PEC performance in 1 M NaOH solution under 1 Sun illumination was raised by 67% compared to pristine TiO2 NWs, when the ferroelectric BTO thickness was only ∼5 nm (Figure 2c).Reference Yang, Yu, Starr, Yin, Li, Kvit, Wang, Zhao and Wang38 The enhancement was attributed to the improved charge-separation efficiency enabled by the ferroelectric polarization. Thicker BTO shells yielded much lower J ph due to the significant increase in film resistance, although higher polarization was introduced. A similar performance gain was also discovered for a ferroelectric poly(vinylidene fluoride-trifluoroethylene) (PVDF-TrFE) thin-film-coated Si photoanode. Under positive poling, the onset potential could be reduced by 80 mV as the ferroelectric dipoles were favorably aligned with the charge-transfer direction, which led to a 110% increase of the saturated J ph.Reference Cui, Xia, Wu, Chen, Li and Sun39
While the piezotronic modulation shows great promise to raise the material’s PEC efficiency, most piezotronic PEC systems still offer relatively low overall efficiency. The key challenge lies in the long-standing contradiction between the dielectric nature of piezoelectric/ferroelectric materials and the high conductivity requirement of a PEC system. Using a more conductive component to support surface charges (e.g., STO) would alleviate the charge-transport problem and allow a thicker layer to be applied, thus higher interfacial polarization.Reference Wu, Yu, Yang, German, Li, Chen, Yang, Huang, Shi, Wang and Wang40 This strategy, however, does not fundamentally resolve the challenge where polarization and charge transport are still coupled. An ultimate solution is to completely circumvent the piezo-/ferroelectric material of charge transport.
A single layer of graphene was recently proposed as a dedicated charge collector in a ferroelectric PEC system (Figure 2d).Reference Chen, German, Bong, Yu, Starr, Qin, Ma and Wang41 In this case, an insulating lead magnesium niobate-lead titanate (PMN-PT) slab with strong polarization was used only for interfacial band-structure tuning. The band-structure change could be well preserved after inserting a graphene layer due to its orders of magnitude lower charge density compared to the ferroelectric polarization. Therefore, the contradictory requirement of conductivity was decoupled, and significant enhancements of both J ph and onset potential were obtained for PEC water splitting under one sun illumination.Reference Chen, German, Bong, Yu, Starr, Qin, Ma and Wang41
Electrochemical reaction enabled by piezoelectric polarization
Given the strong capability of inducing electronic-band shifting, piezoelectric polarization can provide the electrochemical driving force for the reaction through transformation of mechanical energy. This is known as piezocatalysis.Reference Starr, Shi and Wang8
The fundamental concern of a piezocatalytic process is to couple the piezoelectric potential to the force driving charges across the semiconductor/solution interface, where the accepting or donating of electrical charge from the solution occurs via chemical reactions at the interface. Figure 3a demonstrates a means by which piezoelectric potential is sufficient to create a favorable energetic landscape for generating faradic currents on opposite Au electrode surfaces, promoting both HER and OER in solution.Reference Starr and Wang42 The appearance of a piezoelectric potential induced by mechanical deformation shifts the Fermi level and modifies the electron energy in the Au electrodes. The electrochemical potential differences between the electrode and solution are a driving force for electron transfer across the electrode/solution interface and thus induce electrochemical reactions. Such piezoelectric-potential-enabled electrochemical reactions create faradic currents in the electrolyte and deplete piezoelectric-induced surface charge. Therefore, the piezoelectric potential drops accordingly and eventually the reactions cease when the electron energy levels are no longer energetically favorable for net charge transfer.
(a) Schematic energetic diagram for the occurrence of piezoelectric-potential-driven faradic currents at the piezoelectric/water interface. The piezoelectric potential shifts the electron energy level in the two Au electrodes toward different directions, and the resulting difference in electrochemical potentials between the electrode and the solution serves as the driving force for the redox reactions at Au surfaces.Reference Starr, Shi and Wang8 (b) H2 produced by straining a piezoelectric film in aqueous electrolyte. H2 concentrations measured as a function of oscillating time of the piezoelectric cantilever in de-ionized water with a frequency of 10 Hz (triangles) and 20 Hz (diamonds). A Si cantilever with identical configuration was used as a control (circles).Reference Starr, Shi and Wang8 (c) Schematic piezocatalysis processes at lead zirconate titanate (PZT) nanoparticle surface. Under compression, the piezoelectric material produces an internal electric field to separate free charges. The free charges activate the redox reaction on the surface of piezoelectric material and produce hydroxyl radicals. The hydroxyl radicals help with the decomposition of dye molecules into carbon dioxide and water. Note: V pz, piezoelectric potential;  $V_{{\rm{pz}}}^\prime$, minimal piezoelectric potential for piezocatalytic water splitting; EEL, electric field; E F, Fermi energy; RhB, rhodamine B dye molecule.Reference Feng, Ling, Wang, Xu, Cao, Li and Bian43

In an experimental demonstration, a gold-coated PMN-PT cantilever was used as the piezoelectric component. H2 gas evolution was measured as a function of time during mechanical oscillation of the cantilever in deionized water at given frequencies (Figure 3b). A linearized fit indicates that the rate of H2 concentration increase was ∼0.22 ppb/s at a 10 Hz oscillation rate, which was further raised to ∼0.68 ppb/s at 20 Hz, demonstrating that more straining cycles could result in a higher hydrogen output per unit time. Quantitative analysis revealed that the majority of the piezoelectric potential was consumed by surface capacitive charge. Holding the polarization over one second was found to significantly enlarge the faradic currents and thus improve the piezocatalysis efficiency.
Similar piezocatalysis processes can also be expected from uncoated piezoelectric surfaces. Most piezoelectric materials are wide-bandgap semiconductors or insulators. This requires the valence/conduction bands of the piezoelectric to be higher/lower than the redox energy level of hydrogen/hydroxyl ions.Reference Starr and Wang42 Without including electrodes, the piezocatalysis process can be more conveniently implemented under many different circumstances using nanomaterials. PZT nanoparticles were recently used to investigate the piezocatalysis process via the degradation of dye molecules rhodamine B.Reference Feng, Ling, Wang, Xu, Cao, Li and Bian43 The PZT nanoparticles were doped with a narrow bandgap semiconductor bismuth ferrite to introduce free charges. Mechanical strain was introduced by stirring the solution, and the strain-induced polarization drove internal free charges toward the surface to participate in the redox reactions (Figure 3c). Effective dye molecule degradation was observed within 150 min. This research confirmed a successful piezocatalysis process on exposed piezoelectric surfaces independent of the geometry. In addition, it was found that if only nonmobile polarization was evolved in a strained piezoelectric material, redox reactions may not be activated. Free charges in the piezoelectric material are crucial for piezocatalysis to occur, because it may largely reduce the activation energy to drive charge transfer at the interface.
Conclusion and perspectives
Piezotronics have shown an intriguing ability to manipulate the interfacial energetic landscape of solid/liquid junctions in electrochemical systems. This unique capability promises to surpass the limit of electrochemical catalysis imposed by material chemistry and provides a higher degree of freedom for designing an electrochemical system. At this point, piezotronics-modulated electrochemical catalysis is still in the early stages. To further extend the frontier of this promising research area, many challenges and opportunities still exist. These include well-controlled synthesis of piezoelectric/semiconductor heterostructures with well-engineered interfaces and properties; fundamental understanding of charge dynamics at the interface of piezoelectrics and electrolytes; and overarching knowledge of the piezotronic effect in general electrochemical reactions beyond water splitting. Deep understanding and novel design along these perspectives may eventually make piezotronics a powerful tool for revolutionizing electrochemical catalysis systems.
Acknowledgments
X.W. is grateful for the support of the National Science Foundation (NSF) under Award No. DMR-1709025. G.R. acknowledges support from the NSF under Grant No. DMR 1609369. X.L. acknowledges the support of the National Natural Science Foundation of China (21761142011) and Singapore National Research Foundation under Grant No. NRF2017NRF-NSFC001-007.

Xudong Wang is a professor in the Department of Materials Science and Engineering at the University of Wisconsin–Madison. He received his PhD degree in materials science and engineering from the Georgia Institute of Technology in 2005. His current research interests include understanding the coupling effect between piezoelectric polarization and semiconductor functionalities; developing advanced nanomaterials and nanodevices for mechanical energy harvesting from human activities and ambient environment; and studying the growth mechanisms and developing assembly techniques of oxide nanostructures. He is the author of more than 120 publications and holds more than 10 patents on oxide and piezoelectric materials processing and applications. Wang can be reached by email at xudong.wang@wisc.edu.

Gregory S. Rohrer is the W.W. Mullins Professor of Materials Science and Engineering and head of the Department of Materials Science and Engineering at Carnegie Mellon University. His research focuses on developing structure–property relationships for inorganic materials used in structural, electrical, and catalytic applications. His current research includes crystal growth, surface photochemical reactions, and the relationship between interface properties and the microstructures of ceramics and metals. Rohrer is the author of more than 290 publications, and a Fellow of The American Ceramic Society. He received the W. David Kingery Award from The American Ceramic Society in 2014. Rohrer can be reached by email at gr20@andrew.cmu.edu.

Hexing Li is a professor and president of the Shanghai University of Electric Power, China. He received his PhD degree in physical chemistry from Fudan University, China, in 1998. He is also the director of the Chinese Education Ministry Key Laboratory and the International Joint Laboratory on Resource Chemistry. Li is an associate editor of Applied Catalysis B: Environmental. His research interests focus on photocatalysis for environmental cleaning and catalysis for green chemistry. He has published more than 200 papers and three monographs. Li can be reached by email at HeXing-Li@shnu.edu.cn.