Introduction
The kinetics of gas adsorption in mineral nanopores can significantly affect the transport of those gases in the subsurface (Ho & Webb, Reference Ho and Webb2006). Rapid gas adsorption and diffusion through porous media can be treated as bulk gases in transport models with only minor adjustments to constitutive parameters such as porosity and permeability. However, scenarios involving strong adsorption or slow uptake kinetics requires a molecular-level description of gas-mineral interactions that is not included in most subsurface transport models (Geng et al., Reference Geng, Li, Zitha, Tian, Sheng and Fan2016; Zhang & Sun, Reference Zhang and Sun2019). Such interactions have been shown to strongly affect gas transport in applications ranging from nuclear explosion monitoring (Carrigan et al., Reference Carrigan, Heinle, Hudson, Nitao and Zucca1996; Jordan et al., Reference Jordan, Stauffer, Knight, Rougier and Anderson2015), geologic storage (Bourg et al., Reference Bourg, Beckingham and DePaolo2015; Heinemann et al., Reference Heinemann, Alcalde, Miocic, Hangx, Kallmeyer, Ostertag-Henning, Hassanpouryouzband, Thaysen, Strobel, Schmidt-Hattenberger, Edlmann, Wilkinson, Bentham, Haszeldine, Carbonell and Rudloff2021; Ma & Ranjith, Reference Ma and Ranjith2019; Wendling et al., Reference Wendling, Justinavicius, Sentis, Amaziane, Bond, Calder and Treille2019), energy extraction (Ho & Wang, Reference Ho and Wang2020; Karra et al., Reference Karra, Makedonska, Viswanathan, Painter and Hyman2015; Mohammed & Gadikota, Reference Mohammed and Gadikota2020; Yu et al., Reference Yu, Xu, Fan, Wang and Wu2020), and environmental remediation (Green et al., Reference Green, Luo, Conaway, Haase, Baker and Andraski2019).
Here molecular modeling is used to explore the effect of gas-mineral interactions on the adsorption and transport of noble gas in nanoporous minerals (zeolites) containing one-dimensional (1D) pores. Two naturally abundant zeolites are considered that are endmembers in terms of pore size relative to noble gas diameters. The primary diffusion path in mordenite contains a 12-member ring with a pore diameter much larger than the noble gases (Simoncic & Armbruster, Reference Simoncic and Armbruster2004), while clinoptilolite has smaller cages and a pore-limiting diameter similar in size to noble gases (Jayaraman et al., Reference Jayaraman, Yang, Chinn and Munson2005). A recent experimental study indicated that Xe uptake in clinoptilolite may be reduced due to pore size considerations (Feldman et al., Reference Feldman, Paul, Xu, Rademacher, Wilson and Nenoff2020). The noble gas series (Ar, Kr, Xe, Rn) are used to systematically vary the gas size and gas–zeolite interaction energy. Understanding noble gas migration in the subsurface is also relevant to underground nuclear explosion monitoring (Carrigan et al., Reference Carrigan, Sun and Antoun2022; Neil et al., Reference Neil, Boukhalfa, Xu, Ware, Ortiz, Avendaño, Harp, Broome, Hjelm, Mao, Roback, Brug and Stauffer2022). Importantly, this study includes the effects of water content and temperature on gas uptake.
Recent molecular dynamics (MD) simulations have been used to explore gas transport properties in bulk zeolite models (Hassanzadeh & Sabzi, Reference Hassanzadeh and Sabzi2021; Nagumo et al., Reference Nagumo, Takaba and Nakao2007; Taghdisian et al., Reference Taghdisian, Tasharrofi, Firoozjaie and Hosseinnia2019). In particular, simulations have revealed that gas-sorbent interactions and pore size can significantly reduce gas diffusion relative to that of the bulk gas (Dutta & Bhatia, Reference Dutta and Bhatia2019), and for zeolites in particular (Dutta & Bhatia, Reference Dutta and Bhatia2018). Our simulation systems include bulk zeolites and a slab model consisting of a bulk gas phase in contact with a zeolite slab. Using this dual-model approach, the dynamics of gas adsorption at an external surface and the interior of a zeolite can be studied. Zeolite slab models have been used previously to simulate gas diffusivity at zeolite interfaces (Dutta & Bhatia, Reference Dutta and Bhatia2018; Inzoli et al., Reference Inzoli, Simon and Kjelstrup2009; Slavova et al., Reference Slavova, Sizova and Sizov2020), and water uptake in zeolites (Kroutil et al., Reference Kroutil, Nguyen, Volanek, Kucera, Predota and Vranova2021; Smirnov, Reference Smirnov2017).
Finally, a kinetic model is used to fit the gas loading profiles from the slab simulations. The formalism of this method was based on previous kinetic models of solute uptake in fiber membranes (Wilson, Reference Wilson1948) and gas flow within capillary networks (Barrer, Reference Barrer1949). These models incorporate the kinetics of gas uptake governed by adsorption at the external surface and diffusion in the bulk region. As a result, fitting parameters are used to obtain gas loading at both the external surface and bulk zeolite, as well as diffusivity within the zeolite pore.
Methods
Experimental Measurements
Adsorption isotherms at 273 K and 300 K were measured on a Micromeritics ASAP 2020 surface area analyzer (Norcross, GA, USA). Clinoptilolite, > 97% purity, was purchased from KMI Zeolite, Inc. (Amargosa Valley, NV, USA) and originated in Nevada, USA. The sample was powdered to an average grain size of 76 μm. A water circulation bath was used to maintain the constant temperature of 300 K for the sample tube. A mixture of ice and water was used to achieve 273 K in the analytical bath. Before each measurement, the powders were degassed and vacuumed for a minimum of 4 h at room temperature. The measurement consisted of sequential quantification of adsorbed gas as a function of pressure up to 1 bar. Adsorption equilibrium was assumed when the differences from consecutive pressure readings were within 5% or 5 torr, whichever was smaller. Typically, the time between successive pressure readings were set at 10 s. An additional measurement for Kr at 300 K with successive readings set at 1000 s was made to determine if adsorption equilibrium had been achieved.
Bulk Zeolites
Classical grand canonical Monte Carlo (GCMC) and molecular dynamics (MD) simulations were performed on bulk zeolite models for hydrated clinoptilolite and mordenite. Model systems were prepared from the published structures (Simoncic & Armbruster, Reference Simoncic and Armbruster2004; Smyth et al., Reference Smyth, Spaid and Bish1990) corresponding to three hydration states: fully hydrated, partially hydrated (half of the waters removed), and dry (all waters removed). Cation and water (oxygen) positions from the published structures were used in the initial configurations of the simulation models.
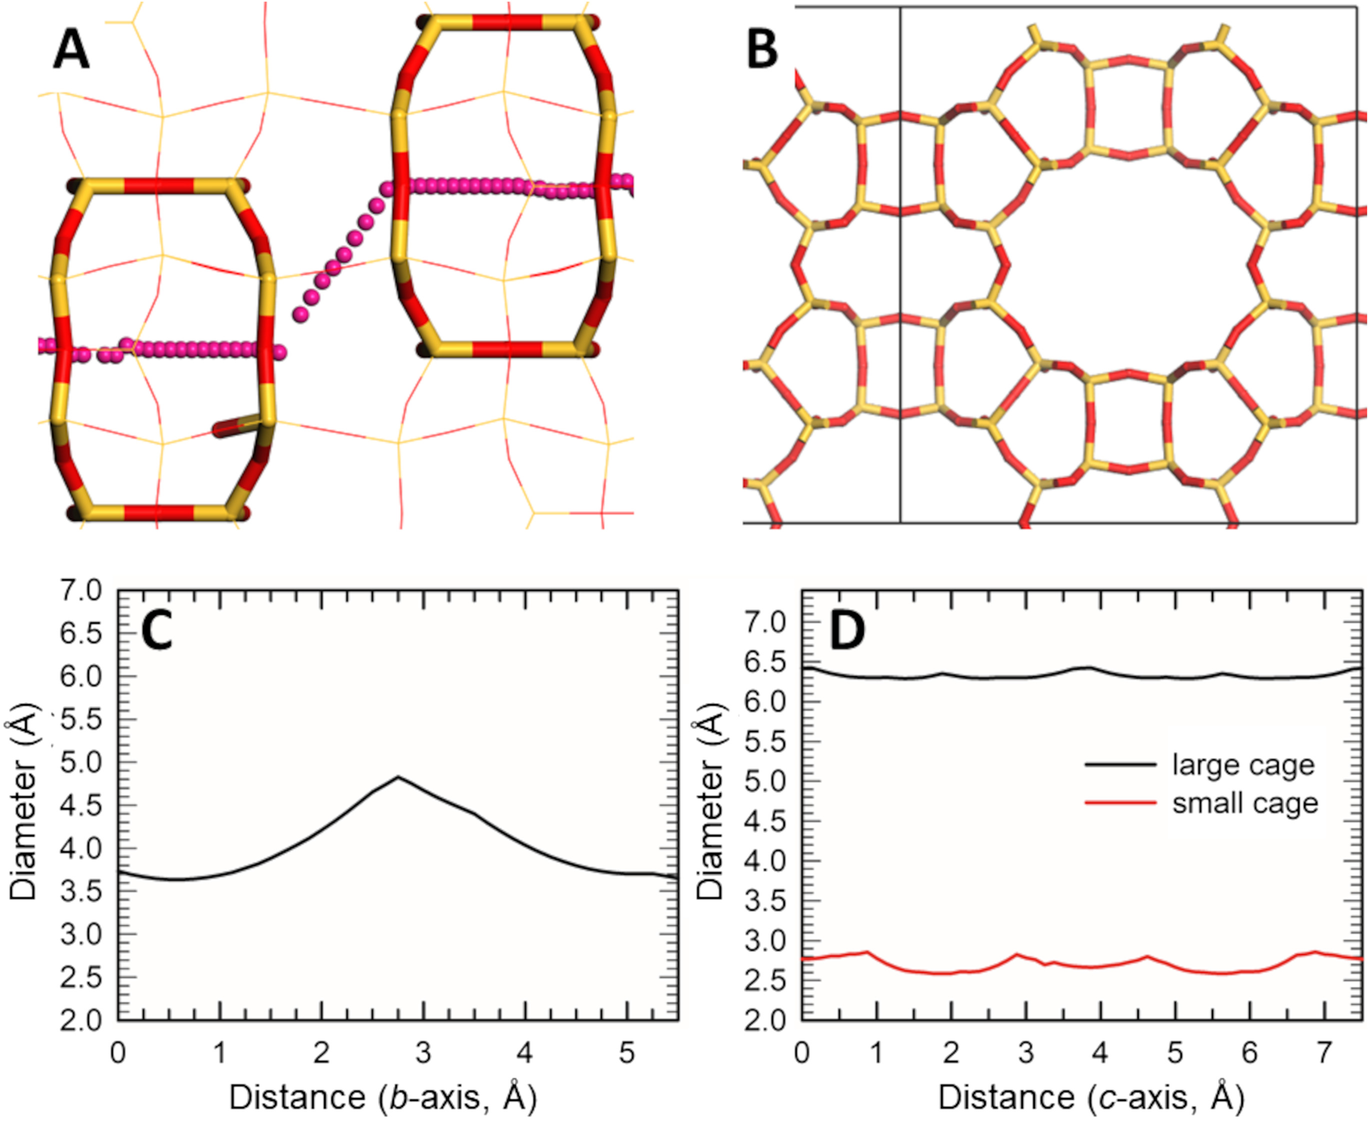
The clinoptilolite model contains the same number of Na+, K+, and Ca2+, corresponding to the chemical formula (Ca,Na,K)6Al6Si30O70⋅24H2O (Smyth et al., Reference Smyth, Spaid and Bish1990). The C2/m unit cell was orthogonalized with the crystallographic b and c axes aligned with z and x, respectively. A 4 × 2 × 2 supercell was created with xyz dimensions 29.60 Å × 31.59 Å × 35.88 Å. Water contents for fully hydrated and partially hydrated clinoptilolite models were 15.5 wt. % and 7.6 wt. %, respectively. Cross-section models of the a and c axes and the corresponding pore size distributions are shown in Fig. 1. The a-pore is very irregular with several local minima at diameters <3.0 Å, corresponding to windows connecting adjacent cages. This implies a high diffusion barrier for all gases in this direction. There are two pores along the c-direction, each with a minimum pore size of ~3.3 Å. This also suggests a high diffusion barrier, even for Ar which has a slightly larger kinetic diameter of 3.4 Å (Li et al., Reference Li, Kuppler and Zhou2009).
Models of the silicate framework for clinoptilolite (Si = yellow, O = red) showing pores parallel to the (A) a and (B) c axes. Pore size profile from the HOLE program (Smart et al., Reference Smart, Neduvelil, Wang, Wallace and Sansom1996) along the (C) a and (D) c axes. Extra-framework cations have been removed for clarity

The mordenite unit cell is orthorhombic with cation sites occupied by Na+ corresponding to the synthetic sample with chemical formula Na6Al6Si42O96⋅28H2O (Simoncic & Armbruster, Reference Simoncic and Armbruster2004). A 2 × 1 × 3 supercell was created with xyz dimensions 36.02 Å × 20.51 Å × 22.57 Å. Water contents for the fully hydrated and partially hydrated mordenite models were 11.1 wt. % and wt. 5.7%, respectively. The pore structure in mordenite (Fig. 2) indicates that diffusion in the b-direction requires a zig-zag path between cages, with a minimum pore diameter of 3.6 Å at the cage window. Two pores exist along the c-direction, but only the larger pore is accessible to the gases. In fact, gas transport through mordenite is thought to occur through the large c-pore (Viswanadham & Kumar, Reference Viswanadham and Kumar2006), which has a consistent pore diameter of 6.5 Å.
Stick models of the silicate framework for mordenite (atoms colored as in Fig. 1) showing pores parallel to the (A) b and (B) c axes in the bc and ab planes. The pink spheres in A show the diffusion path through two pores parallel to the b axis. The gray lines in B represent the unit cell. Pore size profile from the HOLE program (Smart et al., Reference Smart, Neduvelil, Wang, Wallace and Sansom1996) along the (C) b and (D) c axes. Extra-framework cations have been removed for clarity

All simulations were performed using the LAMMPS code (Thompson et al., Reference Thompson, Aktulga, Berger, Bolintineanu, Brown, Crozier, in’t Veld, Kohlmeyer, Moore, Nguyen, Shan, Stevens, Tranchida, Trott and Plimpton2022) with three-dimensional (3D) periodic boundary conditions at a temperature of 300 K. Forces and potential energies were computed from pairwise atomic interactions based on van der Waals (vdW) and electrostatic terms with a short-range cutoff distance of 10.0 Å. Zeolite framework atoms (Si, Al, O) remained fixed at their crystallographic coordinates throughout the GCMC and bulk MD simulations, but framework flexibility was allowed in the slab MD simulations. Electrostatic interactions between all atoms are based on partial charges with the long-range component computed using a particle-mesh Ewald algorithm (Plimpton et al., Reference Plimpton, Pollock and Stevens1997). Rather than assigning specific sites for tetrahedral Si and Al atoms, a single tetrahedral atom type was used with the atomic charge corresponding to the net negative charge for each zeolite. This approach has been used by Boutin and co-workers to model several charged zeolites (Buttefey et al., Reference Buttefey, Boutin, Mellot-Draznieks and Fuchs2001; Coudert et al., Reference Coudert, Cailliez, Vuilleumier, Fuchs and Boutin2009; Di Lella et al., Reference Di Lella, Desbiens, Boutin, Demachy, Ungerer, Bellat and Fuchs2006; Jeffroy et al., Reference Jeffroy, Boutin and Fuchs2011, Reference Jeffroy, Nieto-Draghi and Boutin2014). There were no vdW interactions between pore species and zeolite Si atoms. The Buckingham potential was used for cation-Ozeolite vdW interactions with parameters taken from previous work (Jeffroy et al., Reference Jeffroy, Nieto-Draghi and Boutin2014, Reference Jeffroy, Nieto-Draghi and Boutin2017). All other vdW interactions were based on the Lennard–Jones potential, with parameters taken from previous work: cation-cation (Jeffroy et al., Reference Jeffroy, Boutin and Fuchs2011, Reference Jeffroy, Nieto-Draghi and Boutin2014), flexible SPC water (Teleman et al., Reference Teleman, Jonsson and Engstrom1987), cation-water (Aqvist, Reference Aqvist1990; Dang, Reference Dang1995), and noble gases (Pellenq & Levitz, Reference Pellenq and Levitz2002; van Loef, Reference van Loef1981). Lorentz-Berthelot combination rules were used to calculate vdW parameters for interactions between unlike atoms. Intramolecular interactions included bond stretch and angle bending terms for SPC water (Teleman et al., Reference Teleman, Jonsson and Engstrom1987) and the zeolites (Jeffroy et al., Reference Jeffroy, Nieto-Draghi and Boutin2014). Silanol (SiOH) groups at zeolite slab terminations were described by the SPC bond stretch term and a Si–O-H angle bending term previously used for silica surfaces (Harvey & Thompson, Reference Harvey and Thompson2015). All potential parameters are included in the Supplementary Information (SI).
Equilibrium configurations of dry and hydrated zeolites were obtained from 1.5-ns constant volume MD simulations with a timestep of 0.5 fs for short-range interactions and 1.0 fs for long-range electrostatic interactions. Noble gas adsorption isotherms were obtained from GCMC simulations, in which gas atoms are randomly inserted into the bulk zeolite model based on acceptance criteria. The initial zeolite configuration was taken from the final MD frame of the corresponding pure dry or hydrated zeolite. Chemical potential values for the noble gases corresponded to pressures ranging from 0.1 atm to ~100 atm as determined from separate pure gas simulations (Perry et al., Reference Perry, Teich-McGoldrick, Meek, Greathouse, Haranczyk and Allendorf2014). Each simulation consisted of 1.5 × 10⁷ steps, where each step involved 20 gas insertion/deletion moves and 10 gas translation moves. Average adsorption loadings were obtained from the final 5 × 10⁶ steps.
Gas mobility in dry and partially wet zeolites was investigated from 10-ns constant-volume MD simulations at fixed gas loadings ranging from 0.4 to 2.3 atoms per unit cell. The actual number of gas atoms in the supercells ranged from 5 to 14, which provided adequate statistics for analysis. Initial configurations were taken from GCMC snapshots with some gas atoms removed to achieve the desired loading. Also, some Ar atoms in the dry mordenite model were moved from the small c-pores to the large c-pores (discussed below), as Ar mobility in the former is severely limited. Based on our analysis of the pore-size profiles (Fig. 2), it is unlikely that any Ar atoms would be able to enter the small c-pores. Specific gas loadings and approximate pressures are given in Tables S1 and S2 of the SI. Framework zeolite atoms (Si and O) remained fixed, but extra-framework cations and gas species were mobile with velocities controlled by a Nosé-Hoover thermostat with a relaxation time of 100 fs.
Zeolite Slabs
Unlike the GCMC simulations described above in which gas species are directly inserted into the bulk zeolite structure, in the slab models the gas species enter the zeolite pores through an external surface. Zeolite surfaces were created by cleaving the bulk crystal from the corresponding pure zeolite MD simulation and converting undercoordinated surface sites to isolated silanol (SiOH) groups. As seen in Fig. 3, the MD models are periodic in the two directions parallel to the surfaces, and nonperiodic in the perpendicular direction. The diffusion pathways (nonperiodic direction) correspond to the c-axis of both clinoptilolite and mordenite, as these channels have the largest pore-limiting diameters in these minerals (Fig. 1 and Fig. 2). Simulations from models oriented along other channels resulted in little or no gas uptake. Expanded supercells were used so that each lateral dimension of the external surface was a least 35 Å. Surface dimensions in the ab planes for slab models were 31.59 Å × 35.88 Å for clinoptilolite (3 × 2 supercell) and 36.02 Å × 41.01 Å for mordenite (2 × 2 supercell). Models were created for dry zeolite with and without extra-framework cations, and partially hydrated zeolite (7.6 wt.% and 5.7 wt.% for clinoptilolite and mordenite, respectively). For zeolite models without extra-framework cation removed, Si and O charges were adjusted to 1.4 e and − 0.7 e, respectively (e is the elementary charge), so that the zeolite framework was charge neutral (i.e., siliceous zeolite).
MD snapshots of krypton gas and A 4.4-nm thick clinoptilolite slab and B 3.8-nm thick mordenite slab with the zeolite c-pores oriented in the horizontal direction. Black lines denote the simulation cell boundaries. Zeolite slabs are represented as stick models with Si and O atoms colored as in Fig. 1. Additional atom colors are as follows: Na = blue, Ca = green, K = purple, H = white, Kr = light blue, and C = gray. Insets show surface SiOH groups

Initial configurations for the two-phase simulations consisted of zeolite slabs with a 50 Å vacuum gap on either side of the zeolite surface. Three slab models were created for clinoptilolite (43.7 Å, 58.6 Å, and 73.8 Å which are equivalent to 6, 8, and 10 unit cells in the c-direction, respectively) to determine the effect of slab thickness on gas adsorption kinetics. A single slab model was created for mordenite (37.9 Å equivalent to 8 unit cells in the c-direction) because all gases rapidly adsorb and diffuse in this zeolite. For single gas simulations, gas atoms were randomly inserted in each vacuum region at low concentration (50 atoms on each side) or high concentration (100 atoms on each side). For mixture gas simulations (Ar/Xe and Kr/Xe), 50 atoms of each gas were randomly inserted on each side. Based on the pure gas properties using the same force field parameters (Perry et al., Reference Perry, Teich-McGoldrick, Meek, Greathouse, Haranczyk and Allendorf2014), these initial gas concentrations correspond to pressures of 15–20 bar (50 atoms on each side) to 30–40 bar (100 atoms on each side). Corresponding gas pressures at the end of each simulation can be obtained by comparing steady-state gas loadings in zeolite slabs with loadings from adsorption isotherms (discussed below). A wall consisting of a single layer of graphite C atoms (Trucano & Chen, Reference Trucano and Chen1975) prevented gas atoms in the two vacuum regions from comingling. The C atoms remained fixed during the simulations, but they interacted with gas atoms via vdW interactions as effective hard spheres (0.0001 kcal⋅mol−1).
Constant volume MD simulations were performed at temperatures of 250 K, 300 K, and 350 K. Separate Nosé-Hoover thermostats were used for the zeolite and gas velocities, each with a relaxation time of 100 fs. Separate thermostats have been used in previous simulation studies of two-phase systems (Inzoli et al., Reference Inzoli, Simon and Kjelstrup2009; Simonnin et al., Reference Simonnin, Marry, Noetinger, Nieto-Draghi and Rotenberg2018), and it was confirmed that the total temperature matched the target temperature. To avoid drift, the center of mass of the zeolite framework was constrained using the ‘fix recenter’ command in LAMMPs. The length of the simulations varied from 40 ns up to 1000 ns depending on how rapidly steady state loading was achieved. For each model system, results were averaged from ten independent simulations with different initial configurations.
Kinetic Models of Diffusion
To estimate both the quantity of the adsorbed gas and the diffusivity in the zeolite, a kinetic model was adapted from earlier works (Barrer, Reference Barrer1949; Crank, Reference Crank1975; Wilson, Reference Wilson1948). Whereas Karger and Ruthven refer to this as the diffusion-immobilization model (Karger & Ruthven, Reference Karger and Ruthven2016), the mathematical solution does not require immobilization but only that the transport diffusivity,
 , is constant and uniform throughout the slab. Here, the transport diffusivity is the product of the Maxwell–Stefan diffusivity and the thermodynamic factor that relates chemical potential to concentration (Krishna, Reference Krishna2012). Let
 be the number density or volumetric mass concentration in the pores that includes no distinction between free and adsorbed particles. Let
 be the distance from the centerline of the slab in the
 -coordinate and
 be the time elapsed in the simulation. Due to the periodicity of the system, the concentration was assumed to be uniform in the
 and
 directions. In this idealized system, the mass balance within the slab is a restatement of Fick’s Second Law in one dimension.


The zeolite slab is initially devoid of the gas; thusly the initial condition is zero concentration throughout the slab (Eq. 2). The first boundary condition (Eq. 3) is the no-flux condition at the centerline
 due to the symmetry of the model. The second boundary condition (Eq. 4) requires the concentration at exterior edges of the slab, that is at distance
 , to be a function
 of the free gas concentration. Due to the lower chemical potential in the slab, the concentration within the slab at equilibrium will be larger than the free gas concentration. To a first approximation, the concentration within the slab pores is related to the concentration in the void by the equilibrium constant
 .
Rather than solving the preceding equation directly for the concentration in the slab, instead this work followed the method proposed by Wilson (Reference Wilson1948) and seeks the total mass of the species within a subset of the slab starting at centerline. Let the linear mass loading function be described as
 .

where
 ’ and
 ’ represent integrals in the a and b coordinates (Fig. 3). Because only a fraction of the slab region consists of the accessible pore volume, but the tallies were conducted over the entire volume, the mass loading function is function of both the pore concentration and the areal porosity
 .
Performing this integral transformation on the earlier differential equations (Eq. 1) results in the similar differential equation but altered boundary conditions:


The second boundary condition (Eq. 9) now relates the
 -derivative of the mass-loading function
 to the free gas concentration
 . An expression for the free gas region concentration was then constructed using the overall mass balance on the system.
In these simulations, the mass loading inside the slab was twice the mass in a singular side; that is
 . Defining the linear extent of the void region as
 , the mass of free gas outside of the slab is twice the free gas concentration and linear extent; that is
 . As recognized by Barrer (Reference Barrer1949), a non-negligible quantity of gas may adsorb as a film on the external surface of the slab. In this work, it was assumed that this surface is saturated and hence constant and independent of the gas concentration in the other regions. Thus, the total mass within the slab and void regions was the total mass of the gas
 minus the mass in the external film
 In doing so, the external boundary condition (Eq. 9) can be replaced with the following:

The solution to this partial differential equation can be concisely written using two parameters to non-dimensionalize the system. Firstly, the capacity ratio
 is the ratio of the capacity of the void versus the adsorptive capacity of the slab:

Secondly, let the kinetic parameter
 be defined as the ratio of the transport diffusivity to the width of the slab squared.

To solve this heterogeneous but constant boundary condition, the solution to the mass-loading function
 was modeled as the summation of the steady-state and transient solutions:

where the steady-state solution is a linear function of the number density at equilibrium
 :

and the transient solution is composed of the general solution, where
 and
 are undetermined coefficients and
 are eigenvalues the satisfy the second mixed boundary condition:

Applying the two boundary conditions requires all
 coefficients to be zero and that the eigenvalues
 satisfy the transcendental equation.

The associated coefficients
 were then found by eigenfunction expansion on the initial condition after subtracting the steady state solution.

Thus, the complete solution for the mass-loading function is:

To determine the values of the parameters
 ,
 , and
 , it is prudent to fit the total mass within the slab, which maximizes the number of particles counted, reducing variance due to discrete fluctuations in the tallies. Having a mass-loading function for the half-slab, the quantity within the tallied region of the simulation is simply twice the mass in the half-slab plus the mass with the thin film on the interface. Let the mass loading function for the tallied region be
 .

To fit this function, a subroutine in MATLAB (v R2021b 9.11.0.1769968) was programmed both to evaluate the first 1000 eigenvalues
 for a given
 , and calculate the time-dependent mass loading for the specified
 and
 . The non-linear least squares parameter estimation routine in MATLAB was utilized to perform the parameter fits. All fitted parameters and their corresponding 95% confidence intervals are reported in the SI.
Series truncation error is small when the non-dimensional time, that is
 , takes on modest values of 0.01 or greater (Crank, Reference Crank1948). However, a problem can arise when the preponderance of adsorption occurs at small values of time. Wilson (Reference Wilson1948) showed that, when the infinite series summation becomes impractical, an alternative representation is more effective. In this small-value time approximation, the system was dominated by a different characteristic timescale
 . That is, early in the process, the quantity entering the slab is independent of slab thickness as few if any particles reach the centerline within the span of the simulation. Consequently, it is not possible to make independent estimates of
 and
 in this regime. The mass loading function using this small-value time approximation is as follows:

In the special case of an infinite reservoir, and hence infinite
 this function appears as the more commonly referenced
 ‘law’. However, for the limited extent of the void region here, this formulation is more necessary. Where the small-value time approximation is necessary, it is not possible to isolate the capacity ratio
 from the kinetic parameter
 , however, the characteristic timescale can, conversely, be calculated from independent estimates from the large-value time formulation, that is Eq. 17. In doing so, results can be compared across all simulations, even where the small-value time approximation is necessary.
Results
Bulk Zeolites
Simulated noble gas adsorption isotherms in dry and partially hydrated zeolites are shown in Fig. 4. All four gases were able to access the larger cages in the dry zeolites with the expected trend of increased loading with increasing gas size (and more attractive gas–zeolite interactions). Based on these simulated isotherms, large Xe/Kr selectivities would be expected for these zeolites, consistent with recent experimental evaluation of other zeolites (Yu et al., Reference Yu, Li, Min, Shang, Tao and Sun2022). These results reflect only the accessible volume and not the kinetics of adsorption or possible diffusion barriers. Simulations were also performed using hypothetical gas particles with the same vdW energy parameter as Rn but with vdW diameters of 5.0 – 7.0 Å (Rn-5, Rn-6, Rn-7). Of these hypothetical gases, only Rn-5 atoms are able to adsorb in clinoptilolite, but at lower loadings than Rn. Atoms with larger diameters of 6.0 Å and 7.0 Å showed no adsorption in clinoptilolite, which is expected as the pore diameter is always <6.0 Å (Fig. 1). All hypothetical gases adsorbed in mordenite, which is somewhat surprising as the maximum pore diameter of 6.5 Å (Fig. 2) is noticeably less than the 7.0 Å hypothetical gas. However, the strong vdW interactions enable the insertion of 7.0-Å gas particles into pores with a maximum vdW diameter of 6.5 Å.
Adsorption isotherms at 300 K from GCMC simulations for clinoptilolite (left column) and mordenite (right column) in dry A–B and partially hydrated C–D conditions. Isotherms for dry zeolites A– B include hypothetical Rn species with vdW diameters of 5.0 Å, 6.0 Å, and 7.0 Å. Uncertainties in gas loadings are <1%

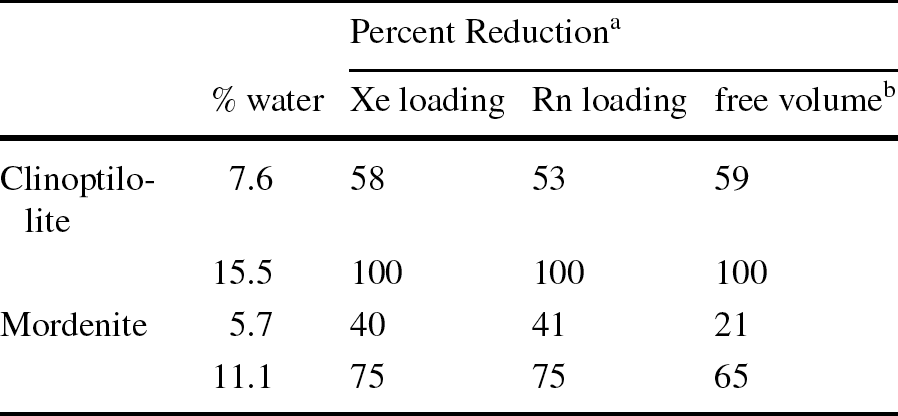
The presence of water in the zeolite pores reduced the accessible volume for gas adsorption (Fig. 4), as quantified in Table 1. At approximately half the saturated water content, the simulation results show that the larger noble gases are still able to adsorb but at reduced loadings (Figs. 4C and 4D). At full water saturation, no gases adsorbed in clinoptilolite, and adsorption in mordenite was again reduced compared to the partially hydrated model (Fig. S1). As both Xe and Rn reached maximum loadings in each zeolite in the dry state, the reduction in maximum loadings can be compared with the reduction in accessible volume when water is present (Table 1).
Percent reduction in simulated gas loading and free volume from GCMC simulations

a Calculated by comparing the gas loading or free volume with the corresponding value from the dry model
b Free volumes were calculated using the Connolly Surface method in BIOVIA Materials Studio (Dassault Systemes)
MD simulations at fixed gas loadings were used to compare trends in gas mobility in the dry and partially hydrated zeolites. Each MD system contained at least five gas atoms to provide adequate sampling during the 10-ns simulations. Ar atoms in dry mordenite were initially placed in large c-pores only, even though some Ar atoms were inserted into the small c-pores during the GCMC simulations. Gas mobility was severely limited in our model systems due to similarity between gas and pore diameters. Instead of performing the simulations at elevated temperatures to obtain diffusion coefficients and activation energies (Slavova et al., Reference Slavova, Sizova and Sizov2020), mean square displacement (MSD) analysis was used to compare trends in gas transport. Maximum MSD values from 10-ns MD simulations are plotted as a function of gas vdW diameter in Fig. 5. Trends of decreasing maximum MSD with increasing gas size indicate that diffusion was limited by steric barriers at windows connecting cages. This is seen for both zeolites in the partially hydrated state and clinoptilolite in the dry state. Gases were significantly more mobile in dry mordenite, with the large c-pore as the primary diffusion path. The three smaller gases (Ar–Xe) had similar maximum MSD values in dry mordenite, indicating similar (barrier-free) transport pathways for these gases. Only the largest gas (Rn) showed limited mobility in dry mordenite.
Trends in gas and water mobility from MD simulations bulk models of A clinoptilolite and B mordenite. Symbols represent the maximum in MSD values from 10-ns MD simulations in either dry or partially hydrated zeolites. Corresponding vdW diameters of each gas are indicated

Gas mobility was significantly hindered in the partially hydrated states of both zeolites, and a general trend is seen of decreasing mobility with increasing gas size. The presence of water serves as an additional barrier to gas movement between cages. Maximum water MSD values are also shown in Fig. 5 and indicate similar water diffusion regardless of gas. Additional details of gas mobility can be seen from plots of MSD time profiles from the simulations (Fig. S2). MSD values of 5 Å2 or less indicate that all gas atoms were trapped in local adsorption sites with no mobility. Examples of this behavior are seen in dry clinoptilolite (Xe), wet clinoptilolite (Kr, Xe), and wet mordenite (Xe). Even for mobile gases, diffusion occurred in discrete jump events associated with movement through narrow windows along a 1D pore. Water molecules in the wet systems exhibited diffusive motion (Fig. S3), although water mobility in clinoptilolite was significantly reduced compared to mordenite. Calculated water self-diffusion coefficients using the Nernst-Einstein relationship (Allen & Tildesley, Reference Allen and Tildesley1987) for clinoptilolite and mordenite were 0.005 × 10⁻⁹ m2⋅s−1 and 0.25 × 10⁻⁹ m2⋅s−1, respectively, which are in good agreement with previous simulation results (Guo et al., Reference Guo, Yu, Gu, Jin, Zhong and Chen2011; Han et al., Reference Han, Bernardi, Wang and Searles2017; Murthy et al., Reference Murthy, Khosravi and Mackinnon2018).
Zeolite Slabs
MD simulations of zeolite slab models were performed to obtain gas loading profiles of each single component noble gas (Ar, Kr, Xe, Rn) and binary mixtures (Ar/Xe, Kr/Xe) at temperatures of 250 K, 300 K, and 350 K. Gas populations were tabulated for three unique regions throughout the simulations, based on the slab models shown in Fig. 3. The ‘gas phase’ regions extended from 5 Å away from the zeolite surfaces to the graphite wall. The ‘interface’ regions extended from 5 Å into the gas phase to 10 Å into the zeolite slab. The ‘bulk zeolite’ region consisted of the remaining zeolite slab (<10 Å from the surface). Results are shown below for high gas loading (100 atoms on each side). Corresponding results for low gas loading (50 atoms on each side) are shown in Figs. S4 and S5. Uncertainties in final gas loadings in the ‘bulk zeolite’ region were calculated from averages of the ten independent simulations. These uncertainties were typically <10% except at very low loadings (<0.02 mmol/g).
Results showing gas loading profiles for the 4.4-nm clinoptilolite slab model (Fig. 6) indicate that the type of gas and the presence of water significantly affected gas loading. Looking first at profiles for the dry model (left column), only the Ar profiles showed steady state loading after 40 ns, with the expected trend of decreased loading with increased temperature. Loading profiles for Kr showed the expected temperature trend but with slower kinetics indicative of hindered access to the bulk region. Steady-state Ar and Kr loadings at 300 K are consistent with the GCMC isotherms at high pressure (Fig. 4).
Results from MD simulations showing gas loading profiles in the ‘bulk zeolite’ region of 4.4 nm clinoptilolite slabs for (left column) dry models, (middle column) dry models without extra-framework cations, and (right column) partially hydrated models. Simulation temperatures are 250 K (blue), 300 K (green), and 350 K (red). Insets show plots at magnified scale

The bulk region of clinoptilolite was essentially inaccessible to the larger gases Xe and Rn. These gases also showed an unusual reverse temperature trend (i.e. increased loading with increasing temperature), indicating that a kinetic barrier exists for adsorption of these gases. Similarity in profiles for the dry models without extra-framework cations (middle column) confirm that adsorption of the larger gases was hindered by pore-limiting windows rather than by the cations. Finally, results for the hydrated clinoptilolite slab (right column) show that water molecules in the pores reduce gas loading and significantly slow the adsorption process.
In contrast, the mordenite c-pores were accessible to all of the gases (Fig. 7). Gas loadings in the bulk zeolite regions reached their steady-state values almost immediately after the simulation began. There was a slight increase in gas loading for the smaller gases when the extra-framework Na+ ions were removed (middle column), and only a slight decrease in loading in the partially hydrated models (right column). Steady-state gas loadings in the dry model correspond to lower pressures from the GCMC isotherms (Fig. 4). Most of the gas atoms were adsorbed, resulting in reduced populations in the ‘bulk gas’ regions.
Results from MD simulations showing gas loading profiles in the ‘bulk zeolite’ region of 3.8 nm mordenite slabs for (left column) dry models, (middle column) dry models without extra-framework cations, and (right column) partially hydrated models. Simulation temperatures are 250 K (blue), 300 K (green), and 350 K (red)

The effect of clinoptilolite slab thickness on gas uptake is shown in Fig. 8. As expected, gradually increasing the slab thickness from 4.4 nm to 7.4 nm (while keeping the initial gas concentration constant) reduced the gas loading in the bulk zeolite region. These simulations were extended up to 1000 ns to determine if steady state loading of the larger gases could be achieved from standard MD simulations without enhanced sampling, and to provide additional data for the kinetic model fitting. Even after 1000 ns of simulation time, Xe loadings at all three temperatures had not reached steady state. Additionally, the reverse temperature trend for adsorption of the larger gases is evident even at longer simulation times.
Results from MD simulations showing gas loading profiles in the ‘bulk zeolite’ region of 4.4 nm, 5.9 nm, and 7.4 nm dry clinoptilolite slabs at high loading (100 atoms on each side). Simulation temperatures are 250 K (blue), 300 K (green), and 350 K (red)

Simulations of equimolar Ar/Xe and Kr/Xe mixtures in clinoptilolite slabs (Fig. S6) indicate that the presence of a competitor gas had very little effect on gas-loading profiles. Gas loadings in the mixture simulations are slightly larger than the single component counterparts. The presence of other gas atoms of different sizes changed the potential energy landscape perceived by gases within the zeolite pores. Qualitatively, it appears that that the kinetics of gas loading was slightly slower for mixtures, but this may be a statistical effect. The total gas concentration in the mixture simulations (100 atoms on each side) was double that of the single component simulations (50 atoms on each side), but the mixture loading profiles also appeared slower than the single component at high gas concentration (Fig. 6). Temperature trends in the mixture simulations are the same as the single component simulations, although more simulation time would be required for Kr loading to reach steady state in the Kr/Xe mixture.
Experimental gas adsorption results for dry clinoptilolite (Fig. 9) confirm the unusual temperature trends for Xe and Kr uptake. The observed low Xe loading confirms the presence of a kinetic barrier for gas adsorption. Xe uptake increased as the temperature was increased from 273 to 300 K, in agreement with the MD profiles (Fig. 6). When the sampling time was increased, Xe loading increased substantially (blue square in Fig. 9), similar to the simulated gas loading profiles over a long time. The increase in Kr uptake at 300 K compared with 273 K is not consistent with the MD profiles (Fig. 6), which could be attributed to the ideal zeolite structure or the FF parameters used in the simulations. Adding atomic polarizability to the FF model could affect both adsorption enthalpies and gas loading, particularly for the larger gas species. Narrower window sizes in the clinoptilolite model would further enhance the Kr diffusion barrier, resulting in the reverse temperature trend seen in the experimental adsorption isotherms. However, despite any shortcomings in the simulation approach, the MD results provide an explanation of the reverse Kr/Xe selectivity seen experimentally.
Single component experimental gas adsorption isotherms for Kr (green and dark blue) and Xe (light blue and red) using clinoptilolite powder at 273 K and 300 K. Data points for the isotherms (solid lines) are measured at 10-s intervals, whereas the long equilibration measurement for Xe (blue square) used a 1000-s interval

Kinetic Models of Diffusion
Gas loading profiles from the MD simulations were fitted with kinetic models based on solute uptake into fibers (Wilson, Reference Wilson1948) and gas flow in capillary networks (Barrer, Reference Barrer1949). The kinetics of gas uptake in porous materials was governed by loading at the external surface and diffusion in the bulk region. Because the kinetic models include surface loading, total gas uptake from the MD simulations (i.e. ‘bulk zeolite’ and ‘interface’ regions) were used as input. As seen in Fig. 10, the model accurately predicted loading profiles for the smaller gases Ar and Kr. Specifically, the model captured both the steep initial loading on the external surface, and slower loading into the bulk region. Similar fitting results were seen in clinoptilolite slabs of different thickness (Fig. S7). Because gas loading in mordenite was far more rapid than in clinoptilolite, loading on the external surfaces occurred on a similar time scale to internal diffusion and, consequently, the model assuming instantaneous external loading did not approximate the mordenite system as well (Fig. S8).
Kinetic model fits (black lines) of MD simulation results at 250 K (blue), 300 K (green), and 350 K (red) of total gas loading profiles (‘interface’ and ‘bulk’ regions) for A Ar and B Kr in the 7.4 nm clinoptilolite slab at high gas concentration (100 atoms on each side)

Simulated loading profiles for the larger gases (Xe and Rn) were fitted with a different model in which slow uptake in the pores follows a small-time approximation (Eq. 20) (Crank, Reference Crank1948, Reference Crank1975). The model similarly assumes a large initial loading due to nearly instantaneous adsorption at the external surface (Fig. 11). This model does not fit the MD results as well as that used for the smaller gases, but it does capture the qualitative aspects of hindered diffusion. It is important to note that the reverse temperature trend for Xe and Rn was not seen in the kinetic fits as gas loading on the external surface was included. The MD model has an unusually large ratio of external-to-interior surface areas (Fig. 3). The contribution of external surface loading would be significantly reduced in experimental samples, which would have much smaller ratios of external-to-interior surface areas. This leads to the hypothesis that the degree of Xe/Kr reverse selectivity for clinoptilolite will depend on particle size.
Kinetic model fits (black lines) of MD simulation results at 250 K (blue), 300 K (green), and 350 K (red) of total gas loading profiles (‘interface’ and ‘bulk’ regions) for A Xe and B Rn in the 7.4 nm clinoptilolite slab at high gas concentration (100 atoms on each side)

The capacity ratio
 represents the ratio of the adsorbed quantity to free gas quantity at equilibrium. To make a comparison for simulations conducted on slabs of different dimensions, the number density at equilibrium is listed in Table 2. While it was presumed that the adsorbed concentration would be proportional to the free gas concentration, the results indicate that nearly constant number density was reached for both Ar and Kr regardless of the final number density in the void region. This suggests that, in these simulations, the slab became saturated. While the saturated loading decreased with increasing temperature for Ar, the loading was nearly constant with temperature for Kr.
Gas number density
 in clinoptilolite slabs by extrapolating kinetic models to equilibrium

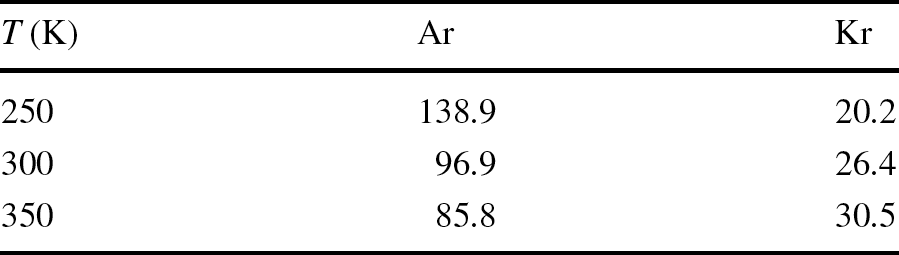
The fitted transport diffusivities are similarly shown in Table 3. There is a direct relationship between the transport diffusivity (
 ) and simulation temperature (T) for Kr, yet an inverse relationship for Ar. For Ar, it is likely that any increase in the intrinsic mobility diffusivity with temperature was more than offset by a reduction in the thermodynamic factor. This conclusion is similarly supported by the reduction in equilibrium number density for Ar with increasing temperature in Table 2. In contrast, as Kr has a comparable equilibrium number density across the simulated temperatures, the thermodynamic factor plays a less substantial role in altering the transport diffusivity with temperature. That is, the fitted Kr transport diffusivity is more indicative of an increase in intrinsic mobility. Note that the Kr transport diffusivity increased more rapidly with temperature than a sqrt(T) relationship as would be expected in Knudsen diffusion. This suggests that successful passage of Kr through the zeolite windows is not only dependent upon the number of Kr atoms incident with the window, but also upon the energy of the incident particles, consistent with an Arrhenius barrier. Similar trends are seen for the other clinoptilolite slabs (Tables S3 and S4).
Transport diffusion coefficient
 (Å2⋅ns−1) from kinetic models used to fit simulated gas loadings in 7.4 nm clinoptilolite slabs

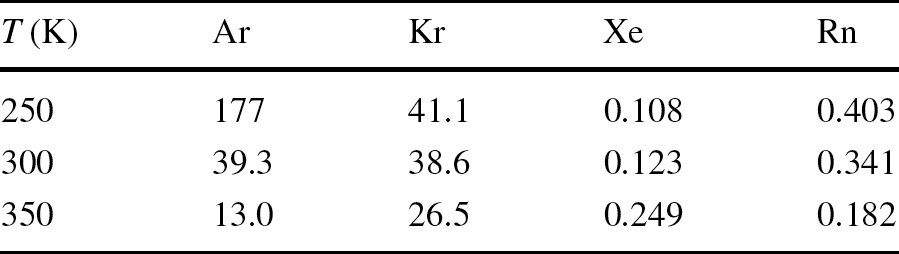
While the need for the small-time value approximation (Eq. 20) to fit the loading profiles of the larger gases (Xe and Rn) does not permit independent estimates of diffusivity and capacity ratios, the equivalent characteristic timescale (
 can nevertheless be compared. The results are listed for a 7.4 nm slab in Table 4 and the other slabs in Table S5. Additionally, the equivalent timescale calculated using the independent estimates of
 and
 for Ar are Kr is included in Table 4. These results corroborate the use of the small-value time approximation as, for simulations conducted over 100 to 200 ns, the non-dimensional time is far less than one. The occlusion of Xe and Rn resulted in much lower loading by 2–3 orders of magnitude compared with Ar and Kr. Interestingly, this suggests that mass loading of Rn into clinoptilolite would exceed that of Xe, despite its expected lower diffusivity. This suggests the increased adsorptive capacity of Rn in the material is driving more gas into the slab at early times, which is not adequately modeled by the
 approximation (Crank, Reference Crank1975).
Characteristic timescale γ
 from kinetic models used to fit simulated gas loadings in 7.4 nm clinoptilolite slabs

Discussions
Separation of gases in a mixed stream can occur due to differences in gas adsorption properties, but also gas mobility. A recent computational screening study of siliceous zeolites showed that the most promising zeolites for potential Xe/Kr separation applications contain narrow pores with tortuous diffusion pathways (Lawler et al., Reference Lawler, Sharma, Alagappan and Forster2016). Gas mobility in zeolites also depends on the size of extra-framework cations present in the pores (Perez-Carbajo et al., Reference Perez-Carbajo, Dubbeldam, Calero and Merkling2018). Smaller cations increase the accessible volume, which increases mobility. Gas diffusion in clinoptilolite has been shown to depend significantly on cation exchange (Ackley & Yang, Reference Ackley and Yang1991; Jayaraman et al., Reference Jayaraman, Yang, Chinn and Munson2005; Kennedy & Tezel, Reference Kennedy and Tezel2018; Li et al., Reference Li, Ullah, Jiao, Sun and Bai2020). However, our MD simulations of slab models (Fig. 6) indicate that these cations do not significantly affect gas uptake in clinoptilolite.
The MD study also investigated the migration of extra-framework cations to different pore locations in clinoptilolite in the presence of water and after heating to 623 K (350°C). As seen in the MD snapshots (Fig. S9) and cation-oxygen radial distribution functions (Fig. S10), the extent of cation relocation due to water varied with cation hydration tendencies. Weakly hydrating K+ ions occupied nearly identical positions in the dry or wet states of clinoptilolite, while strongly hydrating Na+ and Ca2+ ions tended to move away from the zeolite walls as they became hydrated. Cation locations in the dry clinoptilolite model are in good agreement with results from previous quantum calculations (Uzunova & Mikosch, Reference Uzunova and Mikosch2013). Similar results are seen for Na+ migration in mordenite (Figs. S11 and S12).
The MD simulations confirm the expected trend of decreasing gas mobility with increasing water content, either from mean square displacement in bulk models (Fig. 5) or gas loading in slab models (Figs. 6 and 7). Our results are in good agreement with experimental measurements of Rn mobility in mordenite, in which the Rn diffusion coefficient was reduced by an order of magnitude between dry and partially hydrated states (Hsu et al., Reference Hsu, Tsai and Liang1994). It is interesting to note that in the partially hydrated state, gas mobility decreased with increasing gas size (Fig. S2), while water mobility was invariant to gas size (Fig. S3). This result is indicative of low gas solubility in zeolitic water, at least based on the force field parameters used in the simulations. If the adsorbed gas was considered solvated, then the gas and water diffusion coefficients would be similar in magnitude. This feature has been observed for cation and water diffusion in clay nanopores (Greathouse et al., Reference Greathouse, Hart, Bowers, Kirkpatrick and Cygan2015, Reference Greathouse, Cygan, Fredrich and Jerauld2016).
Xe mobility in clinoptilolite was severely limited by diffusion barriers when the pore size was less than the Xe diameter. As seen in Fig. 1, each channel had a minimum diameter between 2.6 Å and 3.3 Å, significantly less than the van der Waals diameter of Xe (4.1 Å). For Kr, the van der Waals diameter (3.7 Å) seemed to prevent diffusion in clinoptilolite. However, rare jump diffusion events through these barriers were possible for significant Kr uptake to occur even at the MD time scale (Figs. 6 and 8). And as seen in Fig. 8, extended simulation times up to 1000 ns indicate that very slow Xe loading into the slab models was a result of a significant diffusion barrier. Additional evidence of diffusion barriers for the larger gases is seen by the persistence of a reverse temperature trend in gas loading (Figs. 6 and 8). Detailed analyses of the energy barrier for such rare events require enhanced simulation methods based on transition state theory (Beerdsen et al., Reference Beerdsen, Smit and Dubbeldam2004; Dubbeldam et al., Reference Dubbeldam, Beerdsen, Vlugt and Smit2005) and are beyond the scope of this work. Our experimental gas adsorption results (Fig. 9) confirm that the kinetic barrier to Xe diffusion in clinoptilolite persists even at laboratory time scales.
The kinetic model showed a good qualitative fit for simulated Ar and Kr loading profiles at long times (Fig. 10). This model enables the equilibrium loading to be estimated using simulations of a shorter duration as this loading is predicted by fitting all available data. Diffusivity appears related to slab thickness, which may suggest that the external adsorption process is not instantaneous and alters the estimated intracrystalline diffusion. Additional simulations with larger slab regions or lower initial gas concentrations may provide more refined estimates of diffusivity. While the small-value time approximation used to fit the Xe and Rn results did not provide independent values of equilibrium loading and diffusivity, it did provide a quantitative estimate of how effectively these materials are sieved by the zeolite in question without excessive simulation time. This comparison confirms the qualitative result seen in the MD simulations, namely that access of the larger gases to the bulk zeolite is kinetically limited.
Conclusions
The primary effort of this work was a systematic molecular simulation study of noble gas uptake in two zeolites with pore-limiting diameters similar in size (clinoptilolite) and larger than (mordenite) the gases. Gas diameters ranged in size from 3.4 Å (Ar) to 4.4 Å (Rn) in terms of their van der Waals parameters used in the simulations. Pore diameters along the primary diffusion pathways of the zeolites ranged from 3.3 Å (clinoptilolite) to 6.5 Å (mordenite). The effect of zeolite pore environment on gas adsorption and mobility was fully explored with simulation models consisting of dry zeolites with and without the extra-framework cations, and partially hydrated zeolites at half of the water content from their reported crystal structures.
Simulated gas adsorption isotherms at room temperature (300 K) were obtained from grand canonical Monte Carlo simulations using bulk zeolite models. These simulations correspond to theoretical loadings as gas atoms were inserted into the pores rather than having to diffuse into the bulk mineral. As expected from such simulations, gas loading increased as gas diameter (and stronger gas-zeolite interactions) increased. Hypothetical gas atoms as large as 5 Å and 7 Å were shown to adsorb in clinoptilolite and mordenite, respectively. Adsorption was reduced in the presence of adsorbed water, indicating significant pore volume occupancy by water.
MD simulations showed that gas mobility in the bulk zeolite models is significantly hindered by pore size effects and strong gas–zeolite interactions characteristic of the larger gases. Gas atoms in clinoptilolite remained effectively trapped in the large cages with very limited jump diffusion events through pore-limiting windows. Gas mobility was reduced further in the presence of water, even though water molecules remained mobile although at reduced diffusivity compared to bulk water.
Zeolite slab models were used to demonstrate that the diffusion barriers in clinoptilolite resulted in significantly reduced adsorption kinetics. At the MD timescales employed in this study (up to 1000 ns), only the smaller gases Ar and Kr were able to access the zeolite interior and achieve steady state loading. The larger gases Xe and Rn were effectively blocked from entering the bulk region. The dominant role of the pore-limiting windows was confirmed when slab simulations without extra-framework cations in clinopilolite showed that the absence of these cations had little or no effect on gas loading profiles. Additionally, loading of the larger gases Xe and Rn in the slab models increased with increasing temperature, confirming the existence of a kinetic diffusion barrier. The presence of water in the slab models effectively prevented loading of all gases in clinoptilolite and reduced gas loading in mordenite.
The insight gained from these simulations regarding gas adsorption kinetics in clinoptilolite were confirmed by accompanying gas adsorption experiments. Both Kr and Xe exhibited slow uptake in dry samples, with increased loading at higher temperature. The extremely slow Xe uptake gave rise to the unusual property of reverse Kr/Xe selectivity. Additional experiments to further explore these phenomena will be the subject of a subsequent paper.
Finally, kinetic models based on solute uptake in thin films were applied. The simulated gas loading profiles in clinoptilolite were well described for both significant loading (smaller gases) and hindered uptake due to kinetic barriers (larger gases). Fitting parameters provided insight into the kinetics of surface adsorption and gas diffusivity in the zeolite pores. Importantly, this effort shows that such kinetic models can serve as a bridge between molecular-scale results and both experiments and macroscopic transport models.
Supplementary Information
The online version contains supplementary material available at https://doi.org/10.1007/s42860-023-00231-x.
Acknowledgments
The authors thank Todd R. Zeitler for helpful discussions. This work was fully supported by the LDRD program of Sandia National Laboratories. This paper describes objective technical results and analysis. Any subjective views or opinions that might be expressed in the paper do not necessarily represent the views of the U.S. Department of Energy or the United States Government. This article has been authored by an employee of National Technology & Engineering Solutions of Sandia, LLC under Contract No. DE-NA0003525 with the U.S. Department of Energy (DOE). The employee owns all right, title and interest in and to the article and is solely responsible for its contents. The United States Government retains and the publisher, by accepting the article for publication, acknowledges that the United States Government retains a non-exclusive, paid-up, irrevocable, world-wide license to publish or reproduce the published form of this article or allow others to do so, for United States Government purposes. The DOE will provide public access to these results of federally sponsored research in accordance with the DOE Public Access Plan https://www.energy.gov/downloads/doe-public-access-plan.
Data Availability
The authors confirm that the data supporting the findings of this study are available within the article and its supplementary materials, or may be made available through appropriate requests.
Declarations
Competing Interests
The authors declare that they have no competing interests.