Does increased credit supply affect financial and economic activity? In recent years, the negative effects of credit supply growth have been implicated in the severity of the financial crisis of the past decade, namely through the accumulation of mortgage debt in the United States (Mian and Sufi Reference Mian and Sufi2009). Historical data also show that credit supply booms are associated with longer, deeper, and more persistent recessions (Jordà, Schularick, and Taylor 2011). These studies offer a counterpoint to the existing scholarship on the positive relationship between finance and economic growth observed across countries and over time (e.g, Levine Reference Levine, Aghion and Durlauf2005). A related question is how market access can interact with credit supply to affect the economy. Investment in physical infrastructure that integrates markets significantly alters the economic landscape with both short- and long-run consequences. There is a large literature on transport improvements like railways and roads that generally demonstrate a positive economic impact on local and national economies (e.g., Atack, Haines, and Margo Reference Atack, Haines and Margo2008; Jaworski and Kitchens Reference Jaworski and Kitchens2019; Bogart Reference Bogart, Floud and Humpries2014), although there are also redistributive effects in terms of industrial agglomeration and public health (Tang Reference Tang2014, Reference Tang2017).
How these two forces of change interact and affect the structure of an economy, particularly in measures of growth and labor markets over the long run, remains an open question due to the challenges of identification and data availability, especially in a developing economy context.Footnote 1 We address these problems by using a historical dataset in a quasi-natural experimental setting, specifically a large credit supply shock and the introduction of railroads in Japan that respectively underpinned the country’s financial and transport revolutions. In 1876, the Japanese government compulsorily replaced the hereditary stipends of former samurai with interest bearing government bonds.Footnote 2 The ex-samurai represented about 5 percent of the population and the replacement bonds were collectively valued at 210 million yen, which was equivalent to nearly half of the country’s national income in 1876 and six times the government’s total revenue, but also an annual loss to the ex-samurai of up to 75 percent of their original stipends (Flath Reference Flath2014, p. 33; Yamamura Reference Yamamura1967, p. 204).Footnote 3 These bonds catalyzed the growth of banking throughout the country during a time of relative financial underdevelopment. Around the same time, the country received its first railways, with the cities of Tokyo and Yokohama connected in 1872, and the network progressively expanded across the country over the next four decades to create a national system that is still in use today.
To assess the effects of these shocks on regional development, we use bond values at the time of the stipend commutation and early rail station construction to proxy for differences in credit availability and market access, respectively. Since the stipend conversion was universal, compulsory, and resisted by the ex-samurai themselves, this financial policy reform is plausibly exogenous to existing or anticipated local economic activity (McLaren Reference McLaren1979).Footnote 4 Similarly, railways were initially built for national defense and political centralization but constrained by geographic considerations and limited financing (Ericson Reference Ericson1996). Our identification comes from the regional variation in per capita samurai bond values and rail stations. The former corresponds to the distribution of resident ex-samurai that existed before the policy change, while the latter to the opening of treaty ports connecting to the largest cities at the time.Footnote 5 We hypothesize that, given the high variation of per capita bond values between regions, this credit supply shock and concomitant increase in financial intermediation may influence subsequent differences in economic activity between those regions. Furthermore, since the economy was in the process of industrializing and imperfectly integrated during the late nineteenth century, our analysis of local credit supply and uneven market access via railways provides evidence of both potential short-run impact on local economies as well as persistent differences in the long run.Footnote 6
We test our hypothesis that variation in the initial credit supply and rail access affect local economic activity by regressing per capita income growth on per capita samurai bond value, rail stations, and their interaction at the prefectural level between 1874 and 1940.Footnote 7 Our dataset includes intervening benchmark years, which provide more systematic evidence of trends and persistence. To better identify the channels of transmission, we separately estimate the impact by major sector, include different bond coupon rates and banking capital measures, as well as examine possible correspondence in sectoral labor shares. We also control for path dependence and differences in initial conditions using lagged income, population (market size), per capita student enrollment share (human capital), and low gradient land population density (urbanization).
Our results indicate that there are two main redistributive effects: between sectors and between regions. In the short run (1874–1890), we find that the interaction between per capita samurai bond value and rail access is positively associated with growth in the tertiary sector, which includes finance, retail, and other services.Footnote 8 Over the same period, the primary sector experienced a large decline in growth among regions with high bond values and railway access. In marginal terms, for rail accessible regions a 1 percent increase in per capita samurai bond value corresponded with nearly a 12 percent increase in per capita income growth for the tertiary sector and a 27 percent decrease for the primary sector. These results are consistent with showing how both credit supply and market access have sector-specific effects and allow for a more rational reallocation of economic activity between sectors.
Lengthening the coverage into the early twentieth century reduces the magnitude of the effect of our interaction on both the primary and tertiary sectors, although growth persists through the decades leading up to WWII. In particular, given rail access, a 1 percent increase in average per capita bond value is associated with a 9 percent decline in growth in the primary sector between 1874–1940. For the tertiary sector, growth would increase about 4 percent. The extended time horizon underscores the significance of these shocks on the economy and support the interpretation of structural change. All specifications for our regression model include prefectural control variables such as population, school enrollment, urbanization, and a lagged term of per capita income as well as year dummies.
To check our mechanism of how the bonds were used, we substitute per capita banking capital for bond value in our specifications. In the primary sector, the negative effect is more modest and less persistent when regressed on banking capital while the tertiary sector effect becomes insignificant. This suggests that while bank capital, which used a large share of samurai bonds as collateral, is associated with less primary production per our bond specification results, the bonds were mainly used to grow the financial industry within the tertiary sector and, thus, banking had little effect on other services.
In terms of labor markets, we use sectoral labor share ratios instead of per capita income as dependent variables for the same specifications. Consistent with our income estimates by sector, primary sector labor shares decline relative to tertiary and secondary employment in the short run with some persistence to the end of our period. Our results are also robust to disaggregation of bond type as well as the exclusion of outliers such as Tokyo or areas adjacent to major cities.
Together, these findings indicate that the real economy, measured in output and labor, was significantly impacted by the samurai bond issue and the introduction of railways but only when considered by industry and region. For the average prefecture, the overall economic impact on growth was neutral in the short and long run, but variation along different margins (e.g., bond type, concentration of bond value) suggests significant local differences that may owe to factors further removed from the initial shocks to credit and market access.
BACKGROUND
While there is a well-established link between financial sector development and economic growth across countries and over time (King and Levine Reference King and Levine1993; Rajan and Zingales Reference Rajan and Zingales1998), less clear is the role of credit supply on regions within a country over the long run.Footnote 9 Historically, periods of economic growth coincided with increased credit intensity, but the overhang of excess credit in turn magnified the severity of crises and delayed recovery through debt-deflation pressure on prices and swings in expectations (Jordà, Schularick, and Taylor 2011; Schularick and Taylor 2012). Most of the literature has focused on macroeconomic financial aggregates or use modern data, leaving the within-country impact and its long-run persistence unaddressed. Furthermore, differences in market access such as transport infrastructure are usually unaccounted for.
This article exploits within-country variation in credit supply via a historic public bond issuance. This empirical strategy is similar to Mian and Sufi (Reference Mian and Sufi2009) which compares ZIP codes in the United States to uncover the origins of the mortgage debt boom in the late 2000s. Similarly, Guiso, Sapienza, and Zingales (Reference Guiso, Sapienza and Zingales2004) exploit regulation variations within Italy to analyze the effect of local financial development within an integrated financial system. Mian, Sufi, and Verner (Reference Mian, Sufi and Verner2017) examine the impact of credit supply shocks in the United States for the modern period starting in the 1980s. In contrast to these articles, we analyze differences in credit supply across regions in a financially and physically fragmented economy and for a longer period of time. This allows us to control for aggregate country shocks and to investigate the effect of credit supply growth and its persistence. We can also include variation in market access via rail station construction to show the interplay between credit supply and demand.
Japan in the late nineteenth century provides a useful setting to examine the roles of credit provision and usage on local economic outcomes. Starting in the Meiji Period (1868–1912), the government implemented numerous reforms and, along with private sector entrepreneurs, invested in infrastructure and industrial enterprises to modernize the economy. By the turn of the century, Japanese manufacturing had reached the same share of output as the United States and continued to increase in value-added and capital intensity (Perkins and Tang Reference Tang2017).Footnote 10 The tertiary sector also experienced dramatic growth as shown with the rise of general merchandising, shop-keeping, financial intermediation, and transport services (land and water).Footnote 11
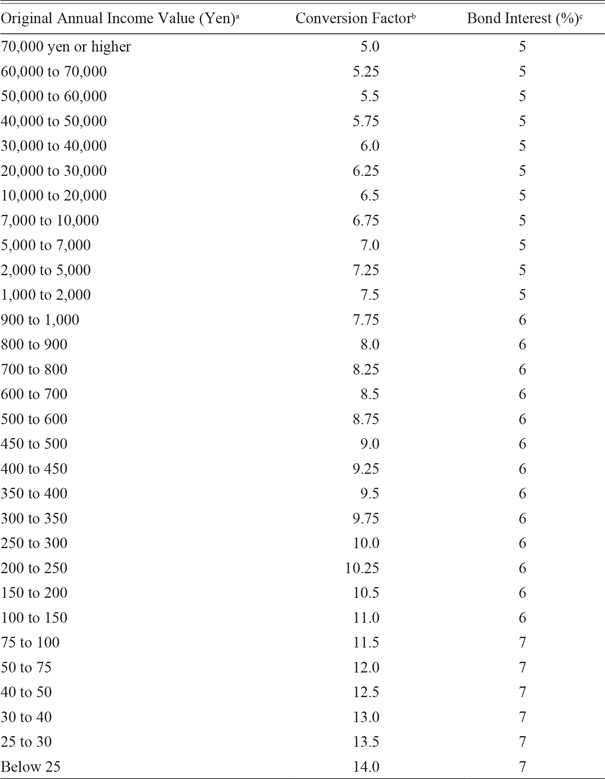
While Japan’s financial sector development, measured both intensively (e.g., financial assets, equities) and extensively (e.g., banks, informal intermediaries), is associated with its overall industrialization (Rousseau Reference Rousseau1999; Tang Reference Tang2013), a plausible causal trigger to its transition was an earlier large exogenous shock to its credit supply. This shock was the 1876 conversion of hereditary samurai stipends (aka, chitsuroku) into government bonds (a.k.a., kinroku) worth 173.9 million yen, motivated by the drain on public finances from samurai payments.Footnote 12 In the years leading up to the conversion, these payments accounted for one-quarter to one-third of all government expenditures in the 1870s (Beasley Reference Beasley1972).Footnote 13 The bond issuance would improve the central government’s fiscal position while simultaneously provide a major source of investment capital for agricultural and industrial expansion (Harootunian Reference Harootunian1960; McLaren Reference McLaren1979). The conversion was also sizeable relative to the existing supply of government bonds: before the issue of the 1876 kinroku bonds, public bonds totalled 51.5 million yen at that time.Footnote 14 Table 1 provides the stipend commutation scales into interest bearing bonds, which had a maturity of 30 years and a minimum holding period of 5 years.Footnote 15
SAMURAI STIPEND COMMUTATION SCALES, 1876

Notes:
a For incomes in perpetuity. Non-hereditary life incomes receive the same interest rates but for half the duration. Non-hereditary fixed term incomes also receive the same interest rates but for shorter durations than hereditary incomes: above 10 years (40 percent); 8 to 10 years (35 percent); 6 to 8 years (30 percent); 4 to 6 years (25 percent); 3 to 4 years (20 percent); and 2 years (15 percent).
b Scaling factor to convert annual income into total bond capitalization value; for example, a 6,000 yen annual income would be converted into bonds worth 42,000 yen paying 5 percent interest per year.
c Redemption of bonds bearing 7 percent interest was completed in 1891, 6 percent interest in 1893, and 5 percent interest in 1906.
Sources: McLaren (Reference McLaren1979) and Tomita (Reference Tomita2005). See text for more detail.
There were some immediate consequences following the stipend conversion. First, interest payments by the government fell from 34.6 million yen before the 1868 Meiji restoration to 12.8 million yen after the 1876 stipend conversion. Second, the Japanese banking system expanded rapidly, since under the revised 1876 National Banking Act chartered national banks were allowed to accept these commutation bonds as investment capital and to issue convertible notes based on reserves; in effect, the bond issue catalyzed the growth of national banks across prefectures (Yamamura Reference Yamamura1967).Footnote 16 Modeled after the extant American national banking system, these banks increased from 6 in 1876 to 153 over the next three years and were spread throughout the country, with ex-samurai contributing three times more capital in these banks compared to all other classes combined (ibid., p. 205).Footnote 17 The dominant position of samurai in national bank ownership remained in place through the 1880s, which coincided with the start of modern economic growth and Japan’s subsequent transition to an industrialized economy (Rousseau Reference Rousseau1999; Tang Reference Tang2013).Footnote 18
The public finance and banking narratives, however, are incomplete in that the national budget remained precarious given military expenditures, high inflation and later deflation, and the small share of samurai bonds (27 percent by value) invested in national banks (Tomita Reference Tomita2005).Footnote 19 The high inflation period immediately following the stipend commutation may have also created uncertainty around the government’s commitment to fulfill its bond obligations, motivating samurai to invest their bonds in enterprises, sell them at a discount, or to redeem them as soon as possible. Exacerbating these initial conditions was the lack of capital market integration in Japan, which persisted until the 1890s following the establishment of a central bank and its branch network that reduced interest rate spreads (Mitchener and Ohnuki Reference Mitchener and Ohnuki2007). Moreover, these bonds were not limited to bank capitalization: between 1876 and 1889, businesses owned by samurai also grew extensively and varied from small companies to joint-stock corporations (Harootunian Reference Harootunian1960). The pairwise correlation of per capita bonds in 1876 with per capita banking capital in 1884 is 0.75 and with per capita bank counts is 0.30.Footnote 20 By focusing solely on the role of banking, the contribution of the bond issue on tertiary sector growth that includes financial services would be obscured.
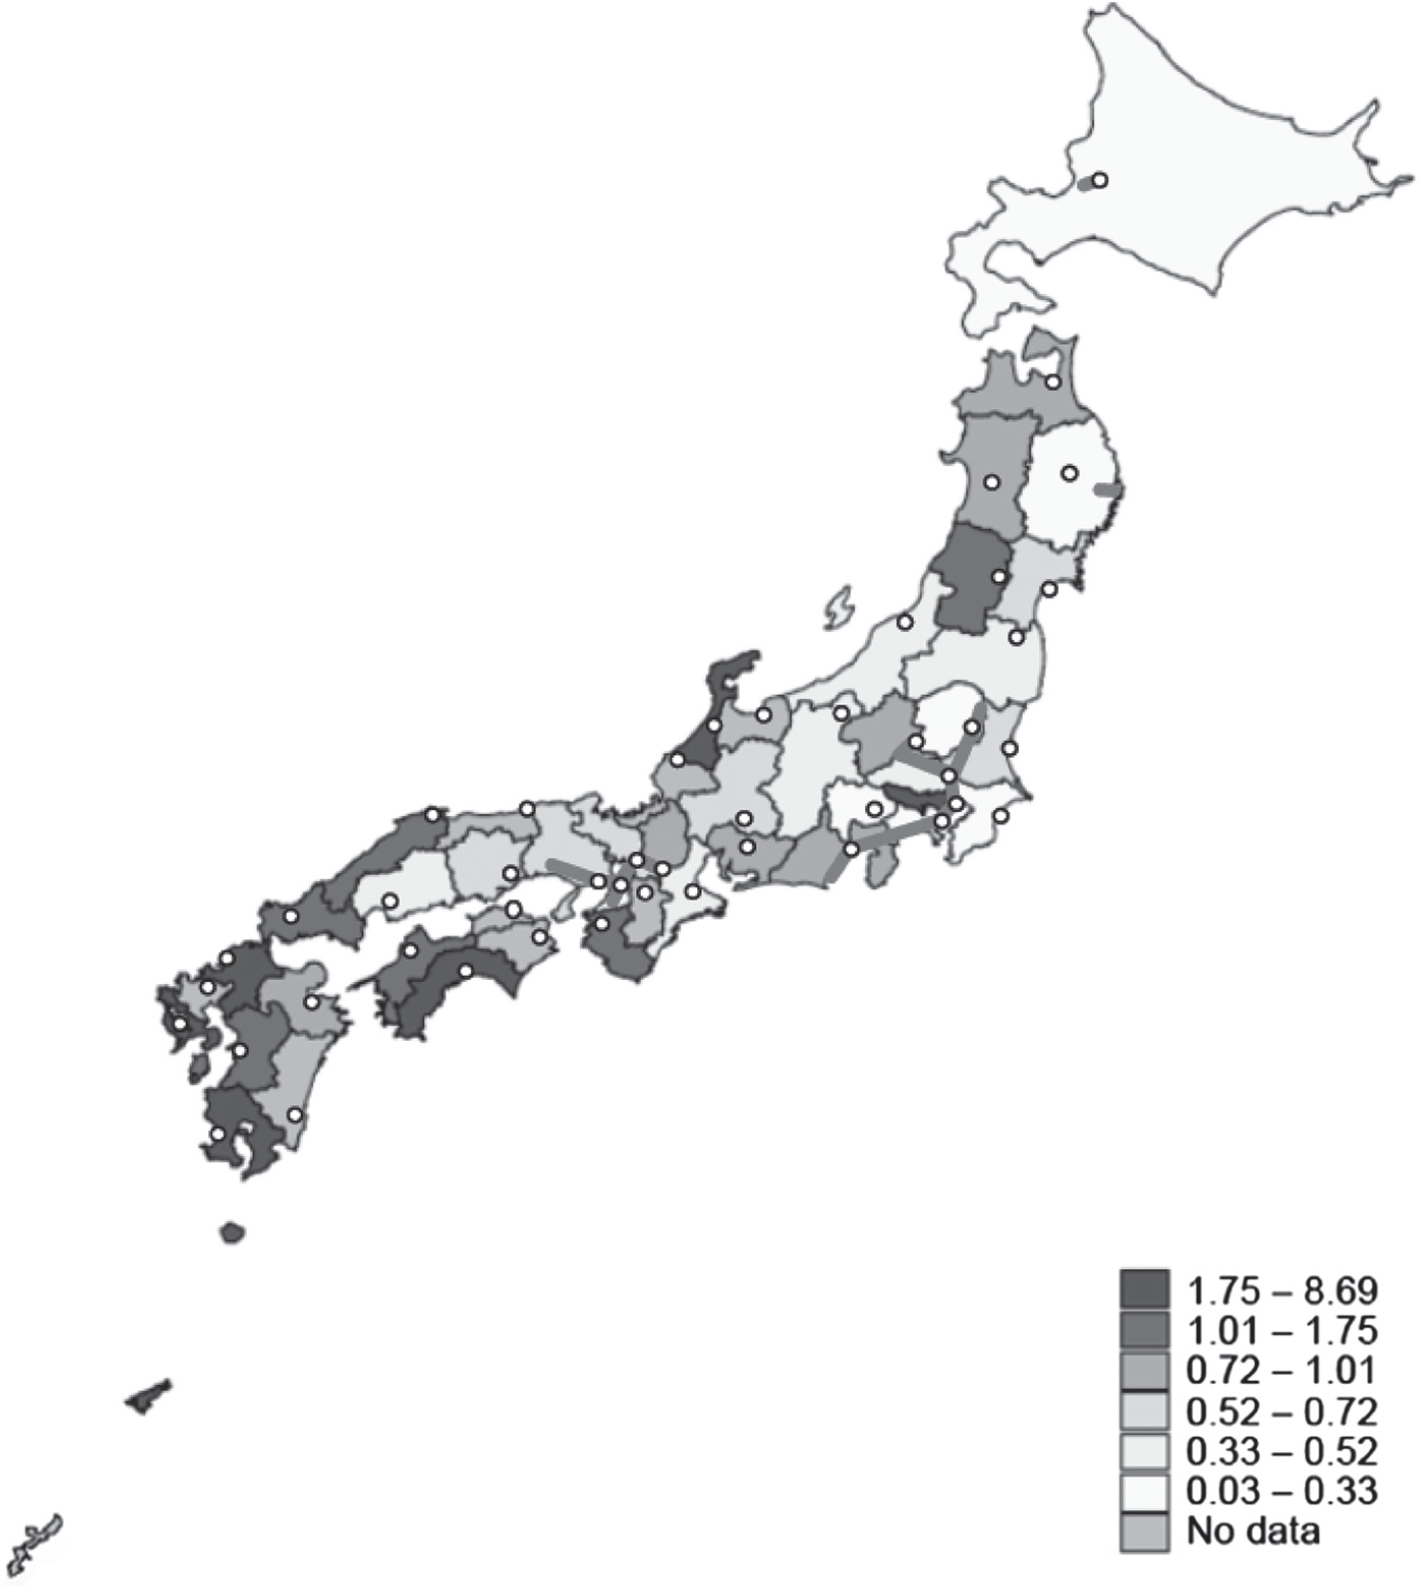
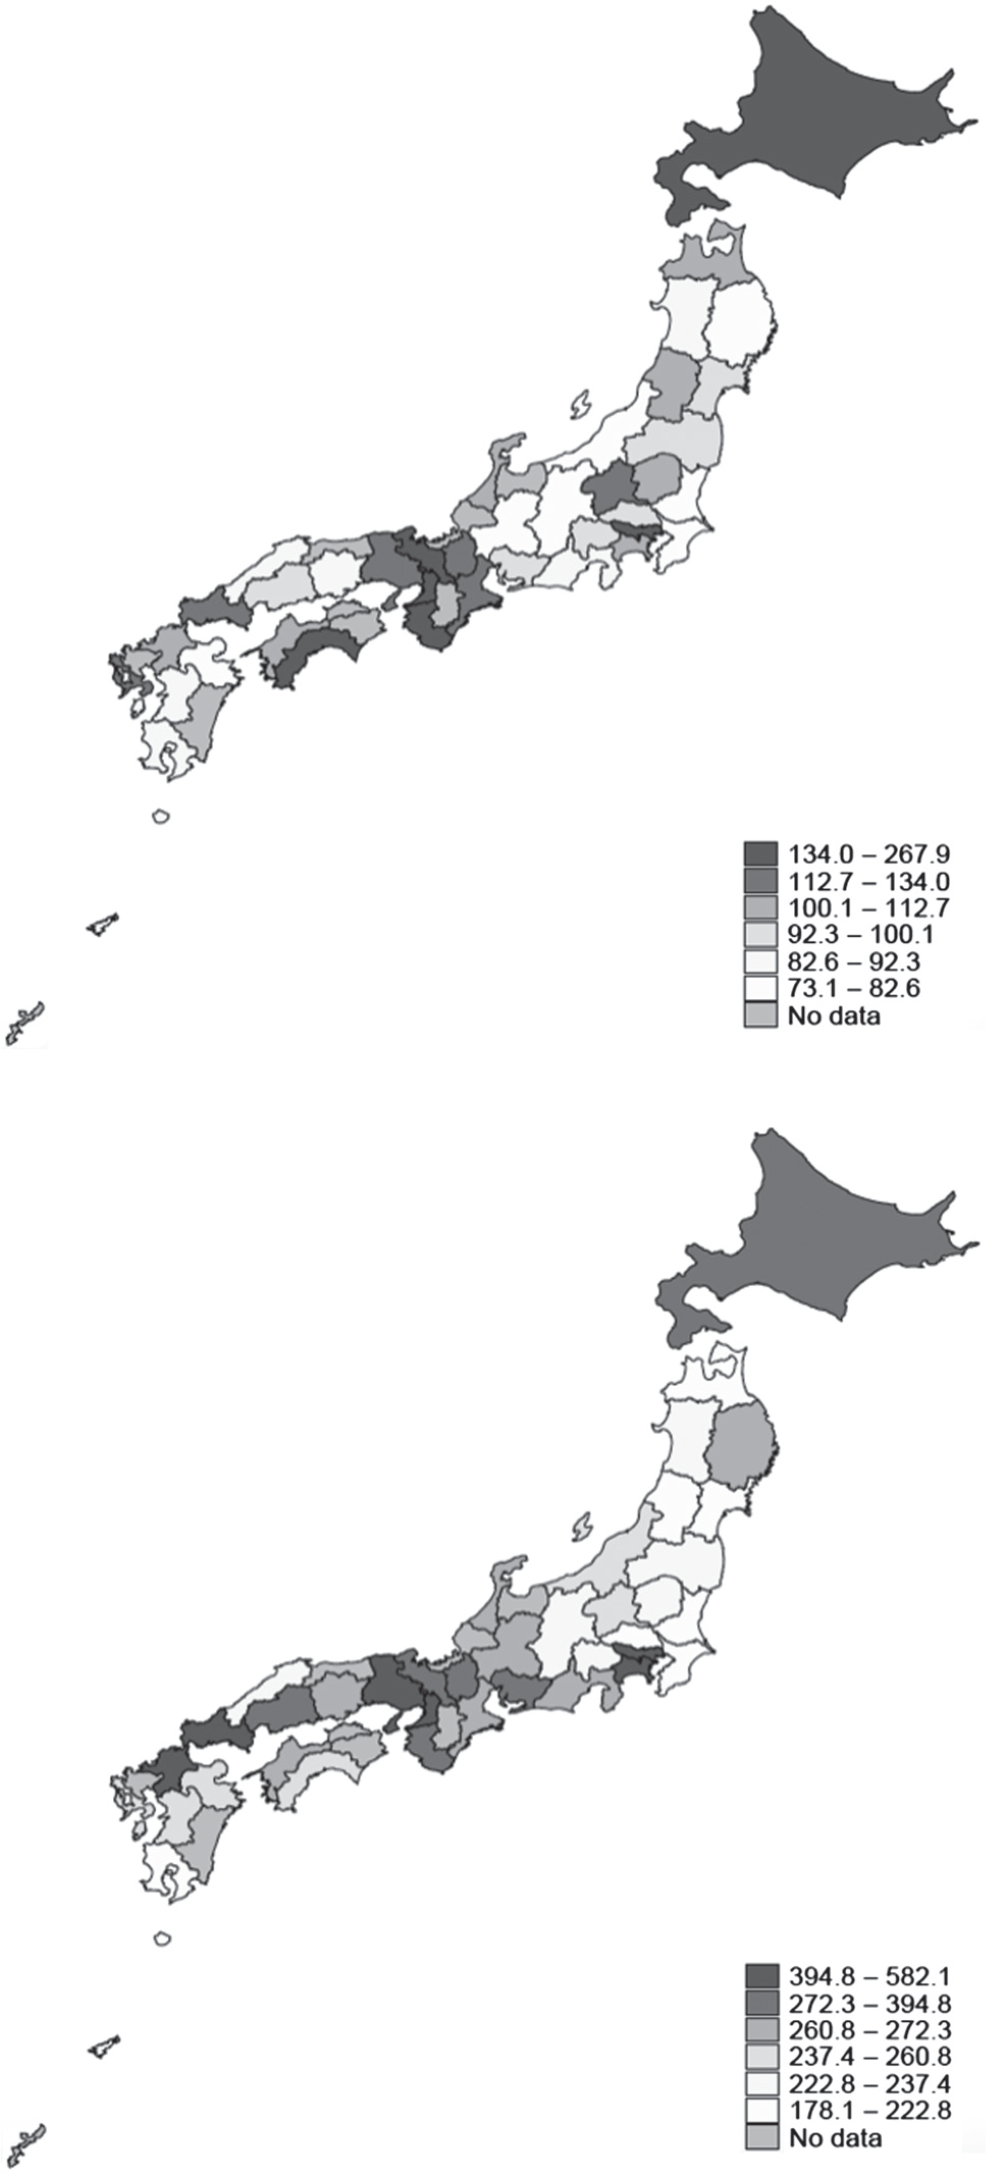
The premise of our identification strategy is that since the ex-samurai and their bond payments were unequally distributed across prefectures, their contribution to local economic activity via additional credit may account for the short- and long-run regional differences measured more broadly in industrial activity, income growth, and labor productivity (Moriguchi and Saez Reference Moriguchi and Saez2008; Fukao et al. Reference Fukao, Bassino, Makino, Papryzycki, Settsu, Takashima and Tokui2015). In Figures 1 and 2, we map the geographic distribution of bond value per capita and pre- and post-bond issue income per capita by prefecture. As shown, there is wide variation between regions, with significant differences in subsequent performance that are not accounted for simply by initial samurai placement and associated bond values. For example, while Tokyo, Kagoshima, and Ishikawa prefectures received the largest amount of bonds, the latter two prefectures did not experience significant post-bond issue growth. In contrast, Osaka prefecture received few bonds, but was like Tokyo a major metropolitan area and remained an industrial center throughout the Meiji and post-Meiji decades.Footnote 21 Furthermore, demand for this credit may also have been uneven given available opportunities for investment, with access to the growing national market and international trade via improvements in transport affecting how the supplied credit was used.
1876 BOND VALUE PER CAPITA AND 1885 RAIL ACCESS

1874 AND 1940 PREFECTURAL OUTPUT PER CAPITA

Corroborating our narrative of differential performance between prefectures, there was a significant rise in inequality in the period preceding WWII due to shifts away from primary production, and this did not decrease until after the war (Fukao and Paul Reference Fukao and Paul2017). Major metropolitan areas like Tokyo and Osaka experienced rapid industrialization and more populated areas grew at the expense of smaller and more isolated ones following the expansion of the national railway system (Fukao et al. Reference Fukao, Bassino, Makino, Papryzycki, Settsu, Takashima and Tokui2015; Tang Reference Tang2014). In the remaining sections, we analyze the extent by which prefectural differences in credit supply and market access may have affected economic activity and whether these persisted over time.
RESEARCH DESIGN
Data
To investigate the relationship between the local credit supply shock, market access, and subsequent development, we use historic data that provide prefectural measures of output, employment, bond values, rail station construction, and demographic characteristics.Footnote 22 Collectively, these data span the period between 1874–1940 and are disaggregated by the 47 prefectures that comprise Japan, although many series are available for only a subset of prefectures. Output and labor force data by prefecture were collected for a number of benchmark years in the pre-war period: 1874, 1890, 1909, 1925, 1935, and 1940 (Fukao et al. Reference Fukao, Bassino, Makino, Papryzycki, Settsu, Takashima and Tokui2015). These data are also separable by prefecture into the three major sectors of primary, secondary, and tertiary categories for the entire period. The advantages to using these output data include the ability to measure possible persistence over time even as the national economy became increasingly integrated both in financial capital and goods as well as being exposed to international trade. Data on bonds issued to samurai by prefecture in 1876 were collected by the Japanese Ministry of Finance (1904). Railway data are from a handbook of rail station construction, which provide both dates and locations of all stations built starting in the 1870s (Chuo Shoin 1995; Tang Reference Tang2014).
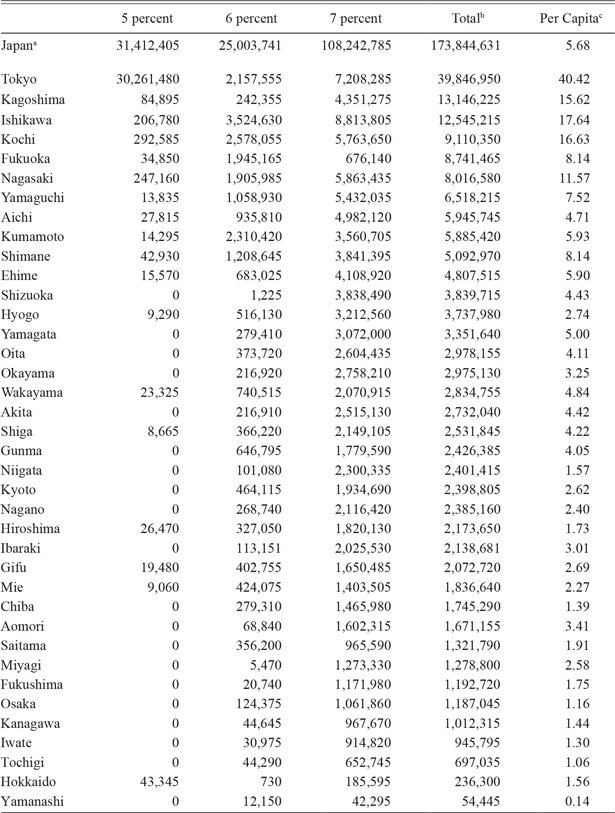
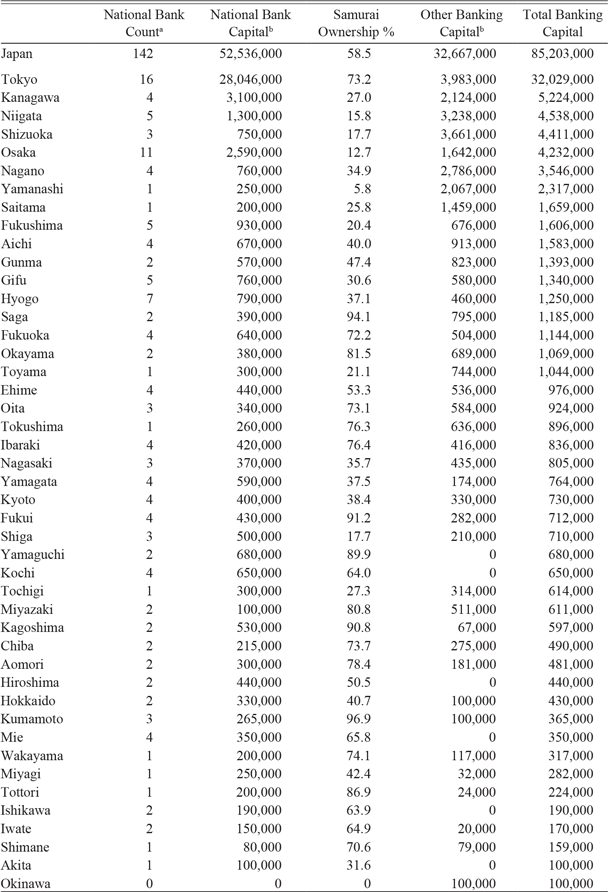
Average per capita bond values in nominal yen are shown in the last column in Table 2. Extreme values include Tokyo (40.42 yen per capita) and Yamanashi (0.14 yen per capita), which can be attributed in part to the high share of wealthy samurai living in the former (who received 5 percent coupon bonds) and the lack of in the latter. Moreover, there are nine prefectures that did not exist at the time of the 1876 commutation, so no bond values for these are available, bringing the sample in the analysis down to 38 prefectures.Footnote 23 Table 3 shows the breakdown of chartered national banks, which received much of their paid-in capital from these samurai bonds. These bank counts and samurai ownership shares underscore the relative immobility of financial capital between regions at the beginning this period, despite efforts by the government to create a national system during this period.Footnote 24 The lack of integration in the short run demonstrated by the dispersion of capital may, thus, allow for localized economic impacts from the bond issuance, which were not fully redeemed until the first decade of the 1900s.Footnote 25
SAMURAI BOND DISTRIBUTION BY PREFECTURE

Notes:
a Includes 5 percent bonds valued at 30,575 yen distributed to the imperial household, which are not prefecture specific. Fukui, Kagawa, Miyazaki, Nara, Saga, Tokushima, Tottori, and Toyama prefectures did not exist (i.e., were part of other prefectures) at the time of the stipend commutation, and Okinawa was not formally incorporated into Japan until 1879, after the commutation.
b Includes 1 percent bonds, which account for 9,185,700 yen (5.3 percent) of the total bonds distributed.
c In nominal yen.
Sources: Ministry of Finance (1904) and authors’ calculations.
DISTRIBUTION OF BANKING CAPITAL BY PREFECTURE, 1884

Notes:
a Excludes branches.
b In nominal yen. Other capital includes private banks and quasi-banking institutions.
Sources: Japan Statistical Association (1962) and authors’ calculations.
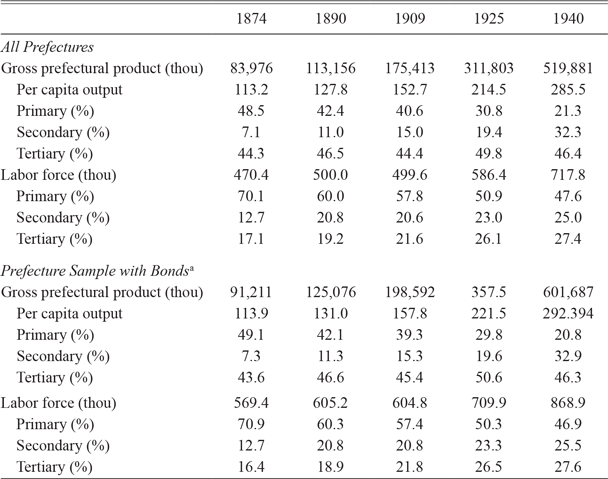
Prefectural output measures in per capita terms and by sector are shown in the top and third panels of Table 4, covering the years between 1874 and 1940. Throughout this period, Japan steadily increased its per capita output in real terms, with the shares of value from secondary and tertiary sectors growing at the expense of primary production. The period between 1874 and 1909 shows a doubling of secondary sector value, which reached nearly one-third of national output by 1940 largely due to a shift away from primary production. This is true for all prefectures in the country and for those with available bond data. The second and bottom panels show a similar breakdown for employment, which also shifted away from primary production into the secondary and tertiary sectors, doubling their proportions of the labor force by the end of the period.
PRE-WAR PREFECTURAL OUTPUT AND LABOR, 1874–1940

Notes: Gross prefectural product (thou) and per capita output in constant 1934–1936 yen.
a Excludes prefectures that did not exist at the time of bond payments.
Sources: Fukao et al. (Reference Fukao, Bassino, Makino, Papryzycki, Settsu, Takashima and Tokui2015), footnote 2 in Table 2, and authors’ calculations.
Theoretical Motivation
How should the bond conversion of former samurai stipends affect the economic activity? Numerous anecdotes of former samurai (e.g., Yasuda Zenjiro of Yasuda Mutual Life Insurance, Iwasaki Yataro of Mitsubishi, and Fujioka Ichisuke of Tokyo Electric Light) illustrate their success in establishing new firms and investing in banks (Yamamura Reference Yamamura1974; Tokyo Dento 1936). While there were nascent equity exchanges in Tokyo and Osaka, most firm capital formation was through network finance without necessarily using banks as intermediaries. At the same time, banking played a role in mobilizing financial capital and using the samurai bonds as collateral as intended with the National Banking Act of 1876 (Tomita Reference Tomita2005). In this section, we briefly summarize the theoretical channels through which financial development may affect the economy and how we can empirically test its effect.
Financial development loosely describes different functions that financial systems provide in an economy. Levine (Reference Levine, Aghion and Durlauf2005) emphasizes five functions: (i) produce information and improve capital allocation, (ii) monitor investment after providing finance, (iii) increase diversification and reduce uncertainty, (iv) mobilize and pool savings, and (v) facilitate the exchange of goods and services. Samurai bonds may have helped to improve Japanese financial institutions in more than one of the above categories, for example, by creating new assets in the economy to generate growth (Acemoglu and Zilibotti Reference Acemoglu and Zilibotti1997). Moreover, the use of samurai bonds to capitalize chartered national banks could be conducive to increasing the number of firms (Holmstrom and Tirole Reference Holmstrom and Tirole1997). Finally, by helping to mobilize resources, samurai bonds may have helped to fund large projects that could not have been funded by individual investors (Bagehot Reference Bagehot1873), although in the case of the two leading industries, cotton spinning and railways, the start-up investment requirements were funded through equity markets.
While we are unable to precisely disentangle the specific channels through which the samurai bond issuance affected Japanese development, we can more generally assess the empirical effect of financial development proxied by samurai bonds per capita on subsequent economic activity by prefecture and sector. Similar to Mian et al. (Reference Mian, Sufi and Verner2017), we analyze how the economic growth of different regions within a country are affected by their initial level of financial development. The empirical framework follows the tradition of cross-country growth regressions to estimate the effect of financial development on economic growth as employed by King and Levine (Reference King and Levine1993).Footnote 26 Our contributions are to use the provision of a financial instrument instead of changes in regulation; an identification strategy with a quasi-experimental setting for a plausible causal interpretation; and a long-run data series that allows for analysis of both short-run effects and potential persistence.Footnote 27
Furthermore, given that we have sectoral disaggregation, we can study the differential effect of financial development across sectors and time. Following Rajan and Zingales (Reference Rajan and Zingales1998), who show that the effect of financial development should depend on the characteristics of the industries, we perform a similar exercise but within a country and at a higher level of aggregation. Consistent with their predictions, we should find that the effect of samurai bonds on economic activity is exacerbated in financially dependent sectors like heavy industry and finance and muted in less dependent sectors like agriculture. With domestic and international market integration, these effects should also attenuate over time.
One additional contribution not found in the financial development literature is the effect of market access, for which we use the connection to the nascent national rail network as our proxy. The positive effect of railways on economic development is well-established, and we extend this scholarship by testing the hypothesis that financial development has a more positive effect on local development if it occurs simultaneously with local latent demand, particularly investment opportunities that improve access to technology or markets (Summerhill Reference Summerhill2005; Atack, Haines, and Margo Reference Atack, Haines and Margo2008; Herranz-Loncan Reference Herranz-Loncan2011; Donaldson Reference Donaldson2018). This conditional effect of the availability of profitable investment opportunities has anecdotal support in the historical record, with many samurai and entrepreneurs failing in their ventures due to the immaturity of the economy and non-viable ventures (Harootunian Reference Harootunian1960, p. 443). At the same time, there may be redistributional effects as well, since rail access encouraged industrial agglomeration and shifts toward manufacturing, both of which required higher levels of credit supply (Tang Reference Tang2014). In the context of pre-war Japan, we argue that per capita railway stations serve as a reasonable proxy for market access, local credit demand, and potential growth. Since the introduction and placement of the railways during the 1870s and 1880s was exogenous to the government’s bond issue, the two effects of credit availability and railway access can be compared against regions that received just one or the other, and highlight their collective importance to growth.Footnote 28
Empirical Strategy
Per our previous discussion, we consider the following growth regression to assess the effect of bond value per capita and rail access on economic activity of Japan:
 $$\eqalign{ & \Delta GPPp{c_{it}} = {\beta _0} + {\beta _1}*ln(GPPp{c_{it - 1}}) + {\beta _2}*Bon{d_{i0}} + {\beta _3} \cr & *Station{s_{i1}} + {\beta _4}*Bon{d_{i0}}*Station{s_{i1}} + {\delta _t} + {e_{it}}, \cr}$$
where ΔGPPpc it = ln(GPPpc it) =ln(GPPpc it/GPPpc it–1), GPPpc it is gross prefecture product per capita in prefecture i and year t, Bond i0 is the bond value per capita in 1876, and Stations i1 and is the number of railway stations per capita in prefecture i in year 1885. Both per capita bond value in 1876 and prefectural output from 1874–1940 are measured in constant 1934–1936 yen (Fukao et al. Reference Fukao, Bassino, Makino, Papryzycki, Settsu, Takashima and Tokui2015). We use railways in 1885 in our baseline specification because that year coincides with both the end of the Matsukata deflationary period, which promoted private investment, and the start of the railway boom, but we also consider for robustness the number of stations per capita in 1880, which provides similar results. As discussed in Tang (Reference Tang2014), initial market conditions in Japanese prefectures created path dependency and industrial agglomeration, so we anticipate a larger growth effect in areas that joined the national railway network and market earlier in the period. To control for possible output convergence over time between prefectures we include a lag term for the previous period’s per capita output. Our preferred specification also includes prefectural-level control variables of population (i.e., market size), per capita student enrollment share in 1885 (i.e., initial human capital), and low gradient land population density (i.e., urbanization) in the current year.
The main variable of interest, β 4, is the interaction between 1876 per capita bond values (a.k.a., credit supply) and 1885 per capita railway stations (a.k.a., credit demand). We interpret the coefficient β 4 > 0 as implying that the effect of credit supply on prefectural economic development is exacerbated if the prefecture has railway access. We then compute the total effect of credit supply for the average prefecture with the average number of railway stations on ouptut growth all in per capita and constant yen terms. Finally, we run this regression for different time periods, from the short run (1874–1890) through the long run (1874–1940) and intervening years.Footnote 29 Since our base year of 1874 precedes the bond issue, our model can identify the change in growth due to that shock. We expect that the effect of the credit supply shock on GPP growth per capita attenuates over time, varies by sector, and differs by early rail access.
We are also interested in the possible effect of credit supply and market access on the structural transformation of Japan. In order to perform this complementary exercise, we run the following regression,
 $$\eqalign{ & \Delta LaborRati{o_{12it}} = {\beta _0} + {\beta _1}*LaborRati{o_{12it - 1}} + {\beta _2}*Bon{d_{i0}} + {\beta _3} \cr & *Station{s_{i1}} + {\beta _4}*Bon{d_{i0}}*Station{s_{i1}} + {\delta _t} + {e_{it}} \cr}$$
where ΔLabourRatio 12it is the change in the ratio of the labor force for one sector over another for all three sectoral combinations. Included covariates are the same as in the previous model, with lag term for labor force ratio capturing earlier reallocation. As with our output model, we interpret a positive average total effect from per capita bond value as facilitating the transition between the numerator sector relative to that in the denominator and show results for the three possible combinations. These regressions are run for each subperiod up through the entire period between 1874–1940. Per earlier scholarship (Fukao et al. Reference Fukao, Bassino, Makino, Papryzycki, Settsu, Takashima and Tokui2015; Fukao and Paul Reference Fukao and Paul2017; Tang Reference Tang2014), we expect high values of bonds per capita and rail access to facilitate movement away from the primary sector into the other two sectors.
RESULTS
Output Growth
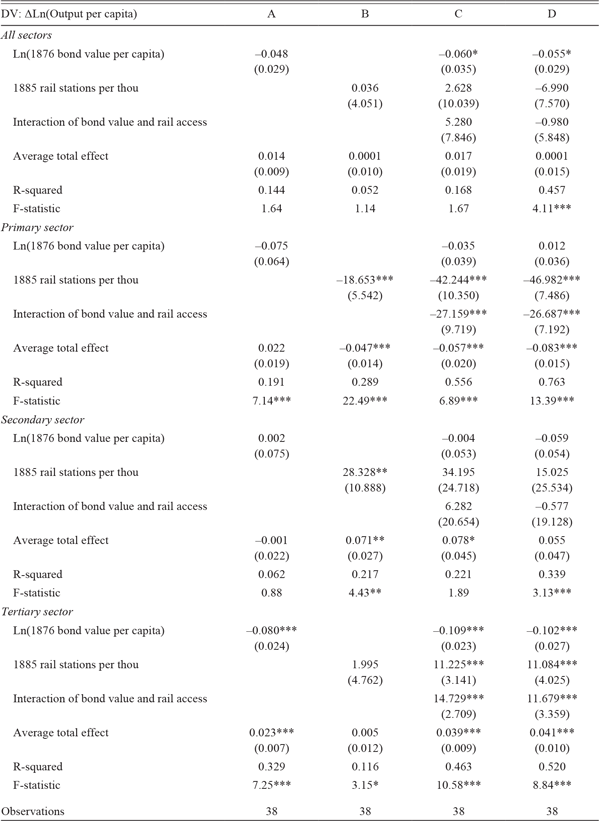
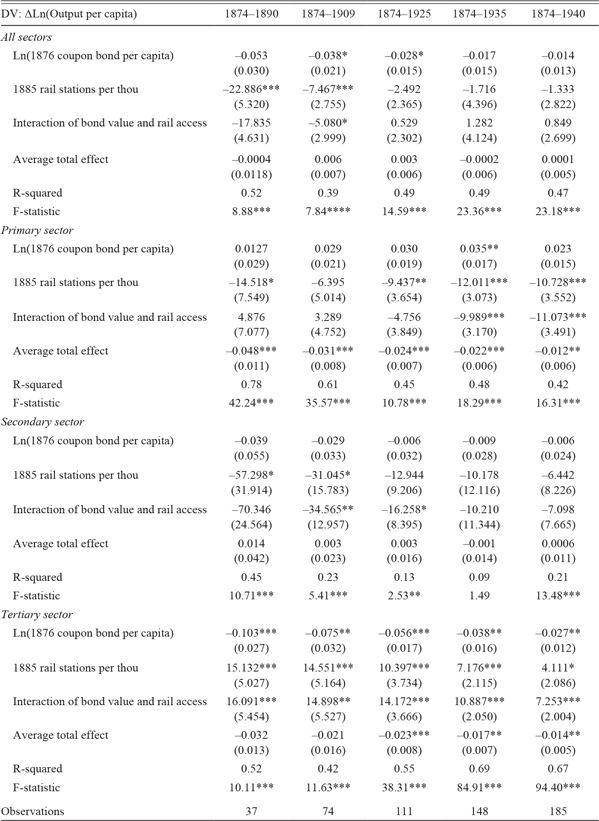
To generalize the economic effects to output as a whole as well as to examine how credit supply was used over time, we examine prefectural per capita output growth over the short and long run and include the adoption of railways. Table 5 provides results for the first period 1874–1890, starting with individual control variables for per capita bond value and rail stations, and then adding their interaction term and additional prefectural controls. In other words, these specifications decompose the effect from the credit supply shock (i.e., bonds per capita in 1876) from the market access shock (i.e., per capita rail stations in 1885) and their interaction. In the top panel, there is no statistically significant relationship between overall output growth and the included variables across most of the specifications as the F-statistic is not significant. Only with the full complement of control variables in the last column is there a meaningful relationship, with per capita bond value negative and significant at the 10 percent level. However, when we take into account the inclusion of per capita rail stations and their interaction (i.e., the average total effect), there is no overall joint significance.Footnote 30
BOND VALUE OUTPUT GROWTH REGRESSIONS, 1874–1890

* = Significant at the 10 percent level.
** = Significant at the 5 percent level.
*** = Significant at the 1 percent level.
Notes: Robust standard errors in parentheses. All specifications include year dummies and a lagged output growth variable and exclude the nine prefectures with missing bond data; Column D includes time-varying control variables of population, per capita student enrollment share, and low gradient land population density. Bond values and gross prefectural product per capita in 1934–1936 constant yen. Average total effect is the predicted effect for the prefecture with the average value of bonds per capita (Column A); the average number of railway stations per capita (Column B) and both of them (Columns C and D). The average of ln(1876 bond value per capita) is –0.292, the average number of railway stations per capita (in thousands) is 0.0025.
Sources: See the text for details and Table 2.
The remaining panels perform the same decomposition exercise for the three sectors of the economy. For the primary sector, per capita bond value by itself does not have any significant impact on primary sector output growth (Column A). However, when interacted with per capita railways stations (Columns C and D), the coefficient is negative, indicating that conditional on early rail access higher per capita bond value reduces primary sector output growth. Moreover, this effect is observed even considering the component terms of the interaction, with a negative and significant effect up to the year 1925 as shown in the average total effect.
When we repeat this exercise for the secondary sector, we do not find significant effects from either bond value or rail stations per capita. While Column C does show a slight positive net growth effect, this becomes insignificant once urbanization and initial human capital are included as covariates (Column D). This suggests that conditional on existing levels of development, the credit shock and market access variables do not contribute to short-term growth. These additional covariates may in turn reflect selective labor mobility (e.g., skill, age) between prefectures, activist regional policies, the activities of local merchants and farmers, or prefecture-specific characteristics not captured by the credit shock. Since the bond value per capita variable is cross-sectional and at the prefecture level, we are unable to include a separate prefecture dummy and, thus, cannot account for these other factors.Footnote 31
The bottom panel reports the coefficients for the regression on tertiary sector output growth. Note that we obtain the opposite results compared to those for primary production, which may account for the lack of an average total output growth effect in the top panel. For each of these two sectors, the signs on the coefficients for rail access and its interaction with bonds are the same (negative-negative for primary, positive-positive for tertiary), suggesting a complementarity of credit demand and supply. These results also underscore the redistributive effects of the credit supply shock: given early access to railways, areas with higher bond value per capita experienced higher (lower) growth in tertiary (primary) output. An average total effect is also observed for all periods up to 1925, but positively signed for tertiary production.
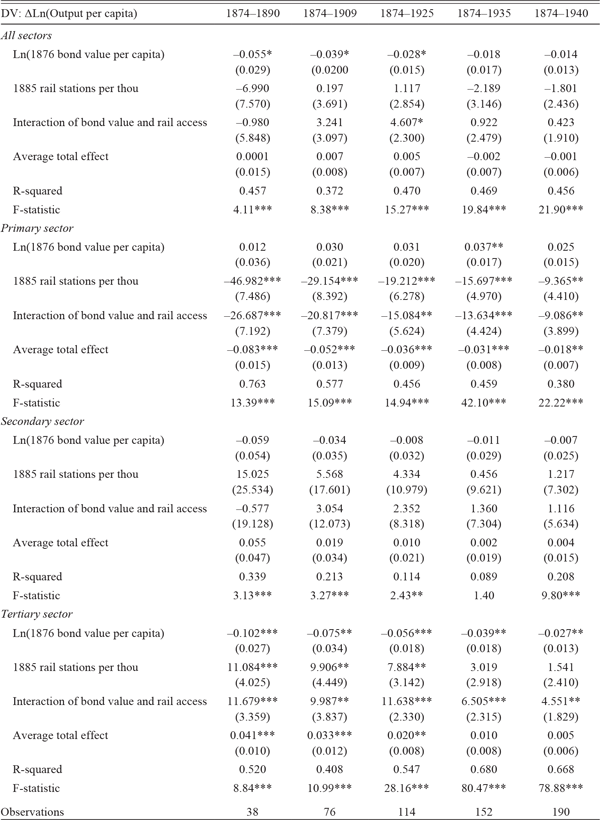
The full set of period regressions is shown in Table 6, starting with 1874–1890 and expanding to each subsequent year of available data (up to 1940).Footnote 32 There are four results to highlight:
(1) There is no significant effect from the interaction of the credit supply shock and market access on aggregate output growth in any period.
(2) There is a significant effect on the redistribution of output between prefectures and sectors. The average total effect is negative and significant in the first three periods up to the year 1925 for the primary sector while the opposite sign is observed for the same duration in the tertiary sector. Furthermore, for the subset of prefectures that gained early rail access, the coefficients on the interaction between bond value and rail stations are similar to the average total effects for the primary and tertiary sectors, respectively, but in all periods.
(3) The redistributive effects of both credit supply and market access persist through most of our periods of analysis and gradually attenuate over time. This can be seen in both the magnitudes of the coefficients on the interaction of bond value and rail stations as well as in the average total effect. For the latter, the cumulative effect of bonds and railways is associated with a decline in the primary sector ranging from –0.083 (Column 1, 1874–1890) to –0.018 (Column 5, 1874–1940). For the tertiary sector, the positive growth effect starts with 0.041 (1874–1890) and persists for another three decades to 0.020 (1874–1925).
(4) Related to the previous point, the effect from the credit supply shock grows in importance over time relative to the market access effect for both the primary and tertiary sectors, and persists in significance longer in the latter. This can be observed in the declining absolute magnitude of the coefficient on rail stations for both sectors. Our interpretation is that this indicates railways by themselves were not solely responsible for the redistribution of activity across regions in Japan and worked with the credit supply shock to generate the long-run impact.
BOND VALUE OUTPUT GROWTH REGRESSIONS, ALL PERIODS

* = Significant at the 10 percent level.
** = Significant at the 5 percent level.
*** = Significant at the 1 percent level.
Notes: Robust standard errors in parentheses. All specifications include time-varying control variables of population, per capita student enrollment share, and low gradient land population density, year dummies, and a lagged output growth variable, and exclude the nine prefectures with missing bond data. Bond values and gross prefectural product per capita in 1934–1936 constant yen. Average total effect is the predicted effect for the prefecture with the average value of bonds per capita and the average number of railway stations per capita. The average of ln(1876 bond value per capita) is –0.292, the average number of railway stations per capita (in thousands) is 0.0025.
Sources: See the text for details and Table 2.
Robustness Checks
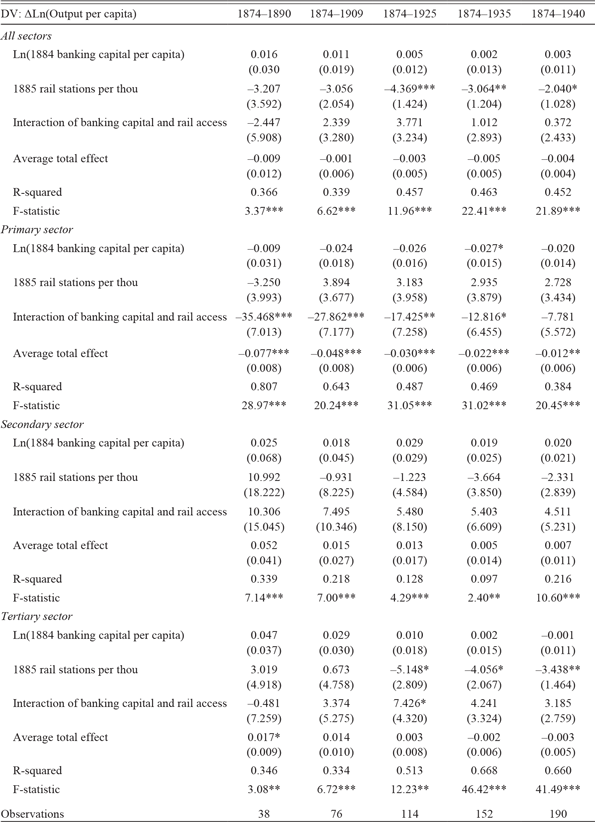
Before looking at the impact on labor shares, we first examine a more direct channel of finance, banking capital, on real output growth. In our theoretical discussion, we emphasized the development of financial institutions as the most likely mechanism through which bonds could affect economic activity. According to this narrative, we should find similar results when using total banking capital per capita instead of bond value per capita in our regressions. That said, there are two limitations to this approach. First, total banking capital (85.2 million yen) represented less than half of all bond value (173.8 million yen), and samurai ownership of this banking capital was less than one-sixth (30.7 million yen). Second, banking capital is already included in the tertiary sector and not further separable in the data from other subsectors. Therefore, we would expect that total banking capital had a negative effect on primary sector growth and a muted or insignificant effect on tertiary sector growth, which is indeed what we find.
Table 7 reports the coefficients on the same regressions as in Table 6 but with total banking capital per capita in 1884 instead of bond value per capita in 1876. One parallel between the two measures of financial capital is that banking capital per capita also did not have any effect on overall output growth across periods. Moreover, the quantitative effect of total bank capital on primary sector output growth is similar both in the marginal effect from the interaction term and in the average total effect. The main difference with the previous table is that since banking capital is already included in the tertiary sector, we fail to observe a positive effect on the tertiary sector growth. Our interpretation is that while the bonds were important for establishing many national banks, other banks and banking capital were more equitably distributed regardless of samurai presence. Nevertheless, these results are consistent with the view that financial development, including the extensive growth of intermediaries and direct investment into enterprises with an alienable financial instrument (Tang Reference Tang2013), facilitated sector reallocation and that the catalyst was the samurai stipend commutation into bonds.
BANKING CAPITAL REGRESSIONS, ALL PERIODS

* = Significant at the 10 percent level.
** = Significant at the 5 percent level.
*** = Significant at the 1 percent level.
Notes: Robust standard errors in parentheses. All specifications include time-varying control variables of population, per capita student enrollment share, and low gradient land population density, year dummies, and a lagged output growth variable, and exclude the nine prefectures with missing bond data. Bank capital and gross prefectural product per capita in 1934–1936 constant yen. Average total effect is the predicted effect for the prefecture with the average value of banking capita per capita and the average number of railway stations per capita. The average of ln(1884 banking capital per capita) is 0.211, the average number of railway stations per capita (in thousands) is 0.0025.
Sources: See the text for details and Table 2.
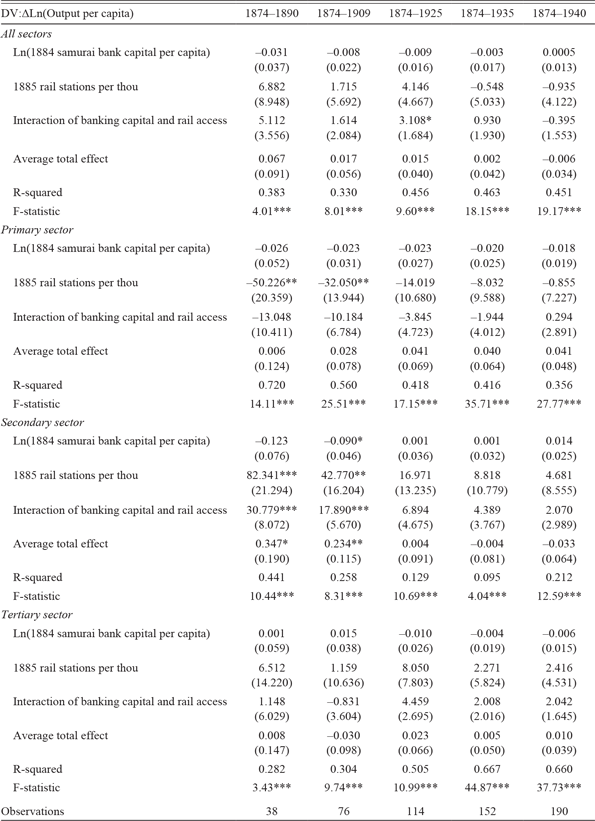
As discussed earlier, there exist opposing views on the role of samurai (e.g., entrepreneurs, political leaders) on the industrialization process of Japan. Even though resolving this debate is outside the scope of this article, we can contribute by analyzing the effect of banking capital owned by samurai. To do so, we use the share of national bank capital ownership by samurai to construct a samurai bank capital measure and use that instead of bond value per capita. The aforementioned pairwise correlation between per capita bond value and per capita national bank capital by prefecture is 0.80 and is significant to the 1 percent level.Footnote 33 Using the samurai ownership share of national banks allows us to investigate whether prefectures dominated by banks owned by samurai exhibited different patterns from the other prefectures in real output growth.Footnote 34
Table 8 reports the coefficients from this exercise, and the results from this table along with our bond per capita analysis are consistent with both sides of the samurai contribution debate. On the one hand, we can observe that prefectures with higher samurai bank capital did not experience higher overall growth in any of the subperiods, which supports the revisionist view that the activities of samurai-dominated banks were not disproportionate to the rest of the financial sector (Yamamura Reference Yamamura1967). Moreover, we do not find any significant effect on the primary or tertiary sectors, suggesting that samurai ownership of these banks was not associated with sectoral reallocation, which again is consistent with the view that at least some of these banks were used as political instruments instead of profitmaking ventures, which we discuss further.
SAMURAI BANK CAPITAL REGRESSIONS, ALL PERIODS

* = Significant at the 10 percent level.
** = Significant at the 5 percent level.
*** = Significant at the 1 percent level.
Notes: Robust standard errors in parentheses. All specifications include time-varying control variables of population, per capita student enrollment share, and low gradient land population density, year dummies, and a lagged output growth variable, and exclude the nine prefectures with missing bond data. Samurai-owned national bank capital and gross prefectural product per capita in 1934–1936 constant yen. Average total effect is the predicted effect for the prefecture with the average value of samurai bank capital per capita and the average number of railway stations per capita. The average of ln(1884 samurai bank capital per capita) is –2.44, the average number of railway stations per capita (in thousands) is 0.0025.
Sources: See the text for details and Table 2.
On the other hand, we do find that output in the secondary sector grew faster in prefectures with higher samurai bank capital, but only in the pre-WWI period. This may be explained by the timing: financial intermediaries facilitated the establishment of modern industries, and the national banks were the progenitors of the Japanese financial system (Tang Reference Tang2013). These banks, however, needed the financial capital that was only available once the bonds were issued to the ex-samurai, which explains the difference in secondary versus tertiary sector growth in Tables 6 and 8.
As in our previous results, the positive effect of samurai bank capital hinges on early access to the national rail network, our measure of market access, and this effect was persistent up to 1909, similar to the average total effect. These findings suggest that industrial activity increased in prefectures where ex-samurai managed to concentrate more resources in national banks and also had rail transport, but not in other sectors nor when total banking capital or the full value of bonds are considered. Further support of the relative importance of market access over samurai bank ownership in manufacturing, the coefficient on the latter variable itself is negative in the first two periods (and weakly significantly so between 1874–1909). Better disentanglement of samurai bank ownership and rail access, however, is not possible since the 1876 bond conversion and expansion of the rail network overlap within the first two benchmark years of the output data.
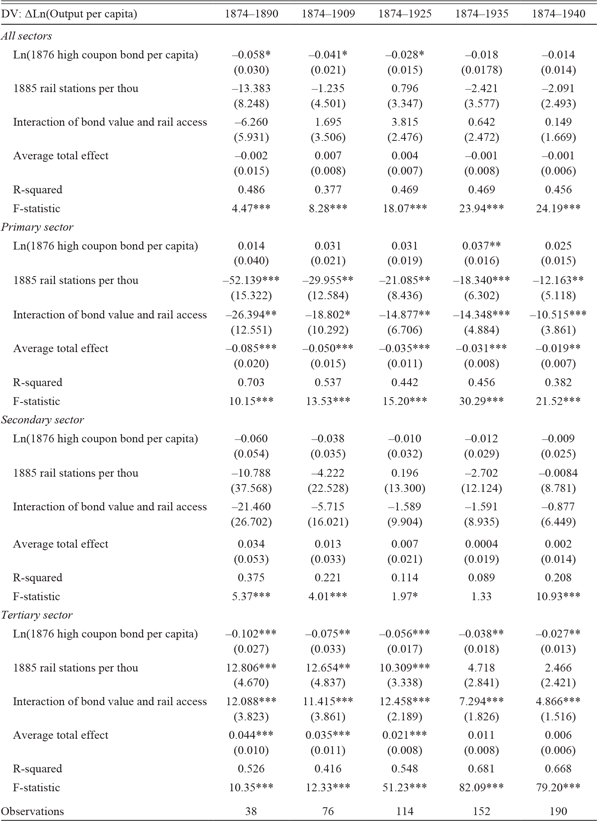
Another related concern with our results is that the distribution of wealthy versus poor samurai among prefectures is uneven, with Tokyo as an extreme example (cf. Table 2). This is due to the 5 percent coupon bonds, of which former samurai living in Tokyo received 96 percent of the national total. Removing these bonds from the total bond value mitigates this bias (i.e., Tokyo’s bond value share falls to 7 percent of the total value of bonds) and clarifies whether the redistributive effect generalizes across our sample of prefectures or if wealth concentration among a small group of affluent samurai is driving our results.
Table 9 reports the coefficients of running our baseline specifications with high coupon bond value per capita (i.e., excluding 5 percent bonds) instead of total bond value per capita. The coefficients are similar both qualitatively and quantitatively to our baseline specification in Table 6. We observe that as before the credit supply shock had a redistributive effect both among prefectures and major sectors. That is, areas with more bond value per capita and early access to railways experienced faster growth in tertiary output and slower growth in primary output, and, thus, the bonds of non-wealthy samurai across all regions, including Tokyo, exhibited the same patterns by sector and over time.Footnote 35
HIGH COUPON BOND VALUE REGRESSIONS, ALL PERIODS

* = Significant at the 10 percent level.
** = Significant at the 5 percent level.
*** = Significant at the 1 percent level.
Notes: Robust standard errors in parentheses. All specifications include time-varying control variables of population, per capita student enrollment share, and low gradient land population density, year dummies, and a lagged output growth variable, and exclude the nine prefectures with missing bond data. High coupon bond values (6 percent or more) and gross prefectural product per capita in 1934–1936 constant yen. Average total effect is the predicted effect for the prefecture with the average value of high coupon bonds per capita and the average number of railway stations per capita. The average of ln(1876 high coupon bond value per capita) is –0.34, the average number of railway stations per capita (in thousands) is 0.0025.
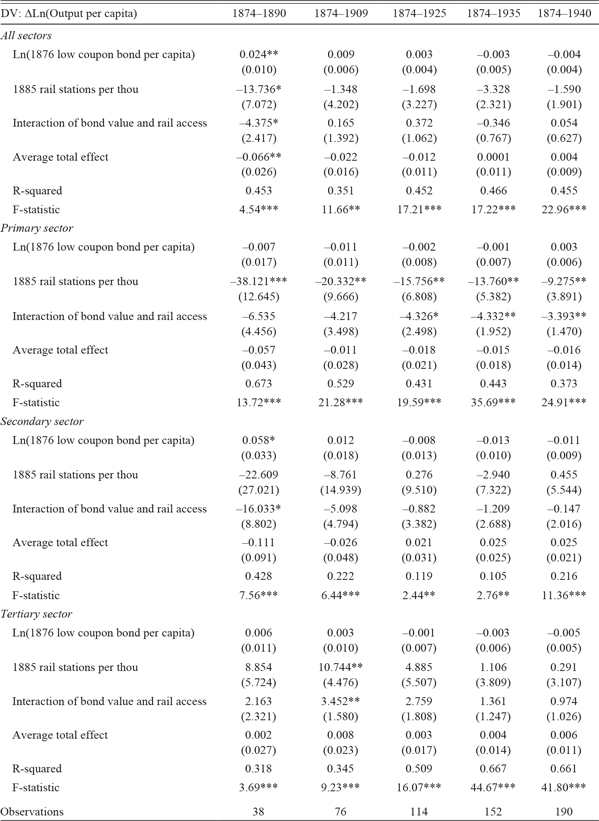
In contrast, the estimates from Table 10 that use only the low coupon bond value per capita (i.e., 5 percent bonds) show a remarkably different pattern. In the top panel that combines all sectors, there is a negative growth effect in the first period (1874–1890), which is the only statistically significant result for average total growth in any of our specifications or periods of analysis. Bond value per capita itself is positive, but the impact from early rail access is negative; the latter relationship may owe to agglomeration effects in prefectures that gain rail access but lose industrial activity (Tang Reference Tang2014). As the time frame lengthens, the average total effect becomes positive but weakens to statistical insignificance. We interpret this result as indicative of concentrated bond wealth not being growth enhancing per se, since the largest share of these low coupon bonds were held in Tokyo and channeled into politicized banks (e.g., the Fifteenth National Bank). The major leading industries in the pre-war period, on the other hand, were in railways and textiles and neither relied on bank finance as much as other sectors.
LOW COUPON BOND VALUE REGRESSIONS, ALL PERIODS

* = Significant at the 10 percent level.
** = Significant at the 5 percent level.
*** = Significant at the 1 percent level.
Notes: Robust standard errors in parentheses. All specifications include time-varying control variables of population, per capita student enrollment share, and low gradient land population density, year dummies, and a lagged output growth variable, and exclude the nine prefectures with missing bond data. Low coupon bond values (5 percent) and gross prefectural product per capita in 1934–1936 constant yen. Average total effect is the predicted effect for the prefecture with the average value of high coupon bonds per capita and the average number of railway stations per capita. The average of ln(1876 low coupon bond value per capita) is –2.04, the average number of railway stations per capita (in thousands) is 0.0025.
The sectoral breakdowns also differ, with the results in the secondary sector showing similar patterns to those in the top panel. In particular, the coefficient on bond value per capita itself is positive and weakly significant, but the interaction with rail stations is negative. This suggests a lack of industrial development in the short run in areas with both, that is, Tokyo. This result may appear inconsistent with the earlier estimates showing samurai bank ownership being conducive to early growth in the secondary sector (Table 8), but samurai bank ownership was much more widely dispersed compared to prefectures receiving 5 percent bonds and banks were likely to invest in non-financial activities, while the samurai bonds were used to establish the banks themselves. Another possible explanation is that even if Tokyo had the highest amount of low coupon bonds, it was not the center of commercial and merchant activity in the early Meiji period. This is illustrated by Osaka, which received much less in total bond value (and no 5 percent bonds), but was the center of the nascent cotton spinning industry that would soon spearhead Japan’s industrial development and exports.
For the other sectors, the primary sector experiences large declines in growth in areas with larger bond value and rail stations per capita, but this is observed only with longer time windows. The tertiary sector, unlike in earlier tables, does not generally show growth from both bond value and rail access except in the second window (1874–1909). Since many of the wealthiest ex-samurai (i.e., daimyo) invested their bonds in the Fifteenth National Bank based in Tokyo and this bank was used by the government for political purposes (Shizume and Tsurumi Reference Shizume and Tsurumi2016; Yamamura Reference Yamamura1967), it is possible that the lack of growth may be attributed to non-profitable lending or investments in less risky ventures similar to the behavior of larger Japanese firms like the zaibatsu conglomerates (Tang Reference Tang2011).
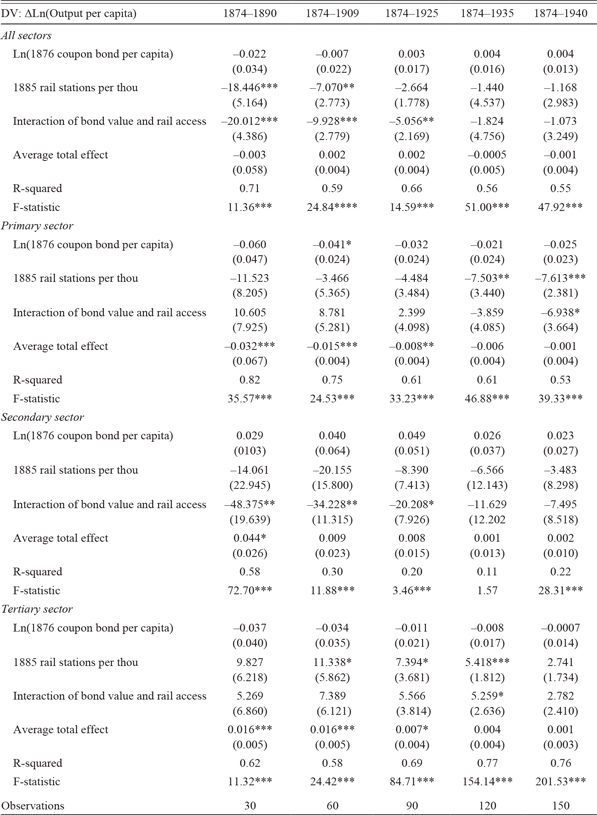
Since Tokyo appears as an outlier in the value of bonds issued, the type of bonds, and its early access to railways, a reasonable robustness check is to exclude it. Table 11 shows the results that use the same specification excluding Tokyo from our sample. As these estimates indicate, removing Tokyo does not qualitatively change the results reported earlier, although the magnitudes are smaller. As before, there is no average growth effect when pooled across all three sectors, but the same redistribution between sectors appears with areas that have higher bond value per capita and earlier rail access declining in the primary sector and growing in the tertiary. The main difference is that the redistribution occurs later and becomes more pronounced for the primary sector (i.e., significant and increasingly negative coefficients on the interaction term in the last two periods) while the opposite is true for the tertiary sector.
BOND VALUE OUTPUT GROWTH REGRESSIONS EXCLUDING TOKYO, ALL PERIODS

* = Significant at the 10 percent level.
** = Significant at the 5 percent level.
*** = Significant at the 1 percent level.
Notes: Robust standard errors in parentheses. All specifications include time-varying control variables of population, per capita student enrollment share, and low gradient land population density, year dummies, and a lagged output growth variable, and exclude the nine prefectures with missing bond data. Bond values and gross prefectural product per capita in 1934–1936 constant yen. Average total effect is the predicted effect for the prefecture with the average value of bonds per capita and the average number of railway stations per capita excluding Tokyo. The average of ln(1876 bond value per capita) is –0.36, the average number of railway stations per capita (in thousands) is 0.0023.
Sources: See the text for details and Table 2.
The average total effect from the credit supply shock for these two sectors show consistent shrinkage over time, suggesting disproportionate tertiary sector losses in prefectures with both low bond values and later (or no) rail access. Since the results including Tokyo show no shrinkage in the tertiary sector over the same periods, it may be that much of this sector’s growth was localized to Tokyo in the interwar period while the pre-WWI period had more generalized growth in other prefectures.
For additional robustness, we test whether excluding not only Tokyo but also Osaka and the prefectures surrounding these two major metropolitan areas change our observed effects.Footnote 36 Compared to just excluding Tokyo, this does not appear to be the case. While the number of prefectures in the sample drops from 37 (Table 11) to 30 (Table 12), there is no observed shrinkage in the tertiary sector for the full period up to 1940. For the first three periods up to 1925, the tertiary sector shows generalized growth in the average total effect of the credit supply shock and the opposite for the primary sector. These results are consistent with those for the total sample of prefectures in Table 6 and corroborate our interpretation that the credit supply shock had a nationwide effect on sector redistribution.
BOND VALUE OUTPUT GROWTH REGRESSIONS EXCLUDING METROPOLITAN AND ADJACENT PREFECTURES, ALL PERIODS

* = Significant at the 10 percent level.
** = Significant at the 5 percent level.
*** = Significant at the 1 percent level.
Notes: Robust standard errors in parentheses. All specifications include time-varying control variables of population, per capita student enrollment share, and low gradient land population density, year dummies, and a lagged output growth variable, and exclude the nine prefectures with missing bond data as well as Tokyo, Osaka, and prefectures sharing land borders with them. Bond values and gross prefectural product per capita in 1934–1936 constant yen. Average total effect is the predicted effect for the prefecture with the average value of bonds per capita and the average number of railway stations per capita excluding Tokyo, Osaka, and their adjact prefectures. The average of ln(1876 bond value per capita) is –0.13, the average number of railway stations per capita (in thousands) is 0.0020.
Sources: See the text for details and Table 2.
Rail stations per capita are also not systematically associated with total economic growth (top panel) and may have exacerbated agglomeration of economic activity to the excluded prefectures. This is suggested by the negative coefficient on both the rail stations per capita variable and the interaction term with bond value up to 1925. The interaction term also lacks significance for both the primary and tertiary sectors, which may not be surprising since the excluded prefectures are those that gained rail access earliest due to promixity to Tokyo and Osaka.
Two additional points should be clarified regarding the interpretation of our results. The first is that the results may overstate the role of the credit supply shock, when in fact pre-existing differences between prefectures may be responsible for post-bond issue growth trends or the allocation of the bonds themselves. While data limitations prevent us from performing a pre-trend analysis of prefectural activity since there is only one year of data (1874) before the stipend conversion, our pre-level analysis indicates that there were no statistically significant differences in prefectural per capita output given future per capita bond values and early rail access, even after including observables in 1874 like population and urbanization. This is supported by a lack of statistical significance in the pairwise correlation of 1874 per capita output and 1876 per capita bond values, which suggests the prefectural differences observed in subsequent periods post-date the 1874 output data.
Secondly, whether one can attribute the sectoral growth effects to the credit supply shock as opposed to the introduction of the railways is not immediately obvious given the coefficients for the latter are typically large in magnitude and statistically significant. It is true that the individual contribution of per capita bond value is not statistically significant (or opposing in sign) in many specifications, but the interaction with per capita rail stations corresponds in sign and significance with rail access on its own. Moreover, the magnitude of the interaction term’s coefficient increases relative to that for rail access, and in the tertiary sector remains significant when the coefficient for railway access itself is not. As discussed earlier, since the introduction of railways occurred nearly simultaneously as the credit supply shock, and the first two benchmark years (1874, 1890) effectively span both policy changes, our emphasis has been on the joint significance of both the bond issue and early market access.
Structural Transformation
Several studies have emphasized the barriers to structural transformation as the reason why the Japanese economy started its industrialization process later than other economies (e.g., Fukao and Paul Reference Fukao and Paul2017). Some specific limits to this structural transformation include legal constraints that limited urban emigration (Hayashi and Prescott Reference Hayashi and Prescott2008) or geographical constraints that determined the location of economic activity (Davis and Weinstein Reference Davis and Weinstein2002).
In this section we analyze whether the shock to credit supply and market access contributed to the structural transformation of the pre-war Japanese economy. There exist large literatures emphasizing the separate roles of financial frictions and transport infrastructure on the allocation of factors (e.g., Banerjee and Duflo Reference Banerjee and Duflo2014; Atack, Haines, and Margo Reference Atack, Haines and Margo2008; Atack et al. Reference Atack, Bateman, Haines and Margo2010), specifically labor. Thus, we would expect that the credit supply shock conditional on rail access facilitated the reallocation of labor from the primary to the secondary and tertiary sectors.
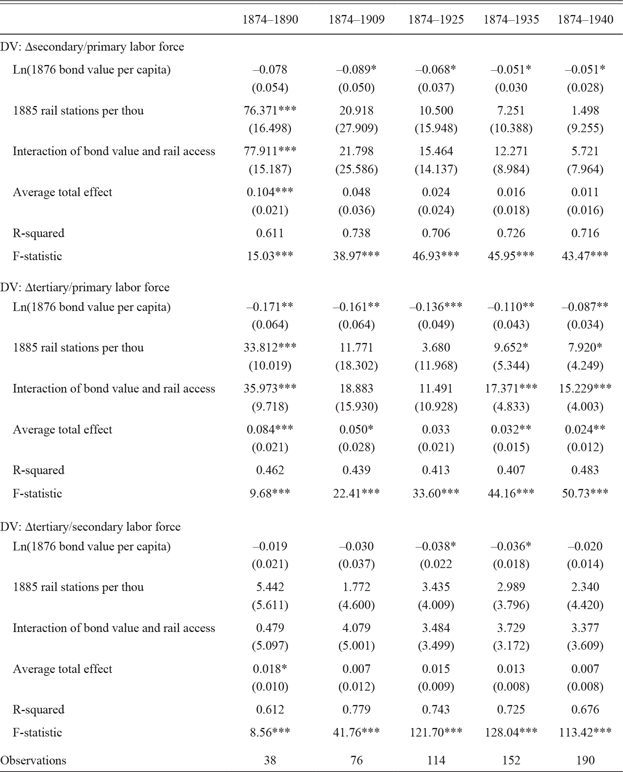
Table 13 reports the coefficients of running Equation (2). It is the same model specification as the one used earlier for output growth but with the dependent variable measured as the change in the labor ratio between two sectors. The three panels show the results from the three combinations of primary, secondary, and tertiary sectors, and we interpret a positive sign on a coefficient as evidence that this variable contributed to structural transformation. For example, in the top panel comparing secondary to primary sector labor, the coefficient on the interaction term is positive and statistically significant. This implies that prefectures with higher bond value per capita and early rail access had greater reallocation of workers from the primary to the secondary sector. Although the interaction is positive in all subperiods, it is only statistically significant between 1874–1890. This result is a slight departure from that using output growth since the secondary sector experienced little change from the credit shock and railway access. It may be explained, however, given that manufacturing and exports thereof did not reach 10 percent of total national output or exports until the 1890s (Perkins and Tang Reference Tang2017; Meissner and Tang Reference Meissner and Tang2018), but labor mobility significantly increased within and between regions (Tang 2018).
LABOR SHARE GROWTH REGRESSIONS BY BOND VALUE, ALL PERIODS

* = Significant at the 10 percent level.
** = Significant at the 5 percent level.
*** = Significant at the 1 percent level.
Robust standard errors in parentheses. All specifications include time-varying control variables of population, per capita student enrollment share, and low gradient land population density, year dummies, and a lagged labor share ratio variable, and exclude the nine prefectures with missing bond data. Bond values in 1934–1936 constant yen. Average total effect is the predicted effect for the prefecture with the average value of bonds per capita and the average number of railway stations per capita. The average of ln(1876 bond value per capita) is –0.292, the average number of railway stations per capita (in thousands) is 0.0025.
Sources: See the text for details and Table 2.
In the middle panel, the dependent variable is the change in the ratio between labor in the tertiary and primary sectors. The coefficient on the interaction term is positive and usually statistically significant. This positive coefficient indicates that the shock in credit supply and presence of rail stations were associated with a decline in the primary sector labor force relative to that in the tertiary sector, and this effect is fairly persistent over time even as it decreases in magnitude. The statistical significance of the reallocation between these sectors compared with the secondary sector is consistent with our findings on output growth.
Finally, in the bottom panel the dependent variable is the change in the ratio between labor in the tertiary and secondary sector. This variable does not have a direct implication for structural transformation but we include it for completeness. The coefficient on the interaction term is positive but not statistically significant in any of the subsamples. This result implies that the shock to credit supply given rail access did not have a significant effect on the reallocation of labor between the secondary and tertiary sector.
To summarize, the results presented in this section indicate that the shock to credit supply is associated with the structural transformation of the Japanese economy. Similar to the results on output growth, the effect of credit supply is somewhat dependent on early access to railways, which was, in part, driven by geographical constraints. That the effect persists for so long despite the integration of labor, goods, and capital markets over these decades suggest that initial conditions at the outset of industrialization are important to growth, and that our results are consistent with existing scholarship highlighting the roles of location and path dependence (Davis and Weinstein Reference Davis and Weinstein2002).
CONCLUDING REMARKS
Studies on the impact of credit supply on economic growth usually emphasize the negative relationship with financial crises, neglecting to highlight potential short- and long-run benefits and heterogeneity between regions within a country. Moreover, the separate but equally relevant role of market access that may provide demand for available credit has largely been understated or ignored. Our analysis of a singular credit supply shock in late nineteenth century Japan indicates that there are persistent redistributive effects both between prefectures and between sectors. We find evidence that bond value per capita amplified the effects of early access to railways and generated faster output growth in the tertiary sector and slower growth in the primary sector. These effects were larger in the initial period (1874–1890) and attenuated over time up to 1940. We find analogous results for the reallocation of labor, with the interaction of bond value per capita and rail access conducive to the structural transformation of the economy, leading to a reallocation of labor from the primary to the tertiary sector. An important contribution of our work is to emphasize the complementarity between shocks to credit supply and the initial characteristics of the country, including latent demand and market access, and underscore their persistence despite ongoing market integration and maturation.
At the same time, while our results show that the creation of the bonds in rail accessible prefectures led to tertiary sector growth and primary sector shrinkage, within the tertiary sector this may be concentrated in banking itself. Tables 7 and 8 suggest this interpretation since the use of banking capital as alternatives to the bonds, which preceded modern banking, indicate no tertiary sector growth. Thus, the credit supply shock’s impact on output may have been truly neutral on most parts of the economy since neither the secondary nor tertiary sector (minus banking) were affected, and possibly negative depending on whether it is widely disbursed (Table 7) or used for political purposes (Table 10).Footnote 37
Our results are also suggestive on the issues of how credit is channeled, which sectors benefit and when, and whether wealth concentration plays a role in development. While we have treated the samurai bonds as transferable instruments and are agnostic as to who holds them, their disposal or investment into financial institutions or direct investment was heterogenous, which we showed with some robustness checks. Samurai bond wealth via banking appeared to play a stronger role in manufacturing during the first age of globalization, when Japan was undergoing its industrialization, although this may be offset by the politicized nature of some banks and market access via railways. Sectoral output growth may lag labor reallocation, particularly in manufacturing, as wages may not rise as quickly as migration opportunities from rural areas to cities. Holders of the bonds may also matter as differences in their behavior may affect how the credit is used, with the wealthiest choosing to retain ownership despite lower interest payments and, thus, not taking advantage of profitable, but riskier, ventures with larger growth prospects. These are all clearly areas for further work, especially with an interest in the persistence of income inequality and differences in bank versus equity finance (e.g., Moriguchi and Saez Reference Moriguchi and Saez2008; Miwa and Ramseyer 2002).
Other extensions to our analysis would be to use more frequent data by year and/or a finer unit of analysis like firms. In particular, having shorter intervals during our period of analysis may allow us to be more precise in separating the credit supply and demand effects, that is, the bond issuance and the expansion of the railroad network. Similarly, an examination of Japanese firms during periods of credit abundance and scarcity during the late 1870s and early 1880s, respectively, may show more directly how capital constraints affected the concentration or competitiveness of the industries in which firms belonged. One could also examine whether credit availability and rail access influenced these firms’ ability to expand domestically or become internationally competitive and if local government policies played a role, which is missing from our current analysis. Finally, understanding the importance of international trade on rationalizing firm behavior and providing capital outside of government bonds and banking capital would be a valuable complement to our study.
Does the pre-war Japanese case generalize to other economic scenarios as well? Understandably, in the late nineteenth century the Japanese economy was fragmented and financially underdeveloped, which may account for the large observed effects. That said, the unanticipated credit supply shock was also extremely large in relative terms, and, thus, it may be unrealistic to expect similar magnitudes in a modern context. There is also unobserved heterogeneity in local politics or commercial ties that are not simply captured by one cross sectional difference in public credit supply. Nevertheless, the persistence of the impact from the bond issuance and early rail access for the entire pre-WWII period is remarkable given the rapidity of industrialization and market integration, and demonstrates that early monetary policy and infrastructure interventions can play a strong role in continued and long-run development.