INTRODUCTION
The measurement of secondary production is one of the primary goals of zooplankton research (Runge & Roff, Reference Runge, Roff, Harris, Wiebe, Lenz, Skjoldal and Huntley2000), since such population level estimations are necessary for assessments of the total community productivity (Greze, Reference Greze and Kinne1978; Kimmerer, Reference Kimmerer1987), and are also the basis for the elaboration of general theories of biological productivity (Downing, Reference Downing, Downing and Rigler1984).
Several methods for the estimation of secondary production are available (Pechen et al., Reference Pechen, Greze, Shushkina, Galkovskaya, Winberg and Winberg1971; Winberg et al., Reference Winberg, Patalas, Wright, Hillbricht-Ilkowska, Cooper, Mann, Edmondson and Winberg1971; Downing, Reference Downing, Downing and Rigler1984; Kimmerer, Reference Kimmerer1987; Omori & Ikeda, Reference Omori and Ikeda1992), and the great majority of them require information on the biomass of the individuals. Zooplankton biomass can be measured using conventional volumetric or gravimetric methods as well as by biochemical approaches (Postel et al., Reference Postel, Fock, Hagen, Harris, Wiebe, Lenz, Skjoldal and Huntley2000), although gravimetric dry mass determination is one of the most widely used (Beers, Reference Beers1966; Lovegrove, Reference Lovegrove and Barnes1966; Omori, Reference Omori1978; Hay, Reference Hay1984; Giguère et al., Reference Giguère, St Pierre, Bernier, Vézina and Rondeau1989; Bradford-Grieve et al., Reference Bradford-Grieve, Murdoch, James, Oliver and McLeod1998).
Dry mass determinations of zooplanktonic species is time consuming, involving the labour-intensive tasks of sorting, identification and accurately measuring the different developmental stages of the species present in the plankton. With sufficient material of a particular species and/or stage available, strong regression equations relating body measurements and mass can be established for easier assessment of biomass (Bird & Prairie, Reference Bird and Prairie1985).
Species specific length–dry mass relationships are available for several copepod species from a range of environments and geographical locations (Landry, Reference Landry1978; Pearre, Reference Pearre1980; Uye, Reference Uye1982; Uye et al., Reference Uye, Iwai and Kasahara1983; McCauley, Reference McCauley, Downing and Rigler1984; Middlebrook & Roff, Reference Middlebrook and Roff1986; Chisholm & Roff, Reference Chisholm and Roff1990; Webber & Roff, Reference Webber and Roff1995; Hopcroft et al., Reference Hopcroft, Roff and Lombard1998; Ara, Reference Ara2001). No similar data are available, however, for barnacle larvae which are accepted to be a major component of the coastal meroplankton community, and adults of the species in this study, Austrominius modestus (Darwin), Amphibalanus improvisus (Darwin), Balanus crenatus Bruguière, Semibalanus balanoides (L.) and Verruca stroemia (O.F. Müller) are commonly found in the Solent and along the central English Channel coastline (Herbert, Reference Herbert2001; Herbert et al., Reference Herbert, Southward, Sheader and Hawkins2007; Herbert & Muxagata, Reference Herbert and Muxagata2009).
Barnacle larvae are, in fact, the second most abundant group within the zooplankton of Southampton Water, averaging 13% of the total zooplankton population, and accounting for up to 60–80% on some occasions (Muxagata et al., Reference Muxagata, Williams and Sheader2004; Muxagata, Reference Muxagata2005). The present study presents body mass and species-specific length–mass regression equations for the five most common barnacle larvae found in zooplankton catches within Southampton Water.
MATERIALS AND METHODS
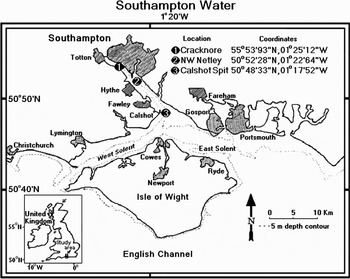
Samples used in this study were collected at three fixed sites, marked by permanent shipping buoys within Southampton Water and the central Solent (Figure 1) in March 2001, April 2001, May 2001, June 2001, August 2001, April 2002 and July 2002 as part of a wider study focused on zooplankton secondary production (Muxagata, Reference Muxagata2005). The stations were sampled during the extended 2–3 hour period of slack water around high tide, characteristic of Southampton Water, previous studies (Mujica, Reference Mujica1999) having established that barnacle larvae were more common in the water column during slack-ebb tide. Samples from quantitative, oblique tows of ~50 m3 performed with a conventional 120-μm mesh cod-end plankton net were collected and preserved in 4% formaldehyde–seawater buffered with borax (Steedman, Reference Steedman1976). No significant differences were noted in the pattern of carapace width (CW) and total length (TL) measured at each site (Muxagata, Reference Muxagata2005), and data presented in this study are from single site samples.
The Southampton Water study area, with indication of sampling sites during 2001–2002.

Cirripedia were identified to species level (Bassindale, Reference Bassindale1936; Pyefinch, Reference Pyefinch1948, Reference Pyefinch1949; Knight-Jones & Waugh, Reference Knight-Jones and Waugh1949; Jones & Crisp, Reference Jones and Crisp1954; Crisp, Reference Crisp1962; Lang, Reference Lang1980; Branscomb & Vedder, Reference Branscomb and Vedder1982; Lee et al., Reference Lee, Shim, Jee, Ryu, Kim and Kim1998), and were sorted to larval stage in accordance with the definitions presented in Lang (Reference Lang1979). Additional information on the study area and collection/processing protocols can be found in Muxagata et al. (Reference Muxagata, Williams and Sheader2004), Muxagata (Reference Muxagata2005) and Williams & Muxagata (Reference Williams and Muxagata2006).
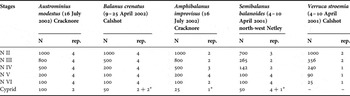
For dry mass (DM) determinations, between 25 cypris and up to 4000 nauplii of a particular size/stage (Table 1), were sorted from the samples after at least 1 year of preservation to allow necessary time for the individuals to reach equilibrium volume and weight (Ahlstrom & Thrailkill, Reference Ahlstrom and Thrailkill1963; Beers, Reference Beers and Steedman1976, Reference Beers and Boltovskoy1981). Pre-counted batches of 25–1000 nauplii, from a single day or from consecutive samples in the same month (Table 1) and 25–100 cypris of similar sizes from different days (Table 1) were concentrated and pipetted, together with 200–400 µl of the preserving fluid, into 4 ml of de-ionized water for dilution of salts and preserving fluids. After repeating the dilution procedure a second time, the sample was then pipetted into pre-weighed and ashed aluminium vessels of ±200 µl. After the animals settled, as much of the surrounding liquid was removed as possible with a fine pipette. Each sample was oven dried for 16–24 hours at 60°C, and transferred to silica gel desiccators for cooling (Lovegrove, Reference Lovegrove and Barnes1966; McCauley, Reference McCauley, Downing and Rigler1984) before weighing on a Mettler MT 5 (±1 µg) balance to determine the DM. Weighing was repeated until reaching stable readings.
Number (N) of nauplii and cyprids from a particular sampling site and date of collection that were used in each biomass determination, with rep. indicating the number of replicates made for each determination.

Note: the + sign indicates that replicates with cyprids with two different sizes were utilized due to relatively larger individuals found through the season (see different sizes in Table 3); *, for B. crenatus cyprids from 22 June 2001 from Calshot and 9–25 April 2002 from north-west Netley were used; for S. balanoides cyprids from 23 March 2001, 4–10 April 2001 and 18 May 2001 from Cracknore and north-west Netley were used; for A. improvisus cyprids from 20 August 2001 were used.
Blanks were made with ±200 µl of the last dilution solution of four different batches, and they averaged ±9.2% of the sample mass. Since the amount of surrounding liquid on each determination was variable, but always less than 200 µl, it was decided not to apply any correction. To estimate the effect of preservation on dry mass, the same procedure was applied to freshly-caught, late-stage larvae of A. modestus, specifically naupliar stages V and VI and cypris of the same sampling day of the preserved specimens and compared with preserved values.
After DM determination, samples were ashed at 500°C (Beers, Reference Beers and Steedman1976, Reference Beers and Boltovskoy1981), for ±4 hours (Kimmerer & McKinnon, Reference Kimmerer and McKinnon1987) then placed in silica gel desiccators and weighed on a Mettler MT 5 (±1 µg) balance for ash mass (AM) determination. This procedure was repeated until reaching stable readings. The ash free dry mass (AFDM) of samples was determined after subtracting the % of AM from DM.
For each species, measurements of TL and CW using a micrometric scale (±20 µm), were taken from 10 individuals of each stage prior to DM determination. The relationship between TL and CW with DM of barnacle larvae can be expressed as:

where DM = dry mass, a and b are constants and L is a morphometric measurement, either TL or CW. To stabilize the variance of the data, all three measurements were log10 (x) transformed before analysis (Prepas, Reference Prepas, Downing and Rigler1984; Zar, Reference Zar1999) resulting in the linearized equation:

Naupliar stage I of all 5 barnacle species, as well as cyprids of Verruca stroemia were not considered in analysis as insufficient numbers for DM determinations were obtained. There are no previous DM–length or width relationships for any of those species.
RESULTS
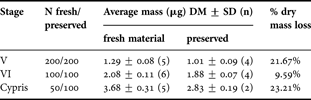
The averaged DM of freshly-caught naupliar stages V and VI and cyprids of A. modestus compared with those preserved more than 1 year, indicated losses of 9–23% with an average of 18.15% (±7.46) (Table 2).
Comparison of dry masses (μg) of fresh and preserved (4% borax buffered formaldehyde solution) late stages larvae of Austrominius modestus.
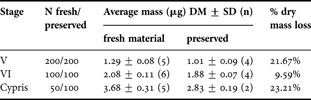
DM, dry mass; SD, standard deviation; N, number of organisms utilized in each replica; n, number of replicates.
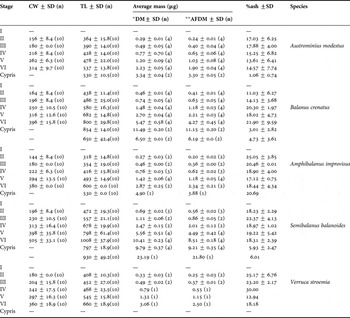
Dry mass, AFDM and ash content of each naupliar stage, of the five species considered, after the correction factor of 18.15% was applied, are presented in Table 3.
Mean mass values (μg) of the naupliar stages II to VI + cypris stages of cirripedes, together with the % of ash considered for each stage, and the averaged body measurements of each larval stage used in the biomass analysis.

DM, dry mass; AFDM, ash free dry mass; CW, carapace width (μm); TL, total length (μm);
SD, standard deviation; —, not available; n, number of organisms measured/or replicates (the number of larvae utilized for each dry mass replica in this work can be seen in Table 1); *, DM values are corrected values by 18.15% due to formalin preservation; **, AFDM were obtained subtracting the measured % of ash from corrected DM values.
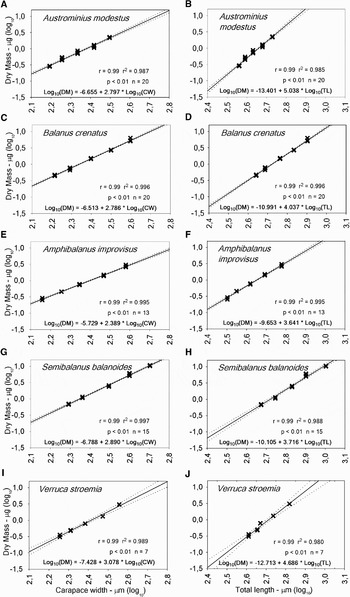
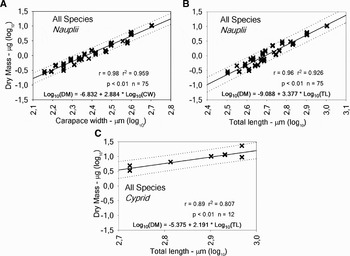
On a general basis, the DM of the naupliar stages of all five species increased logarithmically with increasing CL and TL, with both measurements strongly positively correlated with DM values (Figure 2). The data used in the species-specific regression equations for naupliar stages were pooled in order to obtain a regression equation for all species considered (Figure 3A, B). This same approach was also used for the cyprids stages (Figure 3C).
Simple regression analysis between dry mass values with carapace width (left) and also with total length (right) measurements for naupliar stages (II to VI) of the 5 barnacle species considered. Regression equations are also shown. DM, dry mass (μg individual−1); CW, carapace width (μm individual−1); TL, total length (μm individual−1); r, correlation coefficient; r2, coefficient of determination; p, significance level; n, number of data points. Solid line indicates the resulting equation and broken line indicates 0.95 confidence interval.

Simple regression analysis between dry mass values with carapace width (A) and also with total length (B) measurements of naupliar stages (II to VI) of the 5 barnacle species pooled and the simple regression analysis between dry mass values with total length measurements of all cypris stages of the barnacle species pooled (C). Regression equations are shown on each figure. DM, dry mass (μg individual−1); CW, carapace width (μm individual−1); TL, total length (μm individual−1); r, correlation coefficient; r2, coefficient of determination; p, significance level; n, number of data points. Solid line indicates the resulting equation and broken line indicates 0.95 confidence interval.

DISCUSSION
Despite the potential changes in DM due to formalin preservation, the use of freshly caught material for DM analysis during this work was impractical. The counting and identification of the individuals required for replicate DM measurements from preserved samples often took more than a single day to obtain, and for some stages, weeks were required to obtain numbers necessary for a single replicate.
There is a large body of literature concerning the effects of formalin preservation on zooplanktonic organisms, suggesting that DM losses are most likely to occur depending on the fixative fluid, rinsing method, species composition and even stage of development (Beers, Reference Beers and Steedman1976; Omori, Reference Omori1978; Böttger & Schnack, Reference Böttger and Schnack1986; Giguère et al., Reference Giguère, St Pierre, Bernier, Vézina and Rondeau1989; Postel et al., Reference Postel, Fock, Hagen, Harris, Wiebe, Lenz, Skjoldal and Huntley2000). Giguère et al. (Reference Giguère, St Pierre, Bernier, Vézina and Rondeau1989), in an extensive compilation, reported changes of 37 to 43% for total zooplankton, while Buskey (Reference Buskey1993) applied a correction factor of 25%. In contrast, Dumont et al. (Reference Dumont, Van de Velde and Dumont1975) reported losses of only 5 to 10% for a selection of Copepoda, Cladocera and Rotifera, while Chisholm & Roff (Reference Chisholm and Roff1990) did not observe any loss for a selection of tropical copepods. Omori (Reference Omori1978) attributes DM changes primarily to the loss of stored lipids. Based on these reports, a simplistic value for overall loss of ~25% could be argued when using formalin-preserved samples.
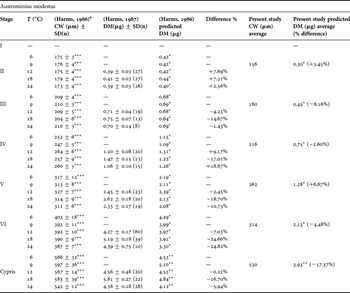
The present study's correction factor of 18.15%, determined from comparisons between preserved and freshly caught A. modestus larvae of the same size (Table 2) falls within the lower limits of the reported values from literature and close to the ‘hypothetical’ 25% loss. When the average corrected DM values for each A. modestus larvae obtained in this study (Table 3) were compared with the averaged values of laboratory-cultured larvae (Table 4), dry masses between 24 and 57% lower were observed. This could be interpreted to suggest that the correction factor of 18.15% was, in fact, an underestimation of preservation losses. Comparing the Harms (Reference Harms1986, Reference Harms1987) data with the field values measured in the present study, however, it is clear that the larval DM and CW values of natural populations of A. modestus from Helgoland (North Sea) cultured at 6, 9, 12, 18 and 24°C and salinity of 30 under excess food conditions, were usually greater than values from individuals measured in the present study (Tables 3 & 4) that were collected from Cracknore on 16 July 2002 at 18.3°C and salinity of 31.6 (Muxagata et al., Reference Muxagata, Williams and Sheader2004). The 24 to 57% DM difference in nauplii is therefore essentially a reflection that the smaller and lighter nauplii found in this study may be simply ‘food limited’ compared with individuals from laboratory rearing experiments with excess food (Harms, Reference Harms1986, Reference Harms1987).
Mean carapace width (μm) and mass values (μg) of the naupliar stages II to VI and cyprids of Austrominius modestus cultured in laboratory at given temperatures and salinities of 30–33 (Harms, Reference Harms1986, Reference Harms1987) and the resulting predicted dry mass (DM) values generated using nauplii carapace width equations for A. modestus (Figure 2A) and total cypris length equations (Figure 3C) on Harms (Reference Harms1986, Reference Harms1987) data, together with the % difference to average DM predicted from carapace width (CW) or total length (TL) in this study.

CW, carapace width; DM, dry mass; SD, ± 1 standard deviation; n, number of replicates;*, predicted using equation Log10(DM), −6.655 + 2.797*Log10(CW);**, predicted using equation Log10(DM), –5.375 + 2.191*Log10(TL);***, n not given; cypris values are total length; a, only measurements on salinity 30 of table 2 of Harms (Reference Harms1986) were considered.
When the DM–width and/or length equations derived in the present study were applied to the Harms data shown in Table 4, differences ranging from +19 to –25% were found, assuming that the width data of each nauplius stage presented in Harms (Reference Harms1986) is linked with the mass data published in Harms (Reference Harms1987). Therefore, an overall averaged difference of –6% could be assumed between the present weight values and the relatively higher values of Harms (Reference Harms1987).
Larval width and length obtained in the present study were measured as accurately and precisely as possible to minimize potential error (McCauley, Reference McCauley, Downing and Rigler1984). The high R2 values obtained in this study confirm that more than 98% of the variability of DM was accounted for by the morphometric measurements considered for naupliar stages (Figure 2), and more than 80% was accounted for by length measurement of cyprids (Figure 3C). Like the findings of Pearre (Reference Pearre1980) for copepods, our predicted dry mass values of all barnacle stages/species (shown in Figures 2 & 3C) from width equations gave slightly better results than those predicted from length.
It is clear that seasonal patterns in environmental parameters and the comparisons of field (food-limited) versus laboratory-reared larvae could have some impact on the differences in biomass identified in this study. Muxagata (Reference Muxagata2005) reported a ‘seasonal’ pattern in naupliar TL and CW, with a decrease in measured size toward summer. Regression analysis indicates a clear inverse relationship with temperature only in A. (Elminius) modestus, B. crenatus and A. (Balanus) improvisus. In general, an inverse pattern with temperature and salinity and a positive relationship with chlorophyll were noted in some naupliar stages of all species. An earlier study by Geary (Reference Geary1991) describing the isomorphic growth pattern between A. modestus naupliar dry weight and total length also recognized the potential impact of environmental factors on larval size and growth. The study determined a ‘condition index’ relating dry weight to total length, based on an index for copepod growth (Durbin & Durbin, Reference Durbin and Durbin1978). The index was seasonally stable, showing that increasing size was matched by increased biomass, but the absolute value of the index was suggested to show an inter-annual difference, although not statistically tested, reflecting phytoplankton species availability.
Following Chisholm & Roff (Reference Chisholm and Roff1990), the accuracy of the estimates using the equations presented here were checked against the measured values. Predicted DM values of nauplii using width equations differed from measured values on average for all species by –0.02%, while the equations of length differed on average by –2.29% for nauplii and –9.12% for cyprid, and by an average of –6% against the independent data set (Table 4).
While accepting the variability inherent in field-based data, we propose the first-reported, field-based equations generated in this study can be considered accurate, reproducible and valuable as first-step biomass estimates for the larvae of those barnacle species common to English Channel waters, and possibly useful for species with similar carapace widths and lengths in other temperate waters.
ACKNOWLEDGEMENT
E.M. acknowledges the support from Conselho Nacional de Desenvolvimento Científico e Tecnológico CNPq, Brazil with grant 200797/98-0.