1. Introduction to magnetic reconnection
Magnetic reconnection is a physical process whereby a change in the topology of magnetic field lines allows magnetic energy to be converted into particle heating and acceleration (kinetic energy), often resulting in explosive events observed in astrophysical as well as in laboratory plasmas. The reconfiguration of magnetic field topology is allowed by a local breaking of the frozen-in conditions (see, e.g., Biskamp Reference Biskamp2003) through dissipation mechanisms and/or kinetic scale dynamics. At the reconnection site, electric fields enhance, leading to plasma acceleration and heating. The energy transformations resulting from reconnection though, may not necessarily occur exactly at the reconnection site only, as we discuss later.
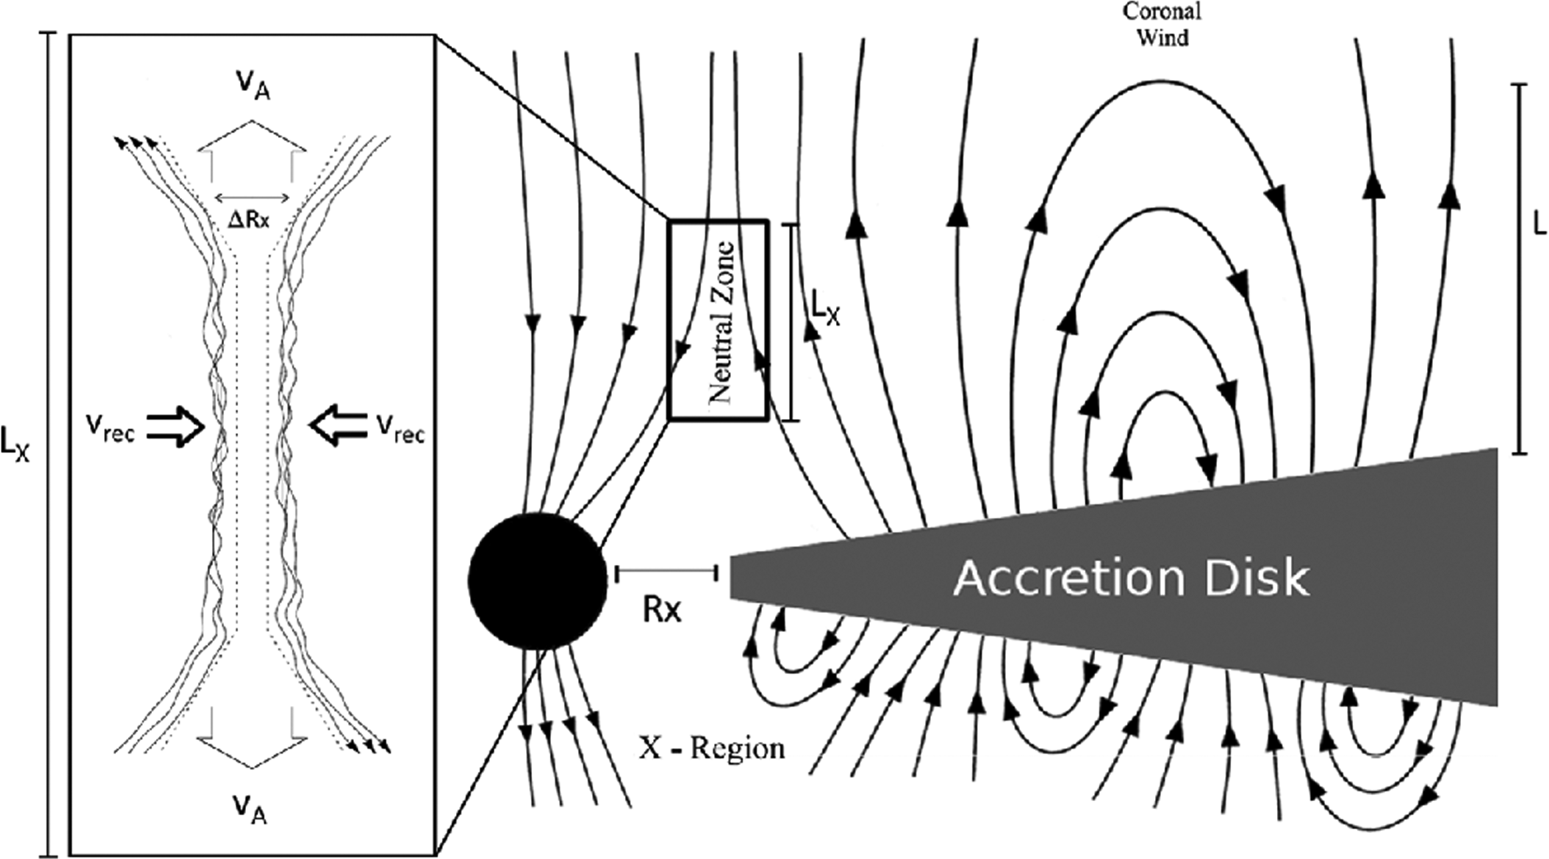
Magnetic reconnection appears to be a ubiquitous process in space and laboratory plasmas: in the heliosphere, magnetic reconnection is essential to the triggering of solar flares (Parker Reference Parker1957; Priest & Forbes Reference Priest and Forbes2002) and coronal mass ejections (hereafter CMEs, or, if observed in the solar wind, interplanetary CMEs (ICMEs); see, e.g., Masuda et al. Reference Masuda, Kosugi, Hara, Tsuneta and Ogawara1994; Su et al. Reference Su, Veronig, Holman, Dennis, Wang, Temmer and Gan2013). It is involved in the evolution of solar and stellar winds (Gosling et al. Reference Gosling, Skoug, McComas and Smith2005; Gosling Reference Gosling2007), and the global dynamics and energy conversion of the Earth's and planetary magnetospheres (Dungey Reference Dungey1961; Paschmann et al. Reference Paschmann, Sonnerup, Papamastorakis, Sckopke, Haerendel, Bame, Asbridge, Gosling, Russell and Elphic1979) that results in geomagnetic substorms and storms (Angelopoulos et al. Reference Angelopoulos, Runov, Zhou, Turner, Kiehas, Li and Shinohara2013). Reconnection is also invoked as a primary mechanism in coronal heating, such as the nanoflare scenario (Parker Reference Parker1988; Rappazzo et al. Reference Rappazzo, Velli, Einaudi and Dahlburg2008). It plays a fundamental role during dynamo processes in primordial galaxy clusters (Schekochihin et al. Reference Schekochihin, Cowley, Kulsrud, Hammett and Sharma2005), pulsar nebulae (e.g.Uzdensky, Cerutti & Begelman Reference Uzdensky, Cerutti and Begelman2011), and in energy conversion in gamma-ray bursts (GRBs) (Thompson Reference Thompson1994; Lyutikov, Pariev & Blandford Reference Lyutikov, Pariev and Blandford2003) and accretion disks (Khiali & de Gouveia Dal Pino Reference Khiali and de Gouveia Dal Pino2016), see figure 1. Finally, it has been observed in sawtooth crashes in tokamaks (von Goeler, Stodiek & Sauthoff Reference von Goeler, Stodiek and Sauthoff1974; Kadomtsev Reference Kadomtsev1975; Yamada et al. Reference Yamada, Levinton, Pomphrey, Budny, Manickam and Nagayama1994) and has been the focus of several laboratory experiments (see Yamada, Kulsrud & Ji Reference Yamada, Kulsrud and Ji2010).
Diagram showing where magnetic reconnection may occur between an accretion disk and a black hole. Arrows indicate the direction of field lines. (Adapted from Khiali & de Gouveia Dal Pino Reference Khiali and de Gouveia Dal Pino2016).

At large enough scales, plasma dynamics and evolution may be described via the fluid magnetohydrodynamic (MHD) model. Reconnection commences on the smallest scales, in the MHD model associated with the resistive effects of particle collisions. However, kinetic effects might be important at reconnection scales, for example through wave–particle interactions and the details of individual particle motions. At reconnection site (charged) particle de-magnetization may be a more important effect than collisions themselves in allowing the reconfiguration of magnetic field lines. Therefore, understanding magnetic reconnection requires going beyond MHD, and depending on the system under consideration, multi-fluid, hybrid and fully kinetic models may be required. In addition, the topology breaking from magnetic reconnection may have profound effects even on the largest scales, so that this process is intrinsically a multi-scale phenomenon occurring throughout the Universe.
Though quantitative analyses of magnetic reconnection originated initially via studies of configurations in a stationary state, or as studies of the linear instability of equilibrium or quasi-equilibrium current configurations, reconnection is a process that occurs naturally in a dynamically evolving plasma. Even if not in a fully developed turbulent state, nonlinear interactions play a fundamental role in plasma evolution, and the interplay between nonlinear dynamics, turbulent cascades and magnetic reconnection poses important questions for reconnection onset. Historically, natural plasma turbulence was recognized via measurements carried out by spacecraft in situ in the solar wind, where fluctuations in the magnetic and velocity field are found to be well-described by power laws spanning three to four decades in scale (Coleman Reference Coleman1968; Tu & Marsch Reference Tu and Marsch1995). Closer to the Earth, the magnetosheath and plasma sheet are also noisy, bursty and randomly structured (Borovsky et al. Reference Borovsky, Elphic, Funsten and Thomsen1997). Within the framework of fluid theories of ongoing nonlinear cascades, scales associated with magnetic reconnection appear critically, and there is little doubt that reconnection plays an important role in the transition from inertial to dissipative scales, perhaps even within the inertial range (Servidio et al. Reference Servidio, Matthaeus, Shay, Cassak and Dmitruk2009; Loureiro & Boldyrev Reference Loureiro and Boldyrev2020; Mallet, Schekochihin & Chandran Reference Mallet, Schekochihin and Chandran2017). Reciprocally, turbulence may provide a triggering mechanism, or accelerate the dynamics of reconnection once it has started (Matthaeus & Lamkin Reference Matthaeus and Lamkin1986; Matthaeus & Velli Reference Matthaeus and Velli2011; Lazarian, Eyink & Vishniac Reference Lazarian, Eyink and Vishniac2012). Our review focuses on approaches based on linear stability theory, for reasons to be clarified further in the following. However, significant references are provided illustrating when and how turbulence effects may prove fundamental.
Magnetic reconnection, though ubiquitous in the Universe, cannot be occurring always and everywhere: were this the case, magnetic fields and current systems would not be able to store the energy required to explain the observed explosive outbursts. Therefore, a storage or accumulation phase must precede reconnection onset. During this storage phase, magnetic flux must be at least approximately conserved, and the field lines and plasma move together (Alfvén Reference Alfvén1960). From a kinetic point of view, the electron magnetic moment is conserved, there are no electric fields parallel to the magnetic field, and charged particle motion is dominated by the  $E$ cross
 $B$ drift. The build-up phase ends when the system becomes unstable and a trigger condition, required to break the field topology, is met: this threshold condition must be connected either with changes in the plasma parameters during evolution, or in the geometry and/or external drivers, such as inflows (or outflows).
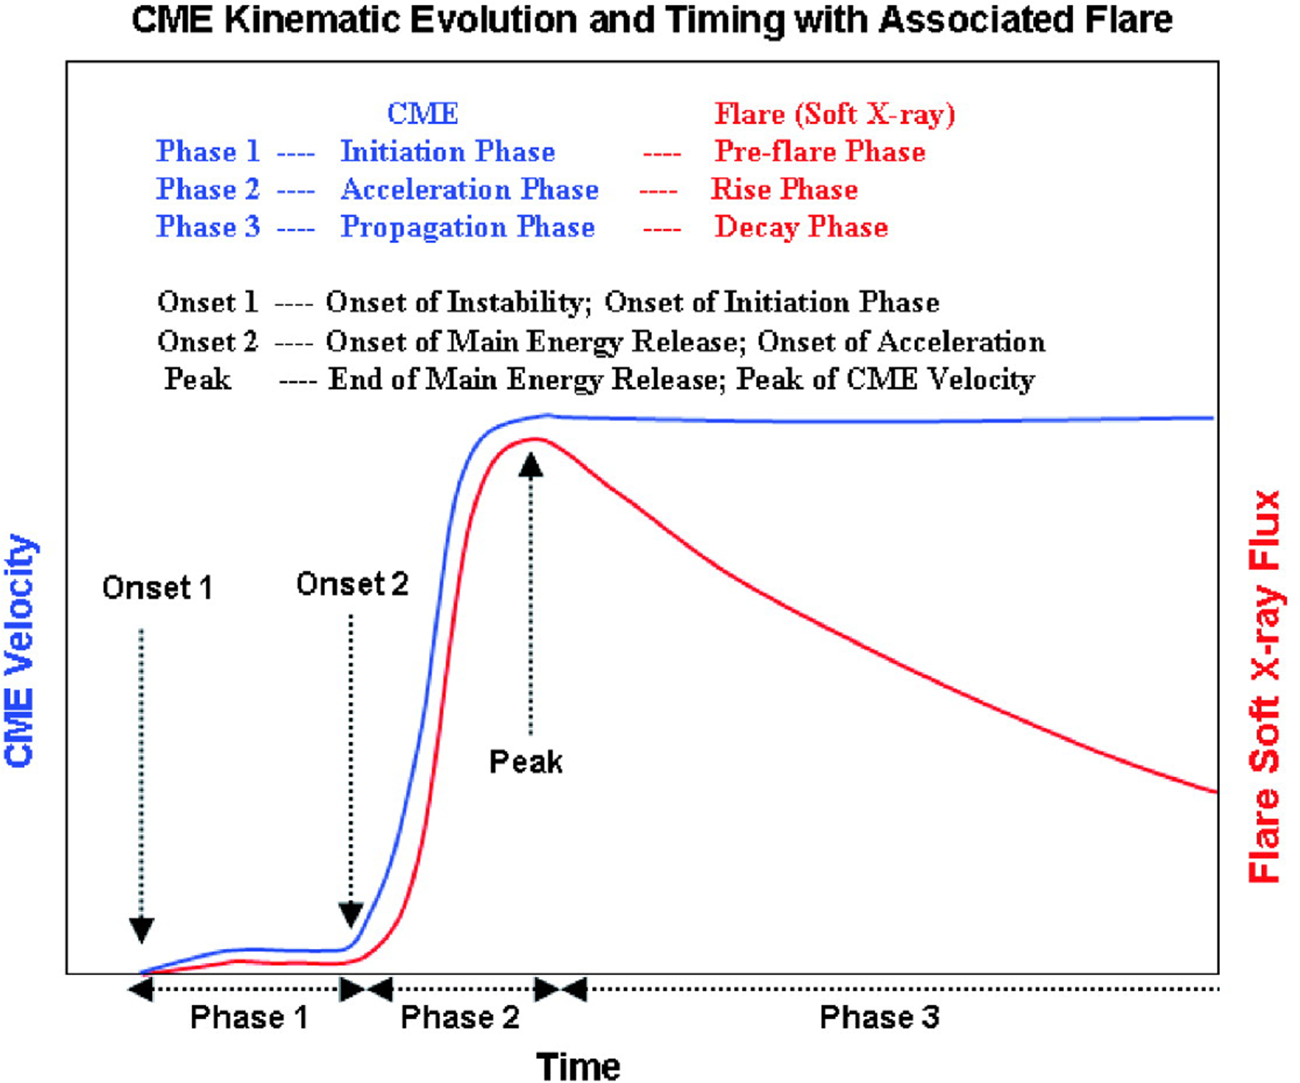
Figure 2, for example, displays the typical three phases associated with a CME: an initial slow phase, Onset 1 associated with the rising of a prominence in the solar atmosphere, connected with its eventual loss of equilibrium; a second phase, Onset 2, when reconnection has been triggered and nonlinear evolution of the system leads to the rapid acceleration of the ejected flux tube portion; and a third phase, during which the CME coasts along into the heliosphere.
Schematic plot of a CME kinematic evolution and its relation to the temporal evolution of GOES soft X-ray measurements, showing three distinct phases: initiation phase, acceleration phase, and propagation phase. (Adapted from Zhang & Dere Reference Zhang and Dere2006).

As magnetic reconnection was first proposed as an energy conversion process for solar flares by Sweet (Reference Sweet1958) and Parker (Reference Parker1957), much progress has been made in investigating the onset of reconnection and particle acceleration in space, astrophysical as well as laboratory environment. After the pioneering observations and simulations (e.g. Paschmann et al. Reference Paschmann, Sonnerup, Papamastorakis, Sckopke, Haerendel, Bame, Asbridge, Gosling, Russell and Elphic1979; Hesse et al. Reference Hesse, Schindler, Birn and Kuznetsova1999; Birn et al. Reference Birn, Drake, Shay, Rogers, Denton, Hesse, Kuznetsova, Ma, Bhattacharjee and Otto2001; Øieroset et al. Reference Øieroset, Phan, Fujimoto, Lin and Lepping2001; Drake et al. Reference Drake, Shay, Thongthai and Swisdak2005; Yamada et al. Reference Yamada, Kulsrud and Ji2010 and references therein), a vast body of literature has focused on what might accelerate magnetic reconnection speeds up to the realistic values required to explain observations. In fluid models, the reconnection onset problem is often studied starting from a thick current sheet configuration perturbed by the introduction of a single X-point (most frequently therefore a two-dimensional configuration); as the arms of a scissor,Footnote 1 the  $X$-point is unstable to collapse (the developmental phase; Syrovatskiǐ Reference Syrovatskiǐ1971), leading to the formation of an inner reconnecting current sheet (or diffusion region). In some instances the evolution at this inner, kinetic scale diffusion region is studied by driving the inflow of plasma and assuming that a steady-state or asymptotic phase is reached. Most often, three-dimensional reconnection onset dynamics have been studied in the context of magnetospheric and solar magnetic field configurations (Antiochos, DeVore & Klimchuk Reference Antiochos, DeVore and Klimchuk1999; Leake, Daldorff & Klimchuk Reference Leake, Daldorff and Klimchuk2020) where the trigger remains mysterious, determined as it is by the numerical method involved in simulating the catastrophic evolution of the magnetic field configuration. In any case, a trigger condition for current sheet instability appears naturally either thanks to scale-transitions at onset, from fluid to kinetic, including hybrid and particle-in-cell (PIC) simulations, or to the nature of the macroscopic numerical simulation modelling (driven MHD). In the latter case, significant progress in understanding the triggering of reconnection was made once it appeared that, at large enough Lundquist numbers, the Sweet–Parker (SP) current sheet becomes unstable (Shibata & Tanuma Reference Shibata and Tanuma2001; Biskamp Reference Biskamp2003; Loureiro, Schekochihin & Cowley Reference Loureiro, Schekochihin and Cowley2007; Bhattacharjee et al. Reference Bhattacharjee, Huang, Yang and Rogers2009). The tearing mode of this sheet was called the plasmoid instability, and was observed in studies specifically devoted to the SP-like initial configuration. In resistive MHD, magnetic field evolution is determined by convective motion and diffusion, so that the ratio of the characteristic time of these physical processes, can be defined as a non-dimensional parameter
 $S= Lv_A/\eta$, the Lundquist number, where
 $L$ is a typical length scale of the system,
 $v_A$ is the Alfvén speed and
 $\eta$ is the magnetic diffusivity due to ion–electron collision. Pucci & Velli (Reference Pucci and Velli2014) showed that a fast tearing instability should grow on an
 $S$-independent timescale, once current sheet aspect ratios have reached values scaling with the macroscopic Lundquist number as
 $L/a\sim S^{1/3}$, much thicker than the SP version, suggesting a new way to approach the initiation of fast reconnection in collapsing current configurations. Because once this scaling is achieved, the growth rate of tearing modes no longer depends explicitly on diffusivity and is comparable to the ideal Alfvén transit time, they called this ‘ideal’ tearing. They suggested that the nonlinear dependence of the growth rate with the current sheet aspect ratio in a thinning sheet might provide the necessary trigger condition. The growth rate independence from Lundquist number (at high Lundquist numbers) has since been studied and verified in numerical simulations (Landi et al. Reference Landi, Del Zanna, Papini, Pucci and Velli2015; Tenerani et al. Reference Tenerani, Velli, Rappazzo and Pucci2015b; Huang, Comisso & Bhattacharjee Reference Huang, Comisso and Bhattacharjee2017). An overview of ‘ideal’ tearing in resistive MHD is presented in § 3, where we also discuss how the same reasoning can be extended to other plasma models commonly used that include electron inertia and kinetic effects.
Such a treatment, based on one-dimensional systems with antiparallel field lines and a collisional resistivity described by a single global parameter, the Lundquist number, does not capture the totality of potentially dynamic situations, nor the complexity, for example, of collisionless dissipation mechanisms, that may offer new onset and/or stabilization scenarios, see, e.g., Cassak, Shay & Drake (Reference Cassak, Shay and Drake2006) and Swisdak et al. (Reference Swisdak, Rogers, Drake and Shay2003). Note, however, that the ‘ideal’ tearing has been generalized to small-scale kinetic effects (Del Sarto et al. Reference Del Sarto, Pucci, Tenerani and Velli2016; Pucci, Velli & Tenerani Reference Pucci, Velli and Tenerani2017), leading to different conclusions (Shi et al. Reference Shi, Tenerani, Velli and Lu2019) than those of Cassak et al. (Reference Cassak, Shay and Drake2006).
In the kinetic approach, for which most of the studies have been carried out using Vlasov (see, e.g., Schmitz & Grauer (Reference Schmitz and Grauer2006) and Palmroth et al. (Reference Palmroth, Hoilijoki, Juusola, Pulkkinen, Hietala, Pfau-Kempf, Ganse, von Alfthan, Vainio and Hesse2017) for global simulations), hybrid (Kuznetsova, Hesse & Winske Reference Kuznetsova, Hesse and Winske2001; Shay et al. Reference Shay, Drake, Rogers and Denton2001a), and particle simulations (Pritchett Reference Pritchett2001; Hesse, Birn & Kuznetsova Reference Hesse, Birn and Kuznetsova2001a; Horiuchi, Pei & Sato Reference Horiuchi, Pei and Sato2001; Shay et al. Reference Shay, Drake, Rogers and Denton2001b), reconnection has been recognized to become fast when the current sheet reaches kinetic scales, that is, the ion skin depth  $d_ i =c/\omega _{\textrm {pi}}$ (where
 $\omega _{\textrm {pi}}$ is the ion plasma frequency) and sustained by the non-diagonal terms of the electron pressure tensor. The instability in such regimes depends crucially on the symmetry of the current layer and plasma
 $\beta$, and is suppressed for component reconnection at sufficiently large
 $\beta$, (Swisdak et al. Reference Swisdak, Rogers, Drake and Shay2003). Nonlinear evolution and saturation also depend on the intensity of a possible guide field, associated with the magnetization of electrons (Karimabadi, Daughton & Quest Reference Karimabadi, Daughton and Quest2005).
Owing to the numbers of parameters and range of scales involved, many questions remain unsolved. How is the trigger of magnetic reconnection modified in partially ionized plasmas? How is reconnection condition met for non-neutral current sheet configurations, such as that present in the magnetotail or helmet streamers in the solar corona? What triggers the reconnection in a kinetic plasma? What is the relationship between turbulence and reconnection and does reconnection develop in a turbulent environment? How is energy is converted and redistributed among different populations of particles? Is the energy transfer dependent on the onset of reconnection and how does this affect our approach to study reconnection in general?
The aim of the present review is to summarize what is known about the physics of reconnection onset and how it is observed in laboratory as well as in space and astrophysical plasmas. We stress why a full understanding of the onset problem is important to a correct description of reconnection dynamics. We provide an example of how reconnection dynamics is important to understand particle acceleration, even though we do not address the particle acceleration problem in detail, as it is too broad to be covered here (but see, e.g., Yamada et al. (Reference Yamada, Kulsrud and Ji2010), Yamada, Yoo & Zenitani (Reference Yamada, Yoo and Zenitani2016) for reviews). We highlight open questions throughout the whole paper, with the hope that this is useful for future research on reconnection.
2. The onset problem
The current section focuses on how onset is achieved, namely how plasma evolution paves the way to magnetic reconnection. Early studies of reconnection were focused on the topologies conducive to reconnection, namely regions in space containing magnetic field neutral points with separatrices, and the rates at which the free energy in current carrying magnetic fields might be dissipated and converted into a stationary state. The first magnetospheric dynamical model explicitly invoking reconnection was the convection model of Dungey (Reference Dungey1961), where the reconnection rates on the day and night side of the Earth's magnetosphere were considered equal so as to create a stationary convection pattern. Stationary reconnection has often been associated with reconnection of the SP or Petschek types (though in his application to solar flares Sweet (Reference Sweet1958) was well aware of the difficulties associated with the stationary approximation). However, in situ observational evidence, as well as theoretical advances have accumulated, showing that there can really be no such thing as stationary reconnection except, perhaps, in a statistical sense, a fact we discuss in detail later. The onset problem, related to the generation of topologies allowing magnetic reconnection to be triggered, has also been studied distinguishing between spontaneous and driven reconnection processes, based on whether the system in question is forced on time scales much longer (spontaneous) or comparable (driven) to the typical dynamical timescale of the system itself. This is best clarified in the context of Earth's closest natural plasma environments: the solar corona and the Earth's magnetosphere.
2.1. Spontaneous versus driven reconnection
All reconnection may be considered as driven, in the sense that an energy source is required to drive the currents flowing in the plasma system under consideration. The energy sources are usually associated with other processes, for example the kinetic energy of the solar wind for energization of the magnetosphere, solar convection and the solar dynamo for coronal heating and generation of the heliosphere. The Dungey cycle provides a clear example of driven reconnection at the day-side magnetosphere (Dungey Reference Dungey1961): here the shocked solar wind carrying a southward magnetic field, impinges on the northward field of the compressed magnetic field of the Earth's dipole, see figure 6, creating  $o$-points and
 $x$-lines where reconnection occurs. Other examples of driving are given by photospheric motions carrying and braiding magnetic field lines threading the photosphere and corona, therefore inducing coronal currents.
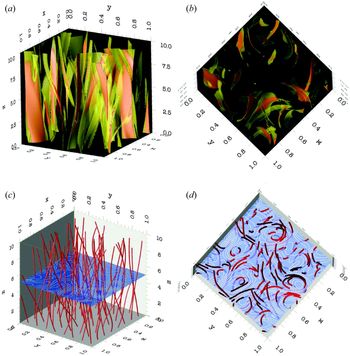
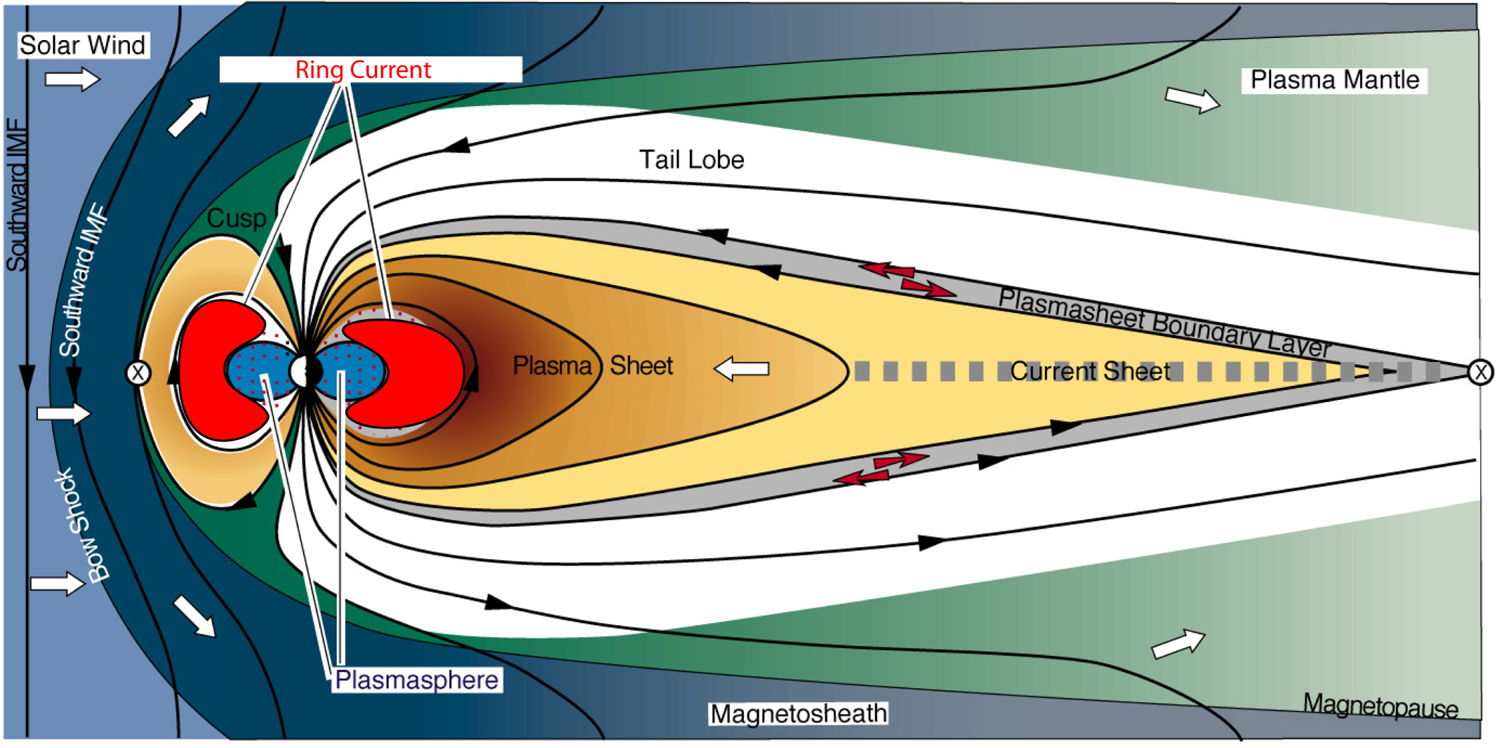
The driven versus spontaneous distinction depends on the often differing timescales of the driver and the dynamics. If the driving time scale is long, so that some form of relaxation of the system in question can occur, the onset may be considered to be spontaneous. For instance, in the solar corona, the field line-tangling process that may be responsible for coronal heating in the so-called nanoflare scenario, is much longer than the typical Alfvénic dynamical timescale associated with corona (minutes to hours compared with seconds; Parker (Reference Parker1972); Rappazzo et al. (Reference Rappazzo, Velli, Einaudi and Dahlburg2008)). Therefore, in this case the detailed onset of reconnection, and its location, is set by conditions in the corona rather than by some specific change or trigger associated with the driver. Figure 3 shows the current sheets that develop in a simplified coronal loops, straightened out and dominated by an axial field, and constrained by line-tying at two photospheric surface at the top and bottom. Photospheric forcing is applied via large-scale vortices on these plates, yet extremely small-scale structure develops in the current, leading to on–off reconnection at different sites in the volume along the long thin sheets. Rappazzo et al. (Reference Rappazzo, Velli, Einaudi and Dahlburg2008) showed that the resulting coronal configuration is one of magnetically dominated MHD turbulence, where power spectra in magnetic and velocity fields are observed, but the energy in the magnetic field is orders of magnitude greater than in the velocity. It remains to be seen, in this configuration, whether an instability trigger applies, as discussed in the next section. Another example is provided by substorms in the magnetotail (in contrast to geomagnetic storms, directly driven by solar conditions). In the night-side region of the magnetotail, magnetic field lines are stretched in the anti-Sunward direction owing to interaction with the solar wind flow past the magnetosphere, as shown in figure 4. The tail configuration becomes more dipolar in the initial phase of the substorm and, accordingly for example to the observations discussed in Nakamura et al. (Reference Nakamura, Baumjohann, Klecker, Bogdanova, Balogh, Réme, Bosqued, Dandouras, Sauvaud and Glassmeier2002), dipolarization fronts can be found ahead of the high-speed part of the predominantly Earthward-directed flows, in connection with bursty bulk flows, the latter occurring on smaller time scales (e.g. Ohtani Reference Ohtani2004; Angelopoulos et al. Reference Angelopoulos, Runov, Zhou, Turner, Kiehas, Li and Shinohara2013). Evacuation of the normal component of the magnetotail fieldFootnote 2 might be due to the flux loading from the day-side magnetosphere, in connection with an adjustment of the magnetoside field topology (see Hsieh & Otto Reference Hsieh and Otto2015, and references therein). It might also be due to the natural evolution of the magnetotail itself, the latter being the result of the adiabatic evolution of the field lines (Birn & Schindler Reference Birn and Schindler2002) or some internal thinning mechanism of the magnetospheric current sheet, such as current sheet natural collapse.
(a,c) Side and (b,d) top views of (a,b) current sheets and (c,d) field lines of a simulation of photospheric vortices driving the evolution of a coronal volume. For an improved visualization, the box size has been rescaled, but the axial length of the computational box is 10 times longer that the perpendicular cross-section length. The rescaling of the box artificially enhances the structures’ inclination. To restore the original aspect ratio, the box should be stretched 10 times along  $z$. (a,b) Two isosurfaces of the squared current
 $j^{2}$. The isosurface at the value
 $j^{2}=2.8\times 10^{5}$ is represented in partially transparent yellow, whereas red displays the isosurface with
 $j^{2}=8\times 10^{5}$, well below the maximum value of the current at this time
 $j^{2}_{\textrm {max}}=8.4\times 10^{6}$. As is typical of current sheets, isosurfaces corresponding to higher values of
 $j^{2}$ are nested inside those corresponding to lower values. For this reason, the red isosurface appears pink. Although from the side view the sheets appear space filling, the top view shows that the filling factor is small. (c,d) Field lines, and in the midplane (
 $z=5$), contours of the transverse (reconnecting) magnetic field. (Adapted from Rappazzo et al. Reference Rappazzo, Velli, Einaudi and Dahlburg2008.)

Schematic illustration of the Earth's magnetosphere configuration and magnetic field topology (black lines). The solar wind impacts the dipolar configuration of the magnetic field, generating an elongated tail and a current sheet. (Adapted from Wang Reference Wang2008.)

Once reconnection is triggered, explosive energy release can be observed on many different scales. On the Sun, an erupting flux tube in the solar corona, characterized by a length scale of about  $10^4\text {--}10^{5}\ \textrm {km}$, responsible for a CME, can release energy up to
 $10^{32}\ \textrm {ergs}$ in hundreds of seconds (Cargill Reference Cargill2013), whereas nano-flares (see Parker Reference Parker1972; Klimchuk Reference Klimchuk2015), release a continuum up to
 $10^{24}\ \textrm {ergs}$ each, on length scales up to 100 km, on timescales of only a few seconds (Cargill Reference Cargill2013). In the case of substorms, concurrent high-speed bursty bulk flow durations last from about a minute to a few minutes. Each consists of smaller-scale flow bursts with a time scale of several tens to about a hundred seconds. Although the free energy source for both the corona and magnetotail ultimately resides in the magnetic field (Forbes Reference Forbes2000; Sterling & Moore Reference Sterling and Moore2005; Sitnov et al. Reference Sitnov, Birn, Ferdousi, Gordeev, Khotyaintsev, Merkin, Motoba, Otto, Panov and Pritchett2019), the mechanism of destabilization and the subsequent dissipation processes remain unclear.
2.2. Onset models in space plasmas
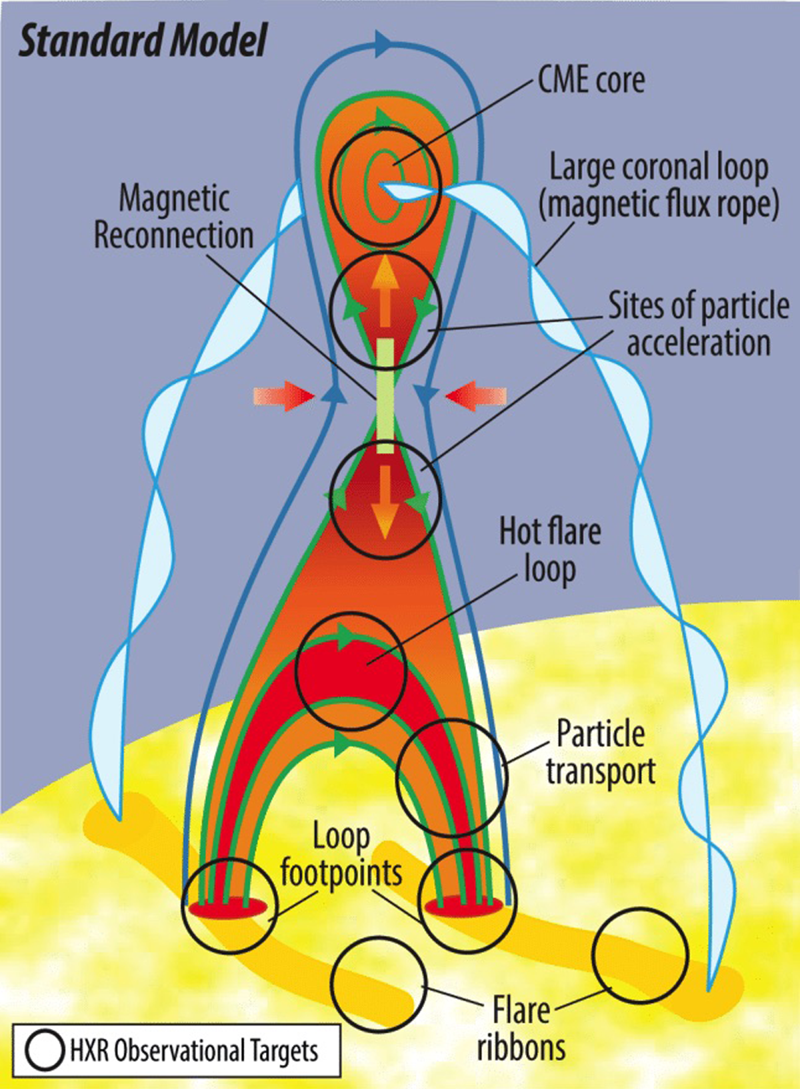
As discussed in § 1, magnetic configurations in the solar corona, characterized by a relatively slow evolution, become unstable causing flares and CMEs. The latter are ejections of coronal magnetic fields and plasmas into interplanetary space, accompanied by rapid energy release in the corona itself, resulting in heating, particle acceleration and a reconfiguration of the original magnetic field. Models of these events generally include a twisted flux rope, or sheared magnetic arcade, above a distribution of photospheric magnetic flux. The magnetic imprint of the structure at the photosphere (and base of the corona) is a filament channel or neutral line. This is a region where the magnetic field component, threading the photosphere (perpendicular), changes sign, while the parallel one becomes very strong. The current carried by the flux rope, or sheared arcade, is the source of free magnetic energy, and eruption occurs as this energy is released through an upward expansion, and diminishment, of the current. The eruption is preceded by a long phase (days to week) during which the magnetic field is progressively stressed and free magnetic energy builds up. The configuration typically evolves quasi-statically (with velocities well below the Alfvén speed). At a certain point in the evolution, within a few minutes up to an hour, the system becomes very dynamic, with a global upward motion, as traced by the evolution of the cold plasma in the associated filament. Later on, a flare is typically observed, with a significant release of magnetic energy. This ‘standard model’ of a solar flare is illustrated in figure 5. Why the magnetic configuration erupts, that is, how the coronal magnetic configuration becomes unstable at some point during a slow evolution, is still not entirely understood, and is usually interpreted in terms of either a transition to a loss of equilibrium or development of an instability. This may involve a flux rope straddling the filament channel neutral line. Slow evolution, driven either by current increase or external flux erosion, brings the flux rope to a point of catastrophic non-equilibrium (Heyvaerts & Kuperus Reference Heyvaerts and Kuperus1978; Forbes & Isenberg Reference Forbes and Isenberg1991; Kliem & Török Reference Kliem and Török2006; Fan & Gibson Reference Fan and Gibson2007; Démoulin & Aulanier Reference Démoulin and Aulanier2010; Olmedo & Zhang Reference Olmedo and Zhang2010; Hassanin & Kliem Reference Hassanin and Kliem2016). In the flux rope picture, a major question is that of the large amount of shear in the pre-flare filament channel, always present, is an accessory rather than a requirement of this model: although field-aligned structures are seen throughout all layers of the visible atmosphere, large-scale helically twisted structures are not observed except during eruptive solar events. Note that torsional structures, such as X-ray sigmoids, cannot be considered to be obvious examples of helical twist, see, e.g., Panasenco, Martin & Velli (Reference Panasenco, Martin and Velli2014). Other models, that do not have a pre-formed flux rope but only an intensely sheared coronal configuration with field lines elongated along the neutral line, require reconnection to initiate the eruption and flaring of the magnetic configuration. Here it is a thinning current sheet below the rising filament that disrupts, forming the flux rope during the eruption. In subsequent phases, magnetic reconnection plays a key role in all models as the peak of the upward acceleration is typically found to be correlated with the peak of the hard X-rays and of the time derivative of soft X-rays flux. The sheared arcade may be destabilized by reconnection with the overlying field if its topology is not that of a simple bipolar arcade but contains multipolar structure harboring spine-fan structures. This is the essence of the breakout model (Antiochos et al. Reference Antiochos, DeVore and Klimchuk1999). The shearing of an arcade within a multiple polarity structure leads to the rise and possible breakout of the structure via reconnection somewhat similar to what occurs in the day-side magnetosphere in the presence of a southward interplanetary magnetic field.
The standard model for solar flares explains their observable features on the basis of magnetic reconnection. Circles mark the emission from all key points. (Adapted from Christe et al. Reference Christe, Krucker, Glesener, Shih, Saint-Hilaire, Caspi, Allred, Battaglia, Chen and Drake2017.)

The response of the magnetosphere to input from interplanetary space depends on where reconnection happens and how efficiently it reconnects magnetic flux from interplanetary space. The effect of impinging variable external flux on the reconnection site is softened by the fact that local plasma parameters may adjust to keep reconnection steady, so that it is difficult to say whether reconnection at the magnetosheath is forced or happening spontaneously (Cassak & Fuselier Reference Cassak and Fuselier2016). At the same time reconnected flux at the day side is convected to the night side, where it can accumulate without significant energy release, contributing, in some sense, to build up in the tail. In terms of reconnection properties, the so-called Axford conjecture (Axford Reference Axford1969) states that the large-scale (global) properties are set by global conditions. However, changes in local parameters, such as the plasmaspheric plumes modifying the density on the magnetospheric side, can locally change magnetic reconnection properties. In particular, Dorelli (Reference Dorelli2019) demonstrated that the reconnection rate at the subsolar magnetopause is strongly controlled by the solar wind electric field and depends weakly on the local properties of the dissipation region. As the densities on the magnetospheric and magnetosheath side of reconnection typically differ by a factor of more than 100, and the magnetic field by a factor of around 2, reconnection at the day-side magnetopause is asymmetric.Footnote 3 As shown by Cassak et al. (Reference Cassak, Shay, Drake and Eckhardt2007), the  $X$-line is displaced from the centre of the dissipation region towards the magnetosheath, whereas the stagnation point is offset towards the side with the smaller mass flux into the dissipation region. If a strong diamagnetic drift is present, the
 $x$-line advects with the electron fluid velocity, resulting in an asymmetry of the separatrices opening angles with the wider angle facing the direction of motion (Swisdak et al. Reference Swisdak, Rogers, Drake and Shay2003). In this case reconnection is stabilized if the diamagnetic drift speed is larger than the Alfvén speed. This translates into a stabilization criterion on the plasma parameter, defined with the reconnecting magnetic field
 $B_x$:
 \begin{equation} \beta= \dfrac{8{\rm \pi} P}{B^2_x}>\dfrac{B_z}{B_x}\dfrac{2}{d_i(d_yP/P)}, \end{equation}
where  $B_z$ is the guide field and
 $P$ is the pressure, both evaluated at the current layer. This criterion actually reveals that if the guide field is strong, reconnection cannot be suppressed by the diamagnetic drift, offering a way to trigger reconnection at multiple surfaces (Swisdak et al. Reference Swisdak, Rogers, Drake and Shay2003) because they can directly affect which planes dominate reconnection, explaining the stochasticity of magnetic field predictions (Galeev, Kuznetsova & Zelenyi Reference Galeev, Kuznetsova and Zelenyi1986).
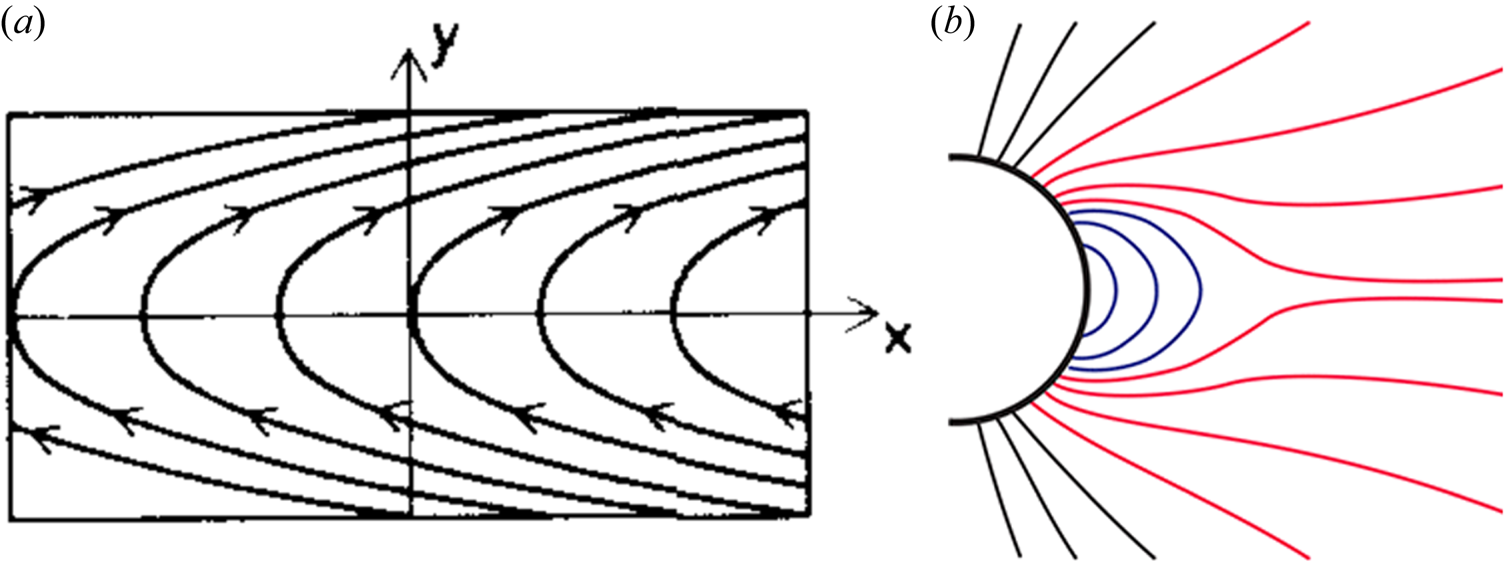
Many are the analogies between the dynamics of the magnetotail destabilization and the solar corona, suggesting the basics physical mechanism could be the same. As we discuss in § 3.1 the main difference lies in what is the microscopic mechanism allowing the magnetic field topology to suddenly change and reorganize, as the magnetotail is collisionless (for a full review on the explosive events in the magnetotail, see Sitnov et al. Reference Sitnov, Birn, Ferdousi, Gordeev, Khotyaintsev, Merkin, Motoba, Otto, Panov and Pritchett2019). In addition, the Earth's magnetotail presents a normal component with respect to the current sheet plane, similar to the helmet streamers in the solar corona (Dahlburg & Karpen Reference Dahlburg and Karpen1995); see figure 6.
(a) Magnetotail magnetic field configuration (the solar wind flows from the right). (b) Helmet streamer typical configuration, for a dipolar solar magnetic field such as seen at solar minimum.

The stabilization mechanism (Coroniti Reference Coroniti1980; Lembege & Pellat Reference Lembege and Pellat1982) can be interpreted as the impossibility of breaking the frozen-in condition because the electrons are always magnetized, thanks to the presence of the magnetic field normal component at the current sheet location  $B_N$. Lembege & Pellat (Reference Lembege and Pellat1982) tried to solve the problem of the stabilization criterion given in Coroniti (Reference Coroniti1980), integrating the equations for energy principle stability over an infinitely long flux tube. This operation, unfortunately, is not consistent with the rest of the energy principle analysis itself. Additional studies to drive the current sheet unstable include the effect of transient destabilizing electrons (Sitnov et al. Reference Sitnov, Sharma, Guzdar and Yoon2002). According to Lembege & Pellat (Reference Lembege and Pellat1982) and a more general analysis by Rycroft (Reference Rycroft2007) and Sitnov & Schindler (Reference Sitnov and Schindler2010), the region where the tearing instability is forbidden scales as
 \begin{equation} {\rm \pi} (B_N/B_0)C_d^2 \lesssim k L_z \lesssim (B_N/B_0)(L_z/\rho_{0e}), \end{equation}
where  $B_0$ is the asymptotic value of the reconnecting magnetic field,
 $k$ is the mode wave number,
 $L_z$ is the current sheet half thickness,
 $\rho _{0e}$ is the thermal electron gyro-radius in the field
 $B_0$ and
 $C_d= VB_N/({\rm \pi} L_z)$, where
 $V$ is the volume of the flux tube,
 $V=\int \textrm {d}l/B$. The inequality on the left-hand side of (2.2) allows reconnection at microscopic scales through electron demagnetization, when inverse Landau damping on electrons is also possible. The right-hand side provides a destabilization criterion that depends on the geometry of the macroscopic magnetic field that requires special types of magnetic flux distributions in the tail, namely one or more regions of tailward gradients in
 $B_N$. Such distributions are not a common feature of the quiet magnetotail, that typically possesses only an Earthward gradient in
 $B_N$ (Merkin & Sitnov Reference Merkin and Sitnov2016; Sitnov et al. Reference Sitnov, Birn, Ferdousi, Gordeev, Khotyaintsev, Merkin, Motoba, Otto, Panov and Pritchett2019). Hesse & Schindler (Reference Hesse and Schindler2001) starting from one of the equilibrium class developed by Birn & Schindler (Reference Birn and Schindler1983) performed a full PIC simulation of a tail-like equilibrium configuration. Applying an external electric field to simulate the driving from the day-side magnetopause (as described previously), they showed that a thin current sheet develops in the centre of the broader plasma sheet. Once the thin sheet is formed, quasi-static force balance leads to a substantial decrease of the north–south component of the magnetic field in the centre of the sheet, allowing the electrons to become non-gyrotropic and the tearing instability to develop. Merkin & Sitnov (Reference Merkin and Sitnov2016) suggested a different kind of instability with respect to the electron tearing mode (Liu et al. Reference Liu, Birn, Daughton, Hesse and Schindler2014). They assumed a coherent Earthward displacement of the original region of accumulated magnetic flux. If the topology presents, or naturally evolves, in a configuration in which
 $C_d >1$, through the continuous enhancing on the hump, the system is potentially unstable, see the simulations in Pritchett (Reference Pritchett2015), Sitnov et al. (Reference Sitnov, Buzulukova, Swisdak, Merkin and Moore2013, Reference Sitnov, Merkin, Swisdak, Motoba, Buzulukova, Moore, Mauk and Ohtani2014, Reference Sitnov, Merkin, Pritchett and Swisdak2017) and Bessho & Bhattacharjee (Reference Bessho and Bhattacharjee2014). The flux removal from the tail-ward edge of the hump naturally generates an
 $x$-line, rapidly disrupting the sheet by large-scale reconnection.
3. Onset models based on the tearing instability of thin current sheets
Magnetic reconnection initiation, or onset, occurs when an initially stable or metastable current sheet configuration with enough free energy becomes unstable, allowing the system to access new magnetic field topologies. When the magnetic energy of the new configuration is lower than that in the original state, the free energy becomes available for particle heating and acceleration. Regardless of how the initial equilibrium configuration is destabilized (for examples, see § 2.2), once the conditions for an effective reconnecting instability to occur in the current sheet are attained, magnetic energy can be released. We define the physical condition under which this is achieved as the trigger condition. Note that within the framework of resistive MHD, most current sheet profiles are unstable but on exceedingly long timescales, that tend to infinity with increasing Lundquist number. Any slow, smooth transition from small to larger growth rates cannot work as a trigger mechanism (Cowley & Artun Reference Cowley and Artun1997): if the rate at which the stability boundary is crossed is slow, a large linear growth rate will not be achieved because it would imply extremely small initial perturbation amplitudes, unrealistic for natural plasmas and unlikely to emerge over the background fluctuations.
This concept is particularly relevant in the context of studying reconnection onset, because it is universal, independent of the physical quantities that define the plasma, the approach (being fluid or kinetic) and of the mechanism that allows the frozen-in conditions to be broken, see § 3.1. Most of the efforts in the MHD community were in the direction of how to drive fast magnetic reconnection. Traditional models of reconnection dating from the end of the 1950 to early 1960s started either from the SP mechanism (Parker Reference Parker1957; Sweet Reference Sweet1958) or from the instability of thick current sheets (Furth, Killeen & Rosenbluth Reference Furth, Killeen and Rosenbluth1963) were inadequate to explain the phenomena of sudden magnetic energy release discussed in § 1. The reason is that these models predict magnetic reconnection timescales that are orders of magnitude too long and scale with a positive power of  $S$, where
 $S \simeq 10^6 \text {--}10^{20}$ is the macroscopic Lundquist number (
 $\eta$ being the magnetic diffusivity). Specifically, the SP current sheet, with an inverse aspect ratio
 $a/L \sim S^{-1/2}$, also leads to a rate of magnetic field annihilation also proportional to
 $S^{-1/2}$. Several attempts to remedy this conundrum involved locally enhancing the value of diffusivity (reducing
 $S$) through anomalous resistivity (AR) allowing SP stationary states to transition to the much faster steady-state Petschek configuration (Petschek Reference Petschek1964). However, as discussed, for example, in Shibata & Tanuma (Reference Shibata and Tanuma2001) and Singh & Subramanian (Reference Singh and Subramanian2007), anomalous resistivities also require the formation of extremely small scales in the plasma. MHD simulations in the 1980s (Biskamp Reference Biskamp1986) showed that the SP stationary reconnecting current sheet becomes unstable to an extremely fast super-tearing, or plasmoid instability, once a critical value for the Lundquist number
 $S_c$, of order
 $10^4$, is exceeded. Studies of the stability of the SP, typically neglecting the effects of flows, led to the definition of the so called super-tearing or plasmoid-chain instability (Loureiro et al. Reference Loureiro, Schekochihin and Cowley2007; Bhattacharjee et al. Reference Bhattacharjee, Huang, Yang and Rogers2009; Bhattacharjee, Sullivan & Huang Reference Bhattacharjee, Sullivan and Huang2010), where the formation and ejection of a large number of plasmoids from the reconnecting sheet was predicted, similar in many ways to the plasmoid-induced reconnection concept and fractal reconnection model introduced previously by Shibata & Tanuma (Reference Shibata and Tanuma2001).
More recently, two-dimensional linear MHD simulations by Ni et al. (Reference Ni, Germaschewski, Huang, Sullivan, Yang and Bhattacharjee2010) confirmed that, though the effect of flows is negligible when  $S$ is large, its importance increases with decreasing
 $S$. Shi, Velli & Tenerani (Reference Shi, Velli and Tenerani2018) discussed the issue of flows in detail, showing why a non-unique critical Lundquist number
 $S_c$ exists, hovering around
 $S_c\sim 5\times 10^3$, above which threshold SP-type stationary reconnecting configurations become unstable to a fast tearing mode dominated by plasmoid generation. They performed a linear stability numerical analysis of a SP-like current sheet sustained by flows, inwards and outwards from the sheet. They showed that the accelerating outflow has a stabilizing effect on the growth of the instability. This stabilization is, in part, owed to the fact that the growth rate is reduced with respect to the case without flows. However, the most important effect stems from the fact that the accelerating outflow along the sheet stretches the magnetic islands (which therefore have a time-dependent wave number
 $k(t)=k_0 \,\textrm {e}^{-t/\tau _A}$, where
 $k_0$ is the initial value of the wave number and
 $\tau _A$ is the Alfvén speed) and at the same time evacuates them out of the sheet (open boundary conditions). These effects cause a slowdown of the growth of the instability and finally lead to its saturation. The initial growth rate must therefore be large enough (i.e.
 $S$ must be sufficiently large) in order to counteract these stabilizing effects and allow the perturbations to grow enough before saturation occurs. In particular, in Shi et al. (Reference Shi, Velli and Tenerani2018) a growth of a factor 100 in the initial perturbation amplitude gives a critical Lundquist number
 $S_c\geq 2000\text {--}6000$ depending on the initial magnetic field profile. Most space and laboratory plasmas have Lundquist numbers that vastly exceed the critical values for SP stability. However, the plasmoid-chain instability based on SP current sheet scalings, specifically inverse aspect ratios
 $a/L \sim S^{-1/2}$ leads to growth rates that diverge with increasing Lundquist numbers, a result that is inconsistent with any approach to the
 $S\rightarrow \infty$ limit of ideal MHD. This was the basis for the analysis in Pucci & Velli (Reference Pucci and Velli2014) who showed that an aspect ratio scaling with a fractional power of
 $S$ separates slowly unstable current sheets (i.e. with growth-rate scaling as a negative, fractional exponent of the Lundquist number) from those so violently unstable (with a growth-rate scaling as a positive exponent of the Lundquist number, including the SP configuration) that they should never form in the first place. The critically unstable current sheet that defined ideal tearing (IT), was recognized as that having a growth rate, normalized to the Alfvén time along the sheet
 $L$, independent of the Lundquist number itself. In particular, the critical current sheet was shown to be much thicker than a SP sheet, up to a factor of 100, for a Lundquist number of the order of
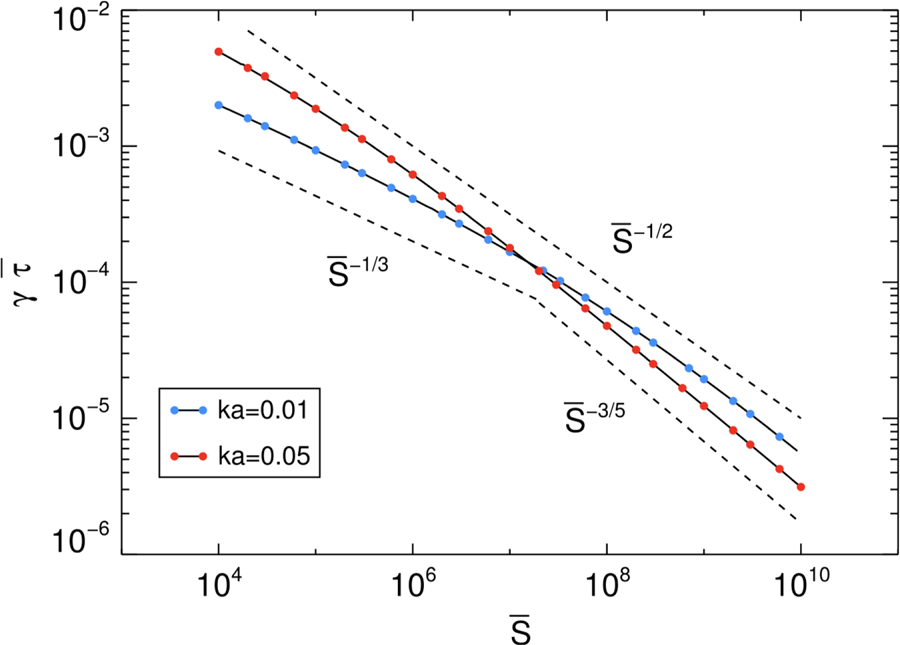
 $10^{12}$, as is typical of astrophysical plasmas. We would like to remark that the IT mode analysis focuses on the maximum growth rate regime. Indeed for very small current sheet thicknesses most of the unstable mode spectrum is available. For a particular plasma environment (i.e. a fixed Lundquist number) figure 7 shows that there is a curve corresponding to wave numbers lying on the envelope of all individual (fixed
 $ka$) dispersion relations, that defines the maximum growth rate regime (
 $\gamma \sim S^{-1/2}$). The latter provides the fastest time over which the instability may develop
 $\tau \sim 1/\gamma$.
Tearing mode growth rate versus Lundquist number  $\bar {S}$ (normalized to
 $a$): transition from the small (constant-
 $\psi$) to the large
 $\varDelta '$ regime for two different wave vectors
 $ka$. The dashed lines represent the asymptotic large
 $\bar {S}$ scaling. The upper dashed line is the envelope of the slope changes for all
 $ka$ occurring at the transition between the two, providing the scaling of the maximum growth rate with
 $\bar {S}$. (Adapted from Tenerani et al. Reference Tenerani, Velli, Pucci, Landi and Rappazzo2016.)

One question, stemming from the previous discussion in terms of linear stability for natural plasmas, is the role played by pre-existing turbulent fluctuations not necessarily of small amplitude. Within a turbulent cascade, these may lead to similar effects, in terms of accelerating reconnection and instability (see, e.g., Servidio et al. Reference Servidio, Matthaeus, Shay, Cassak and Dmitruk2009, Reference Servidio, Matthaeus, Shay, Dmitruk, Cassak and Wan2010, Reference Servidio, Dmitruk, Greco, Wan, Donato, Cassak, Shay, Carbone and Matthaeus2011). On the other hand, the interesting aspect of the thin current instability problem is precisely the divergence of growth rates for vanishing sheet thickness. This implies that any process, including a turbulent cascade or an initial ideal MHD instability, that dynamically leads to such sheet formation will ultimately find itself competing with the dynamics associated with tearing. This is true with the caveat that the nonlinear time scale does not decrease with current sheet thickness (aspect ratio) faster than that associated with the instability. This is the essence of recent papers on reconnection-modified inertial ranges in MHD turbulence (Mallet et al. Reference Mallet, Schekochihin and Chandran2017; Loureiro & Boldyrev Reference Loureiro and Boldyrev2020).
3.1. Breaking the frozen-in condition: the onset problem in collisionless plasmas
It is always possible to generalize the concept of critical thickness or aspect ratio (i.e. the IT criterion), to any flux conservation breaking effect that can be defined by a small parameter  $\epsilon _d$ in the generalized Ohm's law, leading to a violation of the conservation of magnetic flux. If the actual result of the latter is to introduce some effective dissipation, we can obtain a critical exponent
 $\alpha > 0$ such that the scaling
 $a/L\sim \epsilon ^{\alpha }_d$ leads to a growth rate independent of
 $\epsilon _d$ itself. Consider the generalized Ohm's law (see, e.g., Chiuderi & Velli Reference Chiuderi and Velli2015):
 \begin{align} E_{i}+\dfrac{1}{c} (\boldsymbol{v} \times \boldsymbol{B})_{i} &= \dfrac{J_{i}}{\sigma}+\dfrac{m_e}{e^2 n_e} \left[\dfrac{\partial{\boldsymbol{J}}}{\partial t}+\dfrac{\partial}{\partial x_k} \left(J_iU_k+J_kU_i\right)\right] \nonumber\\ &\quad +\dfrac{1}{en_{e}c}\left(\boldsymbol{J} \times \boldsymbol{B} \right)_{i}- \dfrac{1}{en_{e}}\dfrac{\partial P_{ik}^{(e)}}{\partial x_{k}}. \end{align}
In regimes of low-collisionality where resistivity is effectively negligible, the dominant effects violating the ideal Ohm's law are electron inertia and, at smaller scales, the anisotropic electron pressure tensor (for a discussion on the Hall effect, see § 3.3). At the scale at which these effects become important, a kinetic model is required Cai & Lee (Reference Cai and Lee1997) and Scudder et al. (Reference Scudder, Karimabadi, Daughton and Roytershteyn2014). Although the ions can be demagnetized, the magnetic field evolves tied to the electrons and the magnetic flux moving with the electron fluid is conserved. It has been shown (see, e.g., Zenitani et al. Reference Zenitani, Hesse, Klimas and Kuznetsova2011) that in fully kinetic PIC simulations, the contribution of each term in Ohm's law to the reconnection electric field depends on whether the current sheet is symmetric or asymmetric (see figure 8 and the following discussion in this section). When a fluid description of the plasma is adopted, the electron skin depth  $d_e = c/\omega _{\textrm {pe}}$ often appears as the only non-ideal term driving collisionless tearing modes. In this case,
 $\epsilon _d=d_e/L$ (or
 $\epsilon _d=(d_e/L)^2$ depending on the normalization of the equations). Del Sarto et al. (Reference Del Sarto, Pucci, Tenerani and Velli2016) generalized the IT transition in the reduced MHD (RMHD) regime and an electron MHD (EMHD) regime. In the RMHD regime, a high guide field is assumed and the dynamics occur within the plane, whereas in the EMHD regime, ions do not move and magnetic field is tight to electrons. As in this case the whistler waves are the faster signals propagating within the current sheet, the time for the instability to develop is normalized to the whistler time
 $\tau _W=(a/d_e)^2\varOmega _e^{-1}$, where
 $d_e$ is the electron skin depth,
 $a$ is the thickness of the current sheet and
 $\varOmega _e$ is the electron orbital frequency. In both of the regimes the Hall effect is negligible (see Del Sarto et al. Reference Del Sarto, Pucci, Tenerani and Velli2016). Assuming a Harris current sheet equilibrium, the result is a critical aspect ratio
 $(a/L)_{\textrm {RMHD}}\sim (d^2_e/L^2)^{1/3}$ for the RMHD regime and
 $a/L_{\textrm {EMHD}}\sim (d^2_e/L^2)^{3/16}$. Finite Larmor radius effects are expected to affect kinetic tearing modes through wave–particle resonances (Coppi, Laval & Pellat Reference Coppi, Laval and Pellat1966; Laval, Pellat & Vuillemin Reference Laval, Pellat and Vuillemin1980; Schindler Reference Schindler1974) and thermal features (e.g. multipeaked distributions; see Zelenyi et al. Reference Zelenyi, Artemiev, Malova and Popov2008) or temperature anisotropies (see Hewett, Frances & Max Reference Hewett, Frances and Max1988). These effects resulted in lowering the instability threshold (Del Sarto et al. Reference Del Sarto, Pucci, Tenerani and Velli2016).
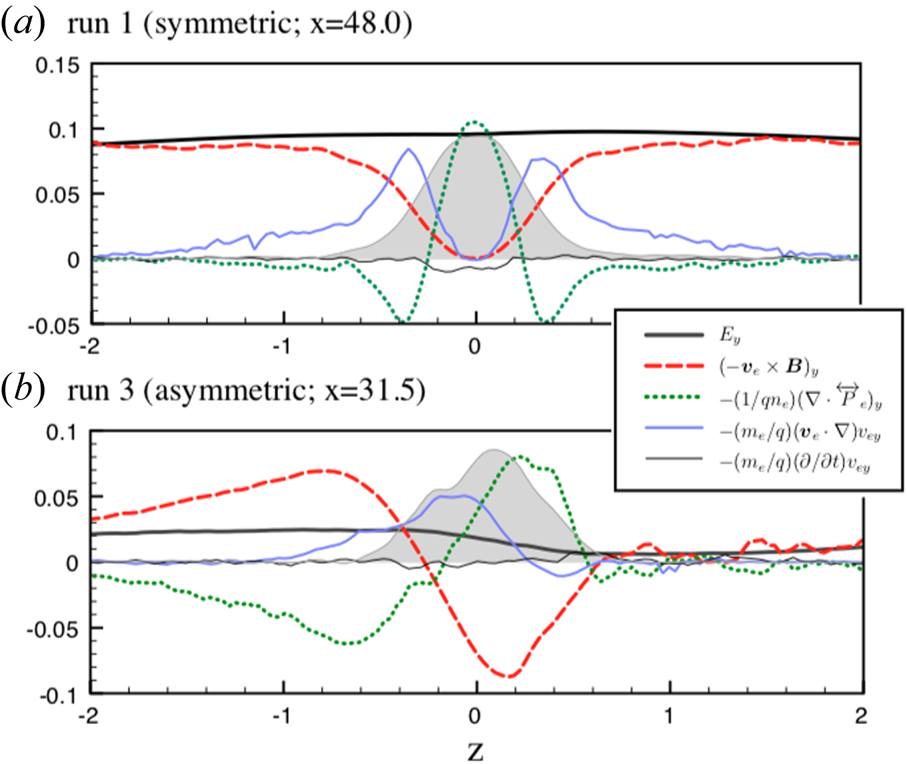
(a) Symmetric and (b) asymmetric composition of the reconnection electric field  $E_y$ along the inflow line in a PIC simulation, adapted from Zenitani et al. (Reference Zenitani, Hesse, Klimas and Kuznetsova2011). The shaded area presents a rescaled value of the dissipation measure, which indicates the dissipation region (for further discussions on the dissipation measure, see Zenitani et al. Reference Zenitani, Hesse, Klimas and Kuznetsova2011).

In the range of parameters where the RMHD or EMHD are valid, we expect reconnection to be triggered at the aspect ratios found previously. As an example, useful for numerical applications in the RMHD case (relatively strong guide field  $B_z \sim 5\text {--}10 B_0$), a current sheet of
 $L=100 d_i$ and a mass ratio of
 $m_i/m_e=25$ is assumed. In this case, we obtain
 $a \sim 0.6 d_i$, meaning a current sheet that has a total initial thickness of
 $a=d_i$ is not actually suitable for the study of the onset of magnetic reconnection, being already of the order of the instability threshold (the trigger condition suggests an order of magnitude).
For real mass ratios, the threshold predicted requires a fully kinetic treatment.
Most of what we know about kinetic-scale reconnection comes from simulations, in particular, PIC simulations (Hesse et al. Reference Hesse, Birn and Kuznetsova2001a; Horiuchi et al. Reference Horiuchi, Pei and Sato2001; Pritchett Reference Pritchett2001; Shay et al. Reference Shay, Drake, Rogers and Denton2001b). In terms of the violation of the frozen-in conditions, as mentioned previously, the Ohm's equation balance actually depends on the configuration being symmetric or asymmetric (Zenitani et al. Reference Zenitani, Hesse, Klimas and Kuznetsova2011). In the symmetric case, the electron pressure tensor balances the reconnection electric field at the centre, whereas it is the bulk inertial term in the surrounding regions. In asymmetric reconnection, the field reversal and the stagnation point do not occur in the same location. This means different terms contribute at each location to the reconnection electric field. One of the significant aspects for the onset of reconnection in the asymmetric case is that the time derivative term is a key contributor in some regions (upper side,  $z=0.6$ in figure 8). This suggests that, in general, during the onset of reconnection, when the dynamics is particularly fast, the time derivative terms in (3.1) might play a significant role.
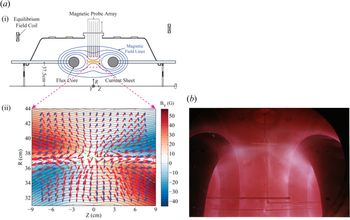
Collisionless reconnection and its onset has also been studied analytically. Hesse et al. (Reference Hesse, Zenitani, Kuznetsova and Klimas2009) developed an analytical theory of collisionless magnetic reconnection in a symmetrical pair-plasma system. Neglecting the heat flux they derived a model of dissipation from the full particle pressure tensor, balancing the reconnecting electric field. Owing to the fact that most of the information on collisionless magnetic reconnection comes from laboratory plasmas (e.g. the Magnetic reconnection experiment (MRX), weakly collisional) and from the magnetosphere, much effort has been devoted to understanding collisionless reconnection in a magnetotail-like configuration. In the latter case, the topological configuration of magnetic field, as mentioned previously, presents a normal component (see § 2.2). As shown in Coroniti (Reference Coroniti1980), assuming the electrons are adiabatic, the modification of the electron distribution function, once a magnetic perturbation is introduced, produces a significant temperature anisotropy. The attempt of the plasma to remove the charge imbalance also results in the development of an electrostatic potential Lembege & Pellat (Reference Lembege and Pellat1982). This response prevents the tearing instability from developing as changes in the perturbed state, that is, in the electron distribution, are energetically unfavourable as a result. In order to break the frozen-in conditions electron adiabatic motion must be violated, possibly due to pitch angle scattering processes, the latter depending on the wave modes exciting the system (Coroniti Reference Coroniti1980).
3.2. Anomalous resistivity
Anomalous transport, different from the binary collision transport, is due to the interaction between the particles and the self-generated turbulence by their collective interactions. The effect of this kind of interaction plays a role of an effective resistivity in the plasma. Whether turbulence-induced AR can facilitate fast magnetic reconnection in collisionless plasma has been a subject of active debate for decades. In addition, wave–particle interaction generating AR is often a result of the primary reconnection onset, becoming interesting in the context of boosting magnetic reconnection and enhancing particle energization. Still, we would like to briefly discuss here the main results on the role of AR as a possible mechanism to break the magnetic frozen-in conditions.
The main candidates to generate AR in the proximity of the reconnection region are the lower hybrid drift instability (LHDI) waves and the drift kink instability (DKI) waves. The theory predicts the fastest growing modes for LHDI, with a wavelength on the electron gyro-scale  $k\rho _e\sim 1$, to be localized on the edge of the current layer (Huba, Drake & Gladd Reference Huba, Drake and Gladd1980), making them ineffective to produce AR. In the MRX experiment Ji et al. (Reference Ji, Terry, Yamada, Kulsrud, Kuritsyn and Ren2004) it has been found that the magnitude of all the fluctuations from the right-hand polarized whistler wave branch (propagating obliquely to the reconnecting magnetic field) up to the lower-hybrid frequency range cause an enhancement of reconnection rates. Still, as mentioned previously, the strong coherence lengths suggest these fluctuations play a significant role in the nonlinear phase of reconnection. Daughton, Lapenta & Ricci (Reference Daughton, Lapenta and Ricci2004) discussed the role of the LHDI in increasing the nonlinear growth rate of the tearing instability, caused by the wave–particle interaction generated electron anisotropy, to which the tearing growth rate resulted to be particularly sensitive. In two-dimensional guide field reconnection simulations, Munõz, Büchner & Kilian (Reference Munõz, Büchner and Kilian2017) observed excitation of turbulence modes due to streaming instability, generating a patchy electric field, similar to what has been found by Pritchett (Reference Pritchett2013). Part of the energy transfer between the field and the particles, through
 $\omega _{\textrm {ci}}$ (ion cyclotron frequency) and
 $\omega _{\textrm {LH}}$ (lower hybrid wave frequency) particle–wave interaction, turns out to be irreversible but most of the electric field is actually supported by the electron pressure tensor. Moritaka, Horiuchi & Ohtani (Reference Moritaka, Horiuchi and Ohtani2007) investigated the role of the DKI in generating AR, resulting in the violation of the frozen-in constraints. As predicted by the theory, LHDI develops at the edge of the sheet. After the saturation of the LHDI, the DKI grows at the neutral sheet causing an electric field that leads to the reduction of the magnetic flux. We would like to stress that the direct current electric field generated here occurs for the late nonlinear phase of the modes interaction with particles, after the saturation of the LHDI. Still, in terms of time for the instability to develop, that takes around
 $t\omega _{\textrm {ci}}\sim 25$. This would be worth investigating in three-dimensional local simulations of reconnection, for example in a similar set-up with respect to Fujimoto & Sydora (Reference Fujimoto and Sydora2012), possibly allowing (i) more space in the direction orthogonal to the plane and (ii) sufficiently large current sheets (
 $a > d_i$ as is usually observed in the magnetotail by, e.g., Sanny et al. Reference Sanny, McPherron, Russell, Baker, Pulkkinen and Nishida1994; Sergeev et al. Reference Sergeev, Vagina, Kauristie, Koskinen, Huuskonen, Pajunpaa, Pellinen, Phan, Angelopoulos and Lin1998; Runov et al. Reference Runov, Sergeev, Nakamura, Baumjohann, Zhang, Asano, Volwerk, Vörös, Balogh and Rème2005), introducing fluctuations in the direction orthogonal to the reconnection plane.
3.3. The Hall effect
A Hall current is generated by the relative motion of electrons and ions within a plasma, because of their charge to mass ratio difference. It appears in the fluid treatment in the generalized Ohm's law, see the first term in the second row of (3.1). Even if the Hall effect on its own cannot break the frozen-in conditions, that is, collisions and/or the inertial terms in Ohm's law proportional to  $d_e$ are necessary for reconnection to occur, it is often invoked in MHD as a mechanism that enhances the reconnection rate. Indeed the Geospace Environmental Modeling (GEM) challenge concluded that in the Hall-MHD regime reconnection was significantly faster than the standard MHD regime (Birn et al. Reference Birn, Drake, Shay, Rogers, Denton, Hesse, Kuznetsova, Ma, Bhattacharjee and Otto2001). We discuss here the role it plays in the onset problem and, consequently, how it can affect the plasmoid reconnection scenario. When the characteristic length scales of the plasma dynamics approach the ion inertial length, the Hall effect must be taken into account. The reconnection region is affected through the appearance of a quadrupolar magnetic field, induced by the Hall current itself. This quadrupolar structure and so the Hall reconnection dynamics has been observed in the magnetosphere (Mozer, Bale & Phan Reference Mozer, Bale and Phan2002; Cattell et al. Reference Cattell, Dombeck, Wygant, Drake, Swisdak, Goldstein, Keith, Fazakerley, André and Lucek2005; Eastwood et al. Reference Eastwood, Phan, Mozer, Shay, Fujimoto, Retinò, Hesse, Balogh, Lucek and Dandouras2007; Frank, Artemyev & Zelenyi Reference Frank, Artemyev and Zelenyi2016), at the day-side magnetopause Vaivads et al. (Reference Vaivads, Khotyaintsev, André, Retinò, Buchert, Rogers, Décréau, Paschmann and Phan2004) and in the near-Earth magnetotail (Vaivads et al. Reference Vaivads, Khotyaintsev, André, Retinò, Buchert, Rogers, Décréau, Paschmann and Phan2004; Borg et al. Reference Borg, Øieroset, Phan, Mozer, Pedersen, Mouikis, McFadden, Twitty, Balogh and Rème2005; Nakamura Reference Nakamura2006), as well as in laboratory experiments (Cothran et al. Reference Cothran, Landreman, Brown and Matthaeus2005; Ren et al. Reference Ren, Yamada, Gerhardt, Ji, Kulsrud and Kuritsyn2005; Yamada et al. Reference Yamada, Ren, Ji, Breslau, Gerhardt, Kulsrud and Kuritsyn2006; Tharp et al. Reference Tharp, Yamada, Ji, Lawrence, Dorfman, Myers, Yoo, Huang and Bhattacharjee2013; Kaminou, Inomoto & Ono Reference Kaminou, Inomoto and Ono2016). The current understanding of kinetic scales has been particularly improved thanks to the new observations from the Magnetospheric Multiscale (MMS) mission, whose data provides insight into the electron diffusion region in the proximity of the reconnection site (Burch & Phan Reference Burch and Phan2016), helping the numerical community.
From an analytical point of view, Terasawa (Reference Terasawa1983) demonstrated that the Hall effect produces a growth rate enhancement at high Lundquist numbers. Pucci et al. (Reference Pucci, Velli and Tenerani2017) reinterpreted the results from Terasawa (Reference Terasawa1983) in the IT framework, that is, imposing a growth rate of the tearing instability that does not depend on the Lundquist number, resulting in a critical aspect ratio that scales as
 \begin{equation} \dfrac{a}{L}\sim S^{-\alpha}P_h^{\beta}, \end{equation}
where  $P_h:=S^{1/2}d_i/L$. They numerically showed in this case the asymptotic growth rate of the tearing instability is Alfvénic, independent of the Lundquist number and the ion inertial length itself. Shi et al. (Reference Shi, Tenerani, Velli and Lu2019) performed a series of Hall-MHD simulations, testing the results for the primary reconnection site onset discussed in Pucci et al. (Reference Pucci, Velli and Tenerani2017). Shi et al. (Reference Shi, Tenerani, Velli and Lu2019) focused on how the Hall effect modifies the recursive collapse trigger of reconnection. They showed that the reconnection rate, the dissipation property and the power spectra are modified significantly. This behaviour is connected with the change in the dynamics of the onset of secondary recursive reconnection sites: once the ion inertial length becomes of the order of the inner, singular layer, reconnection transits from the plasmoid-dominant regime to an intermediate plasmoid plus Hall regime and, finally, to the Hall-dominant regime. From the linear point of view, progress was made in the study of the oblique tearing mode in the presence of a strong guide field and the introduction of kinetic effects. Drake & Lee (Reference Drake and Lee1977) provided a linear collisionless tearing mode theory, considering the stabilization of oblique modes, investigating both density and temperature gradient effects, within the constant-
 $\psi$ approximation. Baalrud, Bhattacharjee & Huang (Reference Baalrud, Bhattacharjee and Huang2012) and Baalrud, Bhattacharjee & Daughton (Reference Baalrud, Bhattacharjee and Daughton2018) showed that, in the latter regime, corresponding to relatively large wave numbers along the unperturbed tearing unstable field component, the fastest growing modes have finite
 $k_z$, where
 $k_z$ is the wave number along the guide field. Shi et al. (Reference Shi, Velli, Pucci, Tenerani and Innocenti2020) studied the linear stability of the tearing mode in the Hall regime, including a guide field. They showed that the presence of a strong guide field does not modify the most unstable mode in the two-dimensional wave vector space orthogonal to the current gradient direction. Although the eigenfunctions become asymmetric and the oblique mode has a dispersive, wave-like component, the most unstable mode remains the fastest growing mode in the reconnection plane (see also figure 7 for the transition between different in-plane modes). The result is that the growth rates do not substantially change in the presence of a guide field, even if there is a coupling due to the Hall effect. Finally, if the guide field is very strong
 $B_g\rightarrow \infty$, where
 $k_z$ is the wave number along the guide field, Shi et al. (Reference Shi, Velli, Pucci, Tenerani and Innocenti2020) showed that based on the resonance condition
 ${k}\cdot {B}=0\Rightarrow k_z\rightarrow 0$.
As discussed in Birn et al. (Reference Birn, Drake, Shay, Rogers, Denton, Hesse, Kuznetsova, Ma, Bhattacharjee and Otto2001), if the resistivity is very small, reconnection is supported in current sheets that are of the order of the electron skin depth  $d_e=c/\omega _{\textrm {pe}}$, so we expect the physics and the onset condition to be different from the resistive case. What is particularly interesting in this case is, as reported in Birn et al. (Reference Birn, Drake, Shay, Rogers, Denton, Hesse, Kuznetsova, Ma, Bhattacharjee and Otto2001), the thickness in fully kinetic simulations (see, e.g., Hesse, Birn & Kuznetsova Reference Hesse, Birn and Kuznetsova2001b) is larger than the electron skin depth, even if particle jets involve a region of thickness
 ${\sim} d_e$. Daughton et al. (Reference Daughton, Roytershteyn, Karimabadi, Yin, Albright, Bergen and Bowers2011) showed that, in collisionless three-dimensional reconnection with a finite guide field, the three-dimensional evolution is dominated by the formation and interaction of flux ropes with specific helicities configurations, the majority of which are produced by secondary instabilities within the electron layers. Although this regards more the evolution than the onset of reconnection, it is worth noting that new flux ropes spontaneously appear within these layers, leading to a turbulent evolution where electron physics plays a central role, and multiple resonant surfaces can form. The transition from the fluid to kinetic scales is indeed one of the main topics in the context of the onset of magnetic reconnection and although widely explored with simulations it remains an open question.
3.4. The phase diagram: summarizing the reconnection trigger
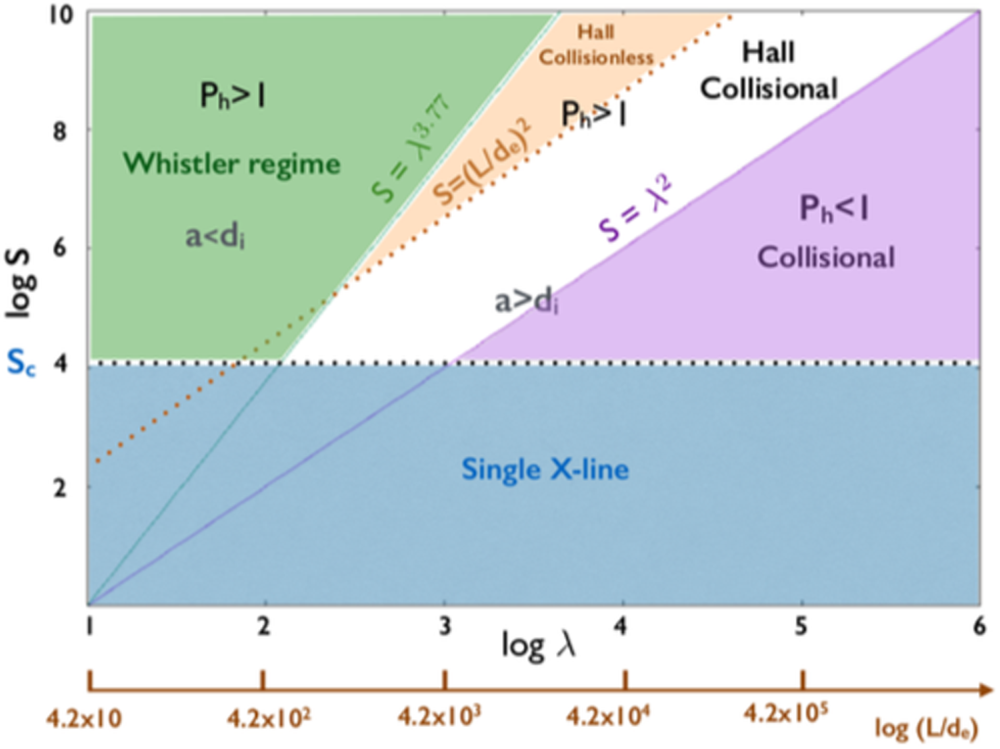
To help clarify reconnection onset and dynamics, phase diagrams involving Lundquist number and the macroscopic system size in units of the ion inertial length (or ion sound gyro-radius, if a guide field is present) were presented for the first time in Ji & Daughton (Reference Ji and Daughton2011). The goal is to summarize reconnection dynamics of plasmas over a wide range of parameters. An example is shown in figure 9, which summarizes the results obtained using the IT criterion (Del Sarto et al. Reference Del Sarto, Pucci, Tenerani and Velli2016; Pucci et al. Reference Pucci, Velli and Tenerani2017), in the absence of a guide field (in the figure,  $\lambda =L/d_i$). The idea is very similar to Ji & Daughton (Reference Ji and Daughton2011): there is a blue region where the single
 $X$-line reconnection is believed to occur. The upper boundary of this region, corresponding to the critical Lundquist number for plasmoid development, is determined by inflows and outflows; in particular, for simulations, the line location depends on the initial noise (Shi et al. Reference Shi, Velli and Tenerani2018), as discussed in § 3. Transition from one domain to the other mainly depends on the trigger condition for reconnection and the relative physics of the plasma of interest. For example, the purple region in figure 9 represents the study of the IT in the resistive reconnection regime (Pucci & Velli Reference Pucci and Velli2014) and the white region is the Hall-MHD regime (Pucci et al. Reference Pucci, Velli and Tenerani2017; Shi et al. Reference Shi, Tenerani, Velli and Lu2019), whereas the orange region has been investigated in Del Sarto et al. (Reference Del Sarto, Pucci, Tenerani and Velli2016) (the latter actually neglects the Hall effect). The green region cannot be investigated with a single- nor two-fluid model, but requires a kinetic treatment. This leads us back to the open question in § 3.3: how can we describe the onset of magnetic reconnection at kinetic scales and what is the connection with the fluid scales?
Revision of the phase diagram in Ji & Daughton (Reference Ji and Daughton2011) on the basis of the results in Pucci & Velli (Reference Pucci and Velli2014), Del Sarto et al. (Reference Del Sarto, Pucci, Tenerani and Velli2016) and Pucci et al. (Reference Pucci, Velli and Tenerani2017). On the horizontal axis,  $\lambda =L/d_i$ is the macroscopic length of the system, normalized to the ion inertial length; on the vertical axis
 $S=L v_A/\eta$, where
 $v_A$ is the Alfvén speed and
 $\eta$ the magnetic diffusivity. The diagram summarizes, depending on the parameters
 $\lambda$ and
 $S$, the dynamics that is expected to develop in a plasma. Colours label regions where different terms of the generalized Ohm's law are important, changing the magnetic reconnection onset trigger condition and the number of islands. (Adapted from Pucci et al. Reference Pucci, Velli and Tenerani2017.)

Figure 9 also lacks a discussion of the case of guide field reconnection, in particular the case of an intermediate guide field, in which  $B_z/B_0\sim 1$, where
 $B_z$ is the guide field and
 $B_0$ is the asymptotic magnitude of the reconnecting magnetic field. In this case, reconnection onset dynamics must be investigated in three dimensions, including the effects of all the oblique modes. Viscosity is also not included in the diagram. Tenerani et al. (Reference Tenerani, Rappazzo, Velli and Pucci2015a) discussed the onset of fast reconnection in the presence of viscosity. They found that a finite Prandtl number has a stabilizing effect on the current sheet, allowing thinner sheets to form before ‘ideal’ reconnection kicks in. These results should also be included in the phase diagram because viscosity may play a role in the solar corona and other astrophysical environments.
The phase diagrams are indeed useful to understanding the ongoing process regime in astrophysical plasmas as well as in laboratory plasmas. In the latter case, they can help to visualize the parameter space of an experimental facility and, for example, in space observations to compare the Hall magnetic and electric fields surrounding the diffusion region, but also jets and diffusion region structure.
3.5. Partially ionized plasmas
Partially ionized plasmas include the effects of neutrals together with charged species (electrons and ions). The ionization degree depends upon the electron–neutral and the electron–ion collision frequencies (Alfvén Reference Alfvén1960), the latter generating an Ohmic-type diffusion (Piddington Reference Piddington1954; Cowling Reference Cowling1956; Ni, Yang & Wang Reference Ni, Yang and Wang2007; Singh & Krishan Reference Singh and Krishan2010), that may affect magnetic reconnection and its onset. In the presence of three different species undergoing collisions, the system can be described by the single-fluid MHD equations, with an appropriately modified magnetic induction equation. As a result, the Hall and the ambipolar effects appear (Krishan & Varghese Reference Krishan and Varghese2008). The Hall effect arises, as discussed in § 3.3, because of the relative drift between the electrons and the ions, so it is also present in fully ionized plasmas. The ambipolar term arises due to the ion–neutral drag. The momentum  $\rho _n {\boldsymbol {v}_{\boldsymbol {n}}}$ of the neutral fluid can be changed only by (i) the fluid pressure; (ii) the gravitational force, if present (Draine Reference Draine1986); (iii) non-reactive scattering with particles of other fluids; and (iv) creation or destruction of neutral particles by chemical processes, including ionization and/or recombination, and charge exchange. Based on these considerations the equation of momentum conservation can be generally written as
 \begin{equation} d_t (\rho_n {\boldsymbol{v}}_n)= -\boldsymbol{\nabla} P_n -\rho_n \boldsymbol{\nabla} \varPhi + {\boldsymbol{F}}_n, \end{equation}
where  $\varPhi$ is the gravitational potential,
 $P_n$ is the pressure of the neutrals and
 ${\boldsymbol {F}}_n$ is the force resulting from non-reactive scattering as well as chemical processes. An example is the effect of ion–neutral collisions for which
 ${\boldsymbol {F}}_n= \rho _n\nu _{\textrm {ni}}(v_n-v_i)= \rho _i\nu _{\textrm {in}}(v_n-v_i)$. Conservation of momentum in collisions implies
 $\nu _{\textrm {ni}}= ({\rho _i}/{\rho _n})\nu _{\textrm {in}}$, that is, depending on the ratio between the density of the ions and neutrals, the associated collision frequency
 $\nu _{\textrm {in}}$ can be larger or smaller than
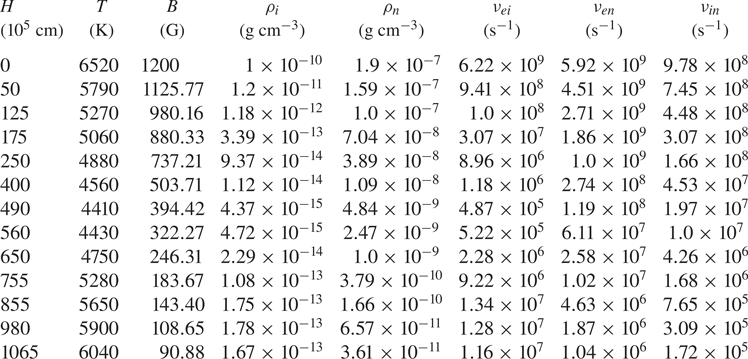
 $\nu _{\textrm {ni}}$. Let us consider, for example, the parameters for the solar photosphere listed in table 1 at different heights. We can see that
 $\rho _n\gg \rho _i$ at all the heights listed, meaning
 $\nu _{\textrm {in}}\gg \nu _{\textrm {ni}}$. For any dynamical process with a characteristic time
 $\tau$, of which magnetic reconnection is a possible example, we then have: a decoupled regime,
 $\tau \ll \tau _{\textrm {in}}\sim {1}/{\nu _{\textrm {in}}}$, in which the process is not affected by the collisions between species; an intermediate regime
 $\tau _{\textrm {in}}\ll \tau \ll \tau _{\textrm {ni}}$; and a fully coupled regime in which
 $\tau \gg \tau _{\textrm {ni}}$, when the collisions are the fastest process occurring in the system.
Solar atmospheric plasma parameters at different heights  $H$ above the photosphere, where
 $T$ is the temperature,
 $B$ is the magnetic field,
 $\rho$ are the density of ions and neutrals, respectively, and
 $\nu$ are the collision frequencies between different species.

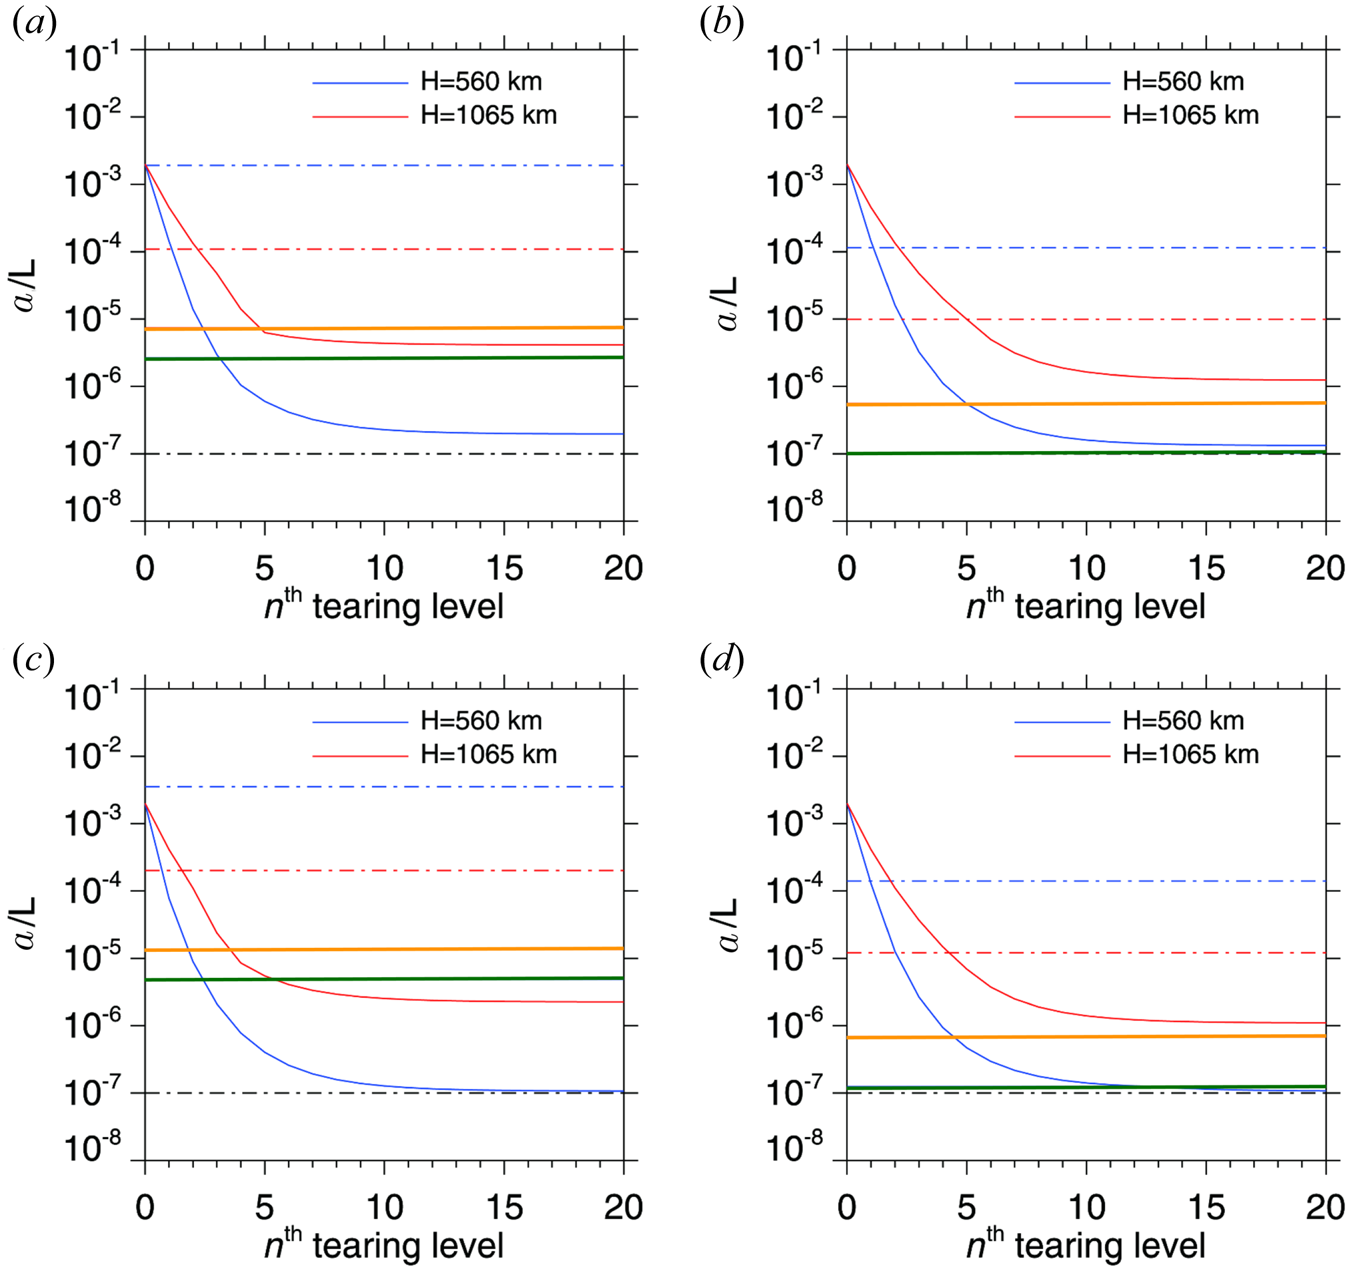
The role of ambipolar diffusion has been studied analytically in the context of magnetic reconnection, showing the strength of coupling between ion and neutrals can affect the reconnection rate, depending on the ion–neutral collisions (Zweibel Reference Zweibel1989; Zweibel et al. Reference Zweibel, Lawrence, Yoo, Ji, Yamada and Malyshkin2011). In Zweibel (Reference Zweibel1989) the Alfvén speed in the decoupled regime is defined with respect to the ion mass density alone, and the current dissipation is shown to increase compared with the standard Ohmic dissipation case. Brandenburg & Zweibel (Reference Brandenburg and Zweibel1994) and Arber, Botha & Brady (Reference Arber, Botha and Brady2009) also showed the current sheet undergoes thinning and enters a regime where the neutrals decouple from ions, and so the growth rate increases. Assuming incompressibility, the same pressure gradient for ion and neutrals, and in a reduced MHD framework, Zweibel (Reference Zweibel1989) calculated the growth rate of the classic tearing instability. Singh et al. (Reference Singh, Hillier, Isobe and Shibata2015) applied this result in the context of the fractal reconnection scenario (Shibata & Tanuma Reference Shibata and Tanuma2001), showing that if the magnetic field in the chromosphere is sufficiently strong, recursive tearing can reach down to kinetic scales, see figure 10. Calculations of critical aspect ratios in this regime, extending the studies of Zweibel (Reference Zweibel1989) to the ‘IT’ scenario including recurrent collapse, are studied in Pucci et al. (Reference Pucci, Singh, Tenerani and Velli2020).
Current sheet inverse aspect ratio (red and blue solid lines)  $a/L$ at the
 $n{\textrm {th}}$ recurring tearing level, where
 $H$ is the height of the photospheric layer considered: (a,b) assume a magnetic field of 1.2 kG, whereas (b,d) assume a magnetic field of 2.2 kG. The dot-dashed horizontal lines show the decoupling length scales (colored) and the ion Larmor radius (black). In panels (a,c) the decoupling length scale is determined by the Alfvén velocity, that is,
 $L_{\textrm {dec}}=v_{\textrm {Ai}}/\nu _{\textrm {in}}$. In panels (b,d) the decoupling length scale is determined by the tearing time scale
 $L_{\textrm {dec}}=(\eta v_{\textrm {Ai}}\nu _{\textrm {in}}^{-1})^{1/3}$. (Adapted from Singh et al. Reference Singh, Hillier, Isobe and Shibata2015.)

Multi-fluid MHD simulations of partially ionized plasmas show that, as a result of the current sheet thinning and elongation, a critical Lundquist number ( $S_{c}$) is reached and plasmoid formation starts (Leake et al. Reference Leake, Lukin, Linton and Meier2012; Leake, Lukin & Linton Reference Leake, Lukin and Linton2013). During the current sheet thinning a stage is reached where the neutrals and ions decouple, and a reconnection rate faster than the single-fluid SP prediction is observed. Ion and neutral outflows are shown to be well coupled, in the sense that the difference between ion and neutral outflow is negligible compared with the magnitude of the ion outflow.
In kinetic systems the collisional–collisionless transition has been predicted to occur when the current sheet thins below the hybrid inertial scale,  $d_i\chi ^{1/2}$ (Malyshkin & Zweibel Reference Malyshkin and Zweibel2011); however, previous two-fluid simulations have not seen this transition (Murphy & Lukin Reference Murphy and Lukin2015; Ni et al. Reference Ni, Lukin, Murphy and Lin2018). Jara-Almonte et al. (Reference Jara-Almonte, Ji, Yoo, Yamada, Fox and Daughton2019) performed fully kinetic simulations of partially ionized reconnection, studying the scaling of the reconnection rate and the transition from collisional to collisionless reconnection. Following the approach of Daughton et al. (Reference Daughton, Roytershteyn, Albright, Karimabadi, Yin and Bowers2009), they ran simulations with current sheets initially thicker than
 $d_i\chi ^{1/2}$, where
 $\chi$ is the ionization degree. In all the cases studied, Jara-Almonte et al. (Reference Jara-Almonte, Ji, Yoo, Yamada, Fox and Daughton2019) found the current sheet thins below
 $d_i\chi ^{1/2}$, but the reconnection rate jumps up only when
 $a\sim d_i$, finding the case
 $\chi \sim 0.05$ does not transition despite satisfying
 $a\sim d_i \chi ^{1/2}>d_i$. Although the low
 $\chi$ can be easily shown to prevent electron further heating and following current sheet collapse, there is currently no clear explanation for the threshold to be the same in this case and the fully ionized case (Daughton et al. Reference Daughton, Roytershteyn, Albright, Karimabadi, Yin and Bowers2009). This work opens interesting questions in the context of partially ionized plasma in collisionless systems.
4. Understanding the onset problem: a common goal of astrophysical, space and laboratory plasmas
Magnetic reconnection has been established to be a widespread physical process, which is active all over the Universe. We have discussed the processes that pave the way to magnetic reconnection mainly in the context of space plasmas, for which we have in situ observations (Burch & Phan Reference Burch and Phan2016; Phan et al. Reference Phan, Bale, Eastwood, Lavraud, Drake, Oieroset, Shay, Pulupa, Stevens and MacDowall2020) and/or a basic knowledge of the magnetic field topology and dynamics (see, e.g., Kohler Reference Kohler2016). Several phenomena in which magnetic reconnection is thought to take place exhibit an explosive character, in the sense that magnetic energy is stored over a long period of time, and then suddenly released on a timescale comparable with fastest timescales in the system. This is why magnetic reconnection has also been suggested as the source of soft gamma-ray repeaters from neutron stars (e.g. Uzdensky et al. Reference Uzdensky, Cerutti and Begelman2011), resulting in AGN non-thermal emission (Kumar & Zhang Reference Kumar and Zhang2015). It is also thought to influence electromagnetic emissions near black holes (Koide, Kudoh & Shibata Reference Koide, Kudoh and Shibata2006), and has been postulated to be active as an acceleration mechanism in the interstellar medium (Zweibel Reference Zweibel1989). For the latter objects, we rely on models in order to predict the magnetic field topology, composition and temperature, that is, the plasma parameter of the environments in which these explosive events take place.
All of the objects discussed have in common a high amount of energy stored in the magnetic field. An example is the jet formation around a rapidly rotating black hole. In such magnetic configurations, there are magnetic flux tubes that bridge the region between the ergosphereFootnote 4 and the corotating disk (Koide et al. Reference Koide, Kudoh and Shibata2006). These can be twisted by the plasma in the ergosphere itself, owing to the frame-dragging effect. The resulting antiparallel configuration for the magnetic field is a good candidate for a reconnection site. Resolving magnetic reconnection in this region requires solving the general relativistic MHD equations, with a resistivity (and/or viscosity) tensor, owing to the proximity of the black hole (Braginskii Reference Braginskii1965). Once the onset process is clarified within the right space of parameters, this can tell us if and how the energy from the rotation can be converted, first, into magnetic pressure and tension, then, into radiation and/or heating that can be observed (Wilms et al. Reference Wilms, Reynolds, Begelman, Reeves, Molendi, Staubert and Kendziorra2001).
In conclusion, even if the onset problem is different for different environments it involves the same physics and drives the same question: when, why, where and how does energy release occur?
4.1. Probing reconnection in situ: MMS and Parker Solar Probe
New insights on magnetic reconnection in different heliospheric contexts have come from observations carried out by the dedicated MMS mission (Burch & Phan Reference Burch and Phan2016; Burch et al. Reference Burch, Torbert, Phan, Chen, Moore, Ergun, Eastwood, Gershman, Cassak and Argall2016) and in the inner heliospheric-solar contexts from the initial observations of Parker Solar Probe (PSP; Bale et al. Reference Bale, Badman, Bonnell, Bowen, Burgess, Case, Cattell, Chandran, Chaston and Chen2019; Howard et al. Reference Howard, Vourlidas, Bothmer, Colaninno, DeForest, Gallagher, Hall, Hess, Higginson and Korendyke2019; Kasper et al. Reference Kasper, Bale, Belcher, Berthomier, Case, Chandran, Curtis, Gallagher, Gary and Golub2019; McComas et al. Reference McComas, Christian, Cohen, Cummings, Davis, Desai, Giacalone, Hill, Joyce and Krimigis2019).
MMS was launched in March 2015 and consists of four satellites, flying in tetrahedral formation at 9–12 Earth radii geocentric; the range of spacecraft separation ranges from 10 km to 400 km (Burch et al. Reference Burch, Moore, Torbert and Giles2016). The mission crossed the boundary of the day-side magnetosphere, the magnetopause, where reconnection is mainly asymmetric, many times (Genestreti et al. Reference Genestreti, Varsani, Burch, Cassak, Torbert, Nakamura, Ergun, Phan, Toledo-Redondo and Hesse2018). It also flew through the magnetotail, where it revealed the physics of guide field collisionless reconnection (Eriksson et al. Reference Eriksson, Wilder, Ergun, Schwartz, Cassak, Burch, Chen, Torbert, Phan and Lavraud2016; Wilder et al. Reference Wilder, Ergun, Eriksson, Phan, Burch, Ahmadi, Goodrich, Newman, Trattner and Torbert2017). The measurements made by MMS exceed in accuracy and time resolution those of previous magnetospheric missions, in particular the higher time resolution that characterizes the plasma measurements (Pollock et al. Reference Pollock, Moore, Jacques, Burch, Gliese, Saito, Omoto, Avanov, Barrie and Coffey2016) but also the accurate three-dimensional DC electric field measurements (Ergun et al. Reference Ergun, Tucker, Westfall, Goodrich, Malaspina, Summers, Wallace, Karlsson, Mack and Brennan2016; Torbert et al. Reference Torbert, Russell, Magnes, Ergun, Lindqvist, Le Contel, Vaith, Macri, Myers and Rau2016), and current density detection at 30 ms resolution, capable of resolving electron-scale currents (see, e.g., Burch et al. Reference Burch, Moore, Torbert and Giles2016). With these capabilities the main goal of MMS is to probe electron-scale physics in and around electron dissipation/diffusion regions encountered. There are many results on reconnection fields generation (e.g. Torbert et al. Reference Torbert, Burch, Giles, Gershman, Pollock, Dorelli, Avanov, Argall, Shuster and Strangeway2016), particles heating and acceleration (e.g. Chen et al. Reference Chen, Hesse, Wang, Gershman, Ergun, Pollock, Torbert, Bessho, Daughton and Dorelli2016), wave activity (e.g.Vörös et al. Reference Vörös, Yordanova, Graham, Khotyaintsev and Narita2019). In terms of reconnection onset, based on previous studies (e.g.Wei et al. Reference Wei, Cao, Zhou, SantolíK, RèMe, Dandouras, Cornilleau-Wehrlin, Lucek, Carr and Fazakerley2007), Cao et al. (Reference Cao, Fu, Cao, Wang, Graham, Chen, Peng, Huang, Khotyaintsev and André2017), who observed whistlers prior to reconnection and enhancement of whistlers during reconnection in the Earth's magnetotail using the Cluster data, suggested that whistler modes might enable or modify reconnection at the magnetopause. As discussed in § 3.2, wave generation at the reconnection site, possibly resulting in AR, has not yet been clarified (e.g. the role of lower hybrid drift waves; see Le Contel et al. (Reference Le Contel, Nakamura, Breuillard, Argall, Graham, Fischer, Retinò, Berthomier, Pottelette and Mirioni2017)). Still, investigating these effective resistivities can help to understand their role and timescales in the context of reconnection onset and energy conversion.
An interesting finding in terms of triggering magnetic reconnection is the study carried out by Hamrin et al. (Reference Hamrin, Gunell, Goncharov, De Spiegeleer, Fuselier, Mukherjee, Vaivads, Pitkänen, Torbert and Giles2019). They observed an interplanetary directional discontinuity crossing the bow shock, simultaneously with the MMS satellites. The crossings are observed as transitions between the cold, low-density and high-speed solar wind, and the lower-speed shocked magnetosheath plasma with increased density and magnetic field strength. They suggested this kind of discontinuity can temporarily trigger magnetic reconnection at the bow shock while crossing it. Even if reconnection jets were not observed directly, the typical quadrupolar Hall field was detected, showing an asymmetry in the possible reconnection site. A recent study by Genestreti et al. (Reference Genestreti, Farrugia, Lu, Phan, Baker, Vines, Cohen, Bingham and Shuster2020) involving measurements by MMS, Wind and THEMIS satellites together, discusses the initial conditions, pre-conditioning and onset of magnetic reconnection in the tail. In the event studied, initially, the tail current sheet is thick, with a strong normal component of magnetic field ( $B_z/B_0\sim 20\text {--}30\,\%$). The WIND satellite measures two sharp enhancements of the dynamic pressure in the solar wind, separated by about 2 hours. Starting immediately after the first dynamic pressure enhancement, the normal component of the field measured by MMS gradually decreased, together with the current sheet half thickness. During this process, lasting about 2 hours, the current sheet thickness shrinks to about
 $4d_i$, the cross-tail current increases and the normal magnetic field is reduced to
 $B_z\sim 0$. Interestingly, at the same time the dynamic pressure in the solar wind slowly decreases, indicating the current sheet thinning was stimulated by the wind compression, but then proceeded without any further compression. The second solar wind dynamic pressure pulse triggers a rapid (
 ${\sim }10$ min) collapse of the current sheet below the ion scale. During the rapid current sheet collapse a Hall field appears, whereas the reconnection electric field increases. Ion speed grows and it reverses in the outflow direction, indicating particle ejecta. Many Electron Diffusion Regions (EDRs) and kinetic-scale flux ropes are observed in the outflow exhausts. This remarkable reconstruction of the tail dynamics, is unique not only for the information provided both at large scales (Wind, THEMIS) and small scales (MMS) but also for the self-collapsing sheet dynamics presented, which is a fundamental information for building a model of magnetic reconnection onset.
PSP (Fox et al. Reference Fox, Velli, Bale, Decker, Driesman, Howard, Kasper, Kinnison, Kusterer and Lario2016) launched in the early morning of 12 August 2018 carrying four suites of instruments devoted to the measurements of particles, electromagnetic fields and the white light observation of coronal and heliospheric structure: SWEAP, (Kasper et al. Reference Kasper, Abiad, Austin, Balat-Pichelin, Bale, Belcher, Berg, Bergner, Berthomier and Bookbinder2016), thermal protons, electrons and alphas;  $\textrm {IS}\varTheta \textrm {IS}$ (McComas et al. Reference McComas, Alexander, Angold, Bale, Beebe, Birdwell, Boyle, Burgum, Burnham and Christian2016) energetic electrons and ions; FIELDS, electromagnetic fields, (Bale et al. Reference Bale, Goetz, Harvey, Turin, Bonnell, Dudok de Wit, Ergun, MacDowall, Pulupa and Andre2016); WISPR (Vourlidas et al. Reference Vourlidas, Howard, Plunkett, Korendyke, Thernisien, Wang, Rich, Carter, Chua and Socker2016), white light imaging. PSP reached its first perihelion on 6 November at a distance of 35.7 solar radii (
 $R_s$) from the centre of the Sun, closer by almost a factor of 2 than the minimum distance reached by previous spacecraft. During the first orbit, PSP encountered a large number of current sheets in the solar wind, and observed reconnection occurring in ICMEs, in heliospheric current sheet (HCS) crossings and in the regular solar wind (Phan et al. Reference Phan, Bale, Eastwood, Lavraud, Drake, Oieroset, Shay, Pulupa, Stevens and MacDowall2020). Many of the reconnecting current sheets were bifurcated, resembling Petscheck's model (Petschek Reference Petschek1964) of reconnection with a pair of slow-shock/RD-like structures bounding the exhaust. About half of the reconnection events had magnetic shear less than
 $90^\circ$, and one case had a magnetic shear of
 $27^\circ$, that is, a guide field of 4. The extreme low-shear current sheets produced plasma jetting as slow as
 $10\ \textrm {km}\ \textrm {s}^{-1}$ (relative to the external flows). Magnetic reconnection in ICMEs is important as it can cause erosion and changes to the magnetic field structure with consequences on the geo-effectiveness at Earth. PSP measurements showed reconnection occurring within ICMEs at distances as close as 54
 $R_S$. The PSP detection of well-established reconnection exhausts in the HCS observed inside of 61
 $R_s$ indicates magnetic topology reconfiguration around the HCS, or perhaps the ongoing HCS formation process developing around the helmet streamer stalks. This appears to be confirmed by the observations of the magnetic islands resulting from tearing in white light images of the forming sheet closer to the Sun by WISPR, shown in figure 11 (Howard et al. Reference Howard, Vourlidas, Bothmer, Colaninno, DeForest, Gallagher, Hall, Hess, Higginson and Korendyke2019). If the latter interpretation is correct, the HCS crossings of future orbits, occurring ever closer to the helmet streamer tips, should shed new light on the instability of the forming HCS and the origin of the slow solar wind. Probe at perihelion appeared to be immersed in solar wind coming from a rapidly expanding small coronal hole (Bale et al. Reference Bale, Badman, Bonnell, Bowen, Burgess, Case, Cattell, Chandran, Chaston and Chen2019; Panasenco et al. Reference Panasenco, Velli, D'Amicis, Shi, Réville, Bale, Badman, Kasper, Korreck and Bonnell2020). Though very large magnetic field inversions in the radial magnetic field were observed throughout the interval, these were not reconnecting current sheets but rather large-amplitude Alfvénic structures and rotational discontinuities, associated with bursty radial jets (Kasper et al. Reference Kasper, Bale, Belcher, Berthomier, Case, Chandran, Curtis, Gallagher, Gary and Golub2019). These structures, belonging to the low-frequency regime of solar wind turbulence, do not appear to be reconnecting.
Five images taken by the WISPR telescopes on PSP. The radial range is shown at the top. The yellow and red arrows point to plasmoids ejected along the forming HCS. (From Howard et al. Reference Howard, Vourlidas, Bothmer, Colaninno, DeForest, Gallagher, Hall, Hess, Higginson and Korendyke2019.)

4.2. Reconnection in laboratory plasmas: MRX and merging spheromaks
In the context of laboratory plasmas, magnetic reconnection appeared early on as an obstacle to magnetic field confinement in fusion-related experiments. In such experiments, the onset of reconnection may be considered to be spontaneous, in the sense that it was not directly driven by experimental conditions but rather the instabilities occurring in the plasma. Reconnection-dedicated experiments, on the other hand, have all been driven, starting from the 3D-CS experiments (Frank Reference Frank1974; Ji Reference Ji2019a) in Russia in 1970, with the goal of investigating its properties (see Yamada et al. Reference Yamada, Kulsrud and Ji2010, Reference Yamada, Yoo and Zenitani2016 for reviews). There are also experiments such as PROTO-SPHERA, which relies on reconnection to drive a toroidal current, via helicity transfer from an electrode-driven poloidal current (in the absence of any inductively applied toroidal electric; field, see Alladio et al. Reference Alladio, Costa, Mancuso, Micozzi, Papastergiou and Rogier2006; Lampasi et al. Reference Lampasi, Alladio, Maffia and Boncagni2016).
In laboratory experiments, reconnection is achieved either by merging spherical flux tubes (see, e.g., Yamada et al. Reference Yamada, Ji, Hsu, Carter, Kulsrud, Bretz, Jobes, Ono and Perkins1997; Kornack Reference Kornack1998; Matthaeus et al. Reference Matthaeus, Cothran, Landreman and Brown2005; Ono Reference Ono2019; Ono et al. Reference Ono, Tanabe, Kamiya, Tanaka, Cai, Cao, Junguang, Gryaznevich, Usami and Horiuchi2019) or in the reverse field configuration (RFC), for example, by driving changes in the magnetic field topology, through the time variation of the current inducing the magnetic field itself (see, e.g., Ren et al. Reference Ren, Yamada, Gerhardt, Ji, Kulsrud and Kuritsyn2005; Yamada et al. Reference Yamada, Ren, Ji, Breslau, Gerhardt, Kulsrud and Kuritsyn2006; Ono Reference Ono2016; Yamada Reference Yamada2019). In particular, reconnecting plasma in a spheromak machine is obtained by merging two rings of plasma magneto-fluid called, indeed, spheromaks. In this configuration, magnetic flux tubes, generated by coaxial plasma guns, have naturally strong magnetic fields and are characterized by low  $\beta$, meaning the plasma dynamics is governed by the magnetic field. Once generated at the ends of a vacuum chamber, the two opposite magnetic field polarity spheromaks can be translated in to the region in the centre where the experiment takes place (Yamada et al. Reference Yamada, Ji, Hsu, Carter, Kulsrud, Bretz, Jobes, Ono and Perkins1997; Kornack Reference Kornack2001). The plasma guns can create left- or right-handed spheromaks by switching the polarity on the stuffing field magnet, and so the polarity of the poloidal magnetic field, allowing the study of same helicity or opposite helicity merging flux tubes (see, e.g., Yamada et al. Reference Yamada, Ji, Hsu, Carter, Kulsrud, Bretz, Jobes, Ono and Perkins1997; Tsuruda, Ono & Katsurai Reference Tsuruda, Ono and Katsurai2002).
The MRX can work in a variety of configurations and regimes (Ren et al. Reference Ren, Yamada, Gerhardt, Ji, Kulsrud and Kuritsyn2005; Yamada et al. Reference Yamada, Ren, Ji, Breslau, Gerhardt, Kulsrud and Kuritsyn2006, Reference Yamada, Yoo, Jara-Almonte, Ji, Kulsrud and Myers2014), with Lundquist numbers up to  $S\sim 10^3$, that is, in a weakly collisional regime. figure 12(a) (Zweibel & Yamada Reference Zweibel and Yamada2016) shows the configuration in which, initially, two toroidal plasmas with annular cross-section are formed around two flux cores. Magnetic reconnection is induced by driving oppositely directed field lines towards the
 $X$-point, reducing the current in the two flux cores; this is the so-called ‘pulling’ configuration. The half length of the reconnection layer achieved by MRX,
 $L\sim 3 d_i$ (Sitnov et al. Reference Sitnov, Birn, Ferdousi, Gordeev, Khotyaintsev, Merkin, Motoba, Otto, Panov and Pritchett2019). Indeed MRX has been used to study the role of kinetic effects, such as the Hall effect (Ren et al. Reference Ren, Yamada, Gerhardt, Ji, Kulsrud and Kuritsyn2005) and mechanisms supporting reconnection (Fox et al. Reference Fox, Sciortino, Stechow, Jara-Almonte, Yoo, Ji and Yamada2017) in comparison with what has been found in PIC simulations (Ricci et al. Reference Ricci, Brackbill, Daughton and Lapenta2004; Swisdak et al. Reference Swisdak, Drake, Shay and McIlhargey2005; Zenitani et al. Reference Zenitani, Hesse, Klimas and Kuznetsova2011; Le et al. Reference Le, Egedal, Ohia, Daughton, Karimabadi and Lukin2013) and magnetospheric missions (Torbert et al. Reference Torbert, Burch, Giles, Gershman, Pollock, Dorelli, Avanov, Argall, Shuster and Strangeway2016; Shuster et al. Reference Shuster, Gershman, Chen, Wang, Bessho, Dorelli, da Silva, Giles, Paterson and Denton2019). Studies of energy partition (Yamada et al. Reference Yamada, Yoo, Jara-Almonte, Ji, Kulsrud and Myers2014, Reference Yamada, Yoo, Jara-Almonte, Daughton, Ji, Kulsrud and Myers2015, Reference Yamada, Yoo and Zenitani2016) were also consistent with Cluster observations in the magnetotail. Dorfman et al. (Reference Dorfman, Ji, Yamada, Yoo, Lawrence, Myers and Tharp2013) identified with MRX an impulsive, local, three-dimensional reconnection, driven locally by out-of-plane gradients through the Hall term. They observed the dissipation region adjusts to produce impulsive behaviour. Recent studies on energy transfer in different guide field configurations have been carried out with MRX, supported by Kinetic simulations (Fox et al. Reference Fox, Wilder, Eriksson, Jara-Almonte, Pucci, Yoo, Ji, Yamada, Ergun, Øieroset and Phan2018; Pucci et al. Reference Pucci, Usami, Ji, Guo, Horiuchi, Okamura, Fox, Jara-Almonte, Yamada and Yoo2018), as well as with the Spheromak merging experiments in Tokyo Tanabe et al. (Reference Tanabe, Cao, Tanaka, Ahmadi, Akimitsu, Sawada, Inomoto and Ono2019), and compared with observations from MMS (Eriksson et al. Reference Eriksson, Wilder, Ergun, Schwartz, Cassak, Burch, Chen, Torbert, Phan and Lavraud2016; Wilder et al. Reference Wilder, Ergun, Eriksson, Phan, Burch, Ahmadi, Goodrich, Newman, Trattner and Torbert2017). In Yoo et al. (Reference Yoo, Yamada, Ji, Jara-Almonte, Myers and Chen2014) asymmetric (plasma density and magnetic field strength) current sheets have been reproduced with the MRX apparatus, confirming simulation studies (see, e.g., Pritchett Reference Pritchett2008). MRX has also been used to produce solar-relevant line-tied magnetic flux ropes (Myers et al. Reference Myers, Yamada, Ji, Yoo, Fox, Jara-Almonte, Savcheva and Deluca2015), revealing a previously unknown eruption criterion below which torus-unstable flux ropes fail to erupt.
(a) MRX apparatus and reconnection drive. (b) Measured flow vectors (length represents velocity) of electrons (red arrows) and ions (blue) in the full reconnection plane together with poloidal flux contours (which represent reconnecting field line components projected in the reconnection plane) and out-of-plane field contours; 1 cm vector length stands for  $2\times 10^6\ \textrm {cm}\ \textrm {s}^{-1}$, colour contours represent out-of-plane field strength and green broken lines depict (experimentally identified) separatrix lines. Toroidal symmetry is assumed. (Reprinted with permission from Phys. Plasmas 22, 056501 (2015). Copyright 2015 AIP Publishing LLC.)

Otherwise, reconnection experiments generally aim at probing in situ the three-dimensional magnetic field topology and the related stability and relaxation (Kornack Reference Kornack1998; Matthaeus et al. Reference Matthaeus, Cothran, Landreman and Brown2005), wave generation and propagation at the reconnection region (Yoo et al. Reference Yoo, Jara-Almonte, Yerger, Wang, Qian, Le, Ji, Yamada, Fox and Kim2018). As described previously for MRX, there are also many results for energy partition, temperature anisotropies and particle heating and acceleration (see, e.g., Inomoto et al. Reference Inomoto, Ushiki, Guo, Sugawara, Kondo, Mihara, Minami, Inai, Kaneko and Yanai2019; Usami et al. Reference Usami, Horiuchi, Ohtani, Ono, Inomoto and Tanabe2019). While the results from these studies are an exceptional and fundamental achievement for an exhaustive and deeper knowledge of magnetic reconnection, owing to the intrinsic designs and parameter range achievable, the onset of magnetic reconnection has not been targeted as a main goal.
Recently the FLARE device (Facility for Laboratory Reconnection Experiments; see Ji et al. Reference Ji, Bhattacharjee, Goodman, Prager, Daughton, Cutler, Fox, Hoffmann, Kalish and Kozub2017; Ji Reference Ji2019b) has been constructed and tested at Princeton University with the goal of studying magnetic reconnection over a range of parameters directly relevant to space, solar, astrophysical and fusion plasmas as well as the transition in reconnection properties across differing plasma regimes. The facility consists of a pair of flux cores including toroidal field and poloidal field coils, a guide field coil system, a pair of ohmic heating coils and two pairs of equilibrium field coils Ji (Reference Ji2019c) and can operate three gases ( $\textrm {H}_2,\textrm {D}_2,\textrm {He}$) at different fill pressures. FLARE can access a parameter space beyond MRX, allowing it to investigate new multiple
 $X$-line regimes, such as those described in the reconnection phase diagram (see Ji & Daughton (Reference Ji and Daughton2011), Pucci et al. (Reference Pucci, Velli and Tenerani2017) and also § 3.4 of this review) helping us to understand the role of kinetic effects in reconnection onset. The three-dimensional physics of magnetic reconnection initiation and the role of three-dimensional instability, causing explosive events observed in astrophysical plasmas, can be systematically reproduced and studied, answering fundamental questions about the connection between shocks, turbulence and reconnection onset and development. The role of ‘flux ropes’ in the reconnection onset and solar eruptions (see § 2 for references) can be investigated, suggesting whether a driving mechanism is fundamental or changes the dynamics of magnetic reconnection and/or particle acceleration. In particular, neutral particle heating and acceleration can be studied in the context of partial ionized plasmas, see § 3.5, together with the modification of multiple-scale reconnection by neutral particles, giving insights on the onset of reconnection in partial ionized plasmas. Finally, in the context of astrophysical compact objects, such as pulsars, neutron stars and binary systems (see the next section), FLARE could help study reconnection taking place under extreme conditions, such as intense radiation and strong magnetic fields.
4.3. Comparison with reconnection in astrophysical plasmas
Reconnection is considered to be the energy source underlying flares and outbursts of many kinds. Pulsar wind nebulae (Coroniti Reference Coroniti1990; Kirk & Skjæraasen Reference Kirk and Skjæraasen2003; Uzdensky et al. Reference Uzdensky, Cerutti and Begelman2011) are now believed to be powered by magnetic energy dissipation. This is also the case for primordial galaxy clusters energy release (Schekochihin et al. Reference Schekochihin, Cowley, Kulsrud, Hammett and Sharma2005), jets of active galactic nuclei (Romanova & Lovelace Reference Romanova and Lovelace1992) and energy conversion in GRBs (Thompson Reference Thompson1994; Lyutikov et al. Reference Lyutikov, Pariev and Blandford2003) and accretion disks (Khiali & de Gouveia Dal Pino Reference Khiali and de Gouveia Dal Pino2016). The idea that the mechanisms behind the explosive events mentioned previously and explosive events in the solar corona might be the same stems from the similarity between power-law spectra inferred for these astrophysical environments and solar flares. Galeev, Rosner & Vaiana (Reference Galeev, Rosner and Vaiana1979) first suggested that the observed hard X-ray variability of hot accretion disks surrounding black holes could be due to flares powered by reconnection, whereas Inoue, Totani & Ueda (Reference Inoue, Totani and Ueda2008) provided indirect support of this hypothesis, showing the similarity between the power-law electron spectra inferred for active galactic nuclei and that for solar flares. The bursting activity of soft gamma repeaters (SGRs)Footnote 5 is strongly intermittent, showing a power-law dependence of the number of flares as a function of their energy,  $\textrm {d}N/\textrm {d}E \sim E^{-\alpha }$, with
 $\alpha = 1.66$ and a log-normal distribution of waiting times between flares (GöǧüŞ et al. Reference GöǧüŞ, Woods, Kouveliotou, van Paradijs, Briggs, Duncan and Thompson1999), a statistic identical to that of solar flares. The source for SGRs is most probably a type of magnetar or neutron star. Magnetars, provides the most striking examples of magnetic dissipation in astrophysical environments. These are neutron stars with extremely strong magnetic fields ranging from
 $10^{13}$ to
 $10^{15}$ G. Giant flares (GFs), powered by magnetar magnetic fields, are immense explosions releasing up to
 $10^{46}$ erg in a fraction of a second. This energy is stored in the magnetosphere or in the neutron star crust during the build-up phase. There are two hypotheses for the onset of GF in magnetars. The first considers them to be the result of a sudden untwisting of the internal magnetic field (e.g. Thompson & Duncan Reference Thompson and Duncan2001). Lyutikov (Reference Lyutikov2006) suggested the sudden energy released could be due to the magnetospheric field lines becoming unstable, owing to increasing energy associated with the current-carrying magnetic field. Link (Reference Link2014) argued that mechanisms for both small flares and GFs that rely on the sudden relaxation of the magnetic field of the core are difficult to realize because of the impedance mismatch between the inner region of the star and its magnetosphere. This requires the energy that drives these events to be stored in the magnetosphere just before the flare, meaning that the quasi-periodic oscillations seen in GFs must be excited only by the magnetosphere itself. Interestingly, using the Kepler satellite, Maehara et al. (Reference Maehara, Shibayama, Notsu, Notsu, Nagao, Kusaba, Honda, Nogami and Shibata2012) have revealed the existence of superflares with energy in the range
 $10^{33}\text {--}10^{35}\ \textrm {erg}$ in solar-like stars. Based on this observations Shibata et al. (Reference Shibata, Isobe, Hillier, Choudhuri, Maehara, Ishii, Shibayama, Notsu, Notsu and Nagao2013) found it might be possible for our Sun to develop a sunspot (with a flux of
 $2\times 10^{23}$ G cm
 $^2$) big enough for a
 $10^{34}\ \textrm {erg}$ superflare within one solar cycle (11 years). Although the dynamo mechanism to generate the powering magnetic field itself has not yet been identified unequivocally, this result shows how strongly energetic space and astrophysical phenomena are interconnected.
4.4. Elements of relativistic magnetic reconnection
We would like to briefly discuss here some aspects for modelling magnetic reconnection that must be taken into account when studying astrophysical (often relativistic) plasmas. Though parameters in magnetar magnetospheres are very different from those in space plasmas, the principal difference between the two environments is that magnetar plasma is relativistically strongly magnetized. Kennel & Coroniti (Reference Kennel and Coroniti1984) introduced the magnetization parameter  $\sigma _M$ as the ratio of the magnetic energy density
 $U_B = B^2/8{\rm \pi}$ to the total plasma energy density. In a non-relativistic solar and laboratory plasmas
 $\sigma _M\ll 1$ whereas in magnetar magnetospheres
 $\sigma _M\gg 1$, because of the large value of magnetic field discussed previously. The advantage is that
 $1/\sigma _M\ll 1$ can be used as an expansion parameter in the relativistic MHD equations so that, for example, the limit
 $\sigma _M \rightarrow \infty$ is reminiscent of subsonic incompressible hydrodynamics (Komissarov, Barkov & Lyutikov Reference Komissarov, Barkov and Lyutikov2007). In the high magnetization limit Komissarov et al. (Reference Komissarov, Barkov and Lyutikov2007) confirmed that the growth rate in magnetically dominated regimes coincides with that found earlier for the tearing instability in non-relativistic incompressible MHD. Like in the non-relativistic case, they observed the formation of magnetic islands in the nonlinear phase of the instability. With similar hypotheses, assuming
 $v_A\simeq c$, Del Zanna et al. (Reference Del Zanna, Papini, Landi, Bugli and Bucciantini2016) retrieved the IT regime, achieved for
 $a/L\sim S^{-1/3}$, with modes growing independently of
 $S$ and extremely fast, on only a few light crossing times of the sheet length.
For a complete generalization to the relativistic case, for example, to study reconnection in BH accretion disks, the equations should be expressed in covariant form. Although the ideal Ohm's law can be written (unmodified) fully covariantly (Pegoraro Reference Pegoraro2015), the generalization to the relativistic case of (3.1) requires the definition of the reference frame of the observer (Andersson Reference Andersson2012). In addition, the presence of the strong magnetic fields defined previously makes it necessary to take the resistivity parallel and perpendicular to the magnetic field into account: it becomes necessary to introduce a resistivity tensor (Bekenstein & Oron Reference Bekenstein and Oron1978; Andersson Reference Andersson2012). Zanotti & Dumbser (Reference Zanotti and Dumbser2011) extended the simulations of (Komissarov et al. Reference Komissarov, Barkov and Lyutikov2007) for a non-isotropic resistivity in the case of a SP current sheet, finding that the transition for the SP sheet to become unstable occurs for  $S\ge 10^8$. They also performed simulations with the guide field configuration in combination with the anisotropic Ohm's law, which turned out to be very challenging for the numerical scheme adopted so that high magnetization cases could not be explored (Zanotti & Dumbser Reference Zanotti and Dumbser2011). Uzdensky & Spitkovsky (Reference Uzdensky and Spitkovsky2014), studying the physical conditions in the reconnection layer in pulsar magnetospheres, found that reconnection is dominated by a hierarchical chain of multiple secondary islands/flux ropes, subject to strong synchrotron cooling (and inverse Compton radiation), leading to significant plasma compression. The latter is just an example of how radiation is relevant in the study of magnetic reconnection in strongly magnetized astrophysical plasmas, even if it is beyond the scope of this paper.
4.5. Towards future far observations of magnetic reconnection: time-domain astronomy
Over the past few years, time-domain astronomy has emerged as a valid strategy to extend and deepen the knowledge of many astrophysical sources, providing an understanding of how fundamental physical mechanisms, such as shocks, plasma instability or magnetic reconnection work in the presence of an accretion disk. Time-domain astronomy is the study of the variation of astrophysical signals occurring on short cosmic time scales (from milliseconds up to years) from variable sources such as pulsars, magnetars, GRBs, fast radio bursts and active galactic nuclei. This study can be achieved by means of the high-time-resolution astrophysics, a novel approach for observing such objects with time resolutions down to the nanosecond scale or even shorter.
The temporal variability of an object encodes crucial information about its properties and the physical mechanisms involved. In particular, those that occur on short time scales are generally lost in long exposures as in deep surveys. For this reason, the development of instrumentation with high temporal resolution is useful in various research fields of modern astrophysics. Historically, ultrafast photometry has been the prerogative of astronomy in the radio, X-ray and gamma-ray energy bands. Recently, thanks to the development of solid state devices based on both the Single Photon Avalanche Photodiode (SPAD) and Silicon Photo Multiplier (SiPM) technologies a new observational window on the temporal variability of astrophysical sources has also been opened in the optical band. In this scenario, multi-wavelength fast photometry of accreting compact objects is one of the most powerful tools for studying disk–jet connections in these sources. It puts crucial constraints on the geometry and physical properties of their relativistic jets and on their correlation with the properties of the material reaching the object.
The most promising targets allowing this kind of investigation are the millisecond pulsars (MSPs) in low-mass X-ray binary (LMXB) systems. They are the quickest spinning neutron stars (NSs) known with relatively low magnetic fields ( ${\sim }10^8$ G). Their fast rotation is reached through a 0.1–1 Gyr-long X-ray bright phase during which they are spun up by disk accretion of the matter transferred by a low-mass companion star in a binary system (Alpar et al. Reference Alpar, Cheng, Ruderman and Shaham1982). When the mass transfer is reduced or finally stops, a radio pulsar powered by the rotation of its magnetic dipole turns on. In 2013, Papitto et al. (Reference Papitto, Ferrigno, Bozzo, Rea, Pavan, Burderi, Burgay, Campana, di Salvo and Falanga2013) discovered a MSP that swings between radio (rotation-powered) pulsar and X-ray (accretion-powered) pulsar over time scales less then a couple of weeks as the response to variations of the mass accretion rate (de Martino et al. Reference de Martino, Falanga, Bonnet-Bidaud, Belloni, Mouchet, Masetti, Andruchow, Cellone, Mukai and Matt2010; Papitto et al. Reference Papitto, Ferrigno, Bozzo, Rea, Pavan, Burderi, Burgay, Campana, di Salvo and Falanga2013). These objects, called ‘transitional’ MSPs, are considered the missing link between the radio and X-ray behaviours. They are very useful to study the interplay between an accretion disk and the pulsar wind (e.g.Papitto, Torres & Li Reference Papitto, Torres and Li2014; Papitto & Torres Reference Papitto and Torres2015; Campana et al. Reference Campana, Coti Zelati, Papitto, Rea, Torres, Baglio and D'Avanzo2016). By means of optical fast photometry, Ambrosino et al. (Reference Ambrosino, Papitto, Stella, Meddi, Cretaro, Burderi, Di Salvo, Israel, Ghedina and Di Fabrizio2017) discovered optical pulsations from one of these transitional MSPs (PSR J1023
 $+$0038, Ambrosino et al. Reference Ambrosino, Papitto, Stella, Meddi, Cretaro, Burderi, Di Salvo, Israel, Ghedina and Di Fabrizio2017) simultaneously and almost in phase with X-ray pulsations (Papitto et al. Reference Papitto, Ambrosino, Stella, Torres, Coti Zelati, Ghedina, Meddi, Sanna, Casella and Dallilar2019). In addition, the detection of optical pulsations from the accreting MSPs, SAX J1808.4
 $-$3658, during its 2019 outburst (Ambrosino et al., 2020, private communications) confirmed that optical MSPs are far more common than expected. Synchro-curvature radiation (Torres Reference Torres2018) in the pulsar magnetosphere (or in an external region adjacent to it) or striped wind (Coroniti Reference Coroniti1990) model driving synchrotron emission have been proposed to explain the optical pulsed emission. Optical pulses challenge the current paradigm on the pulsar/disk interaction. They indicate that low mass accretion rates drive unexpected outcomes, such as a mini-pulsar wind nebula (Papitto et al. Reference Papitto, Ambrosino, Stella, Torres, Coti Zelati, Ghedina, Meddi, Sanna, Casella and Dallilar2019). Moreover, the magnetic fields of neutron stars and the time scale of the transitions between the emission due to the accretion and rotation of the magnetic dipole can be measured directly. It is also possible to study phase advances/delays in the light curves of these objects, confirming that the physical process driving both X-ray and optical pulsations is common but coming from slightly different regions of the neutron star or its magnetosphere.
As discussed at the beginning of this section, space and astrophysical plasmas are a natural laboratory in which the onset of reconnection can be probed and studied. Even if the detection methods are very different from each other, it is fundamental to gather information to make a comparative study of all of the mechanism involved for the energy storage and trigger of this physical phenomenon.
4.6. An example of how the onset of reconnection in thin current sheets could change the energy conversion and particle acceleration
Primary reconnection sites evolve due to current sheet collapse, island merging and secondary modes growth (Drake, Swisdak & Che Reference Drake, Swisdak and Che2006; Landi et al. Reference Landi, Del Zanna, Papini, Pucci and Velli2015; Tenerani et al. Reference Tenerani, Rappazzo, Velli and Pucci2015a; Shi et al. Reference Shi, Velli and Tenerani2018). This dynamics inspired Shibata & Tanuma (Reference Shibata and Tanuma2001) to develop the fractal tearing reconnection scenario. They showed that the current sheet tends to have a recursive behaviour: the current sheet collapses originating secondary tearing reconnection sites; these thin themselves, transferring energy down to smaller scales, through a self-similar process. (Tenerani et al. Reference Tenerani, Rappazzo, Velli and Pucci2015a) showed indeed that the magnetic field profile of the secondary tearing is the same as the primary one, over the rescaled current sheet thickness. In a resistive MHD frame, they verified the triggering condition for the secondary current sheet generation is still satisfied by the IT condition. They also empirically measured the relationship between two consecutive recursive layers, finding that the inverse aspect ratio  $a_n/L_n$ of the
 $n$th recursive step of the reconnection process, corresponds to the size of the inner resistive layer
 $\delta _{n-1}/L_{n-1}$ of the
 $(n-1)$th step. A generalization of this result in the fractal reconnection context has been provided in Singh et al. (Reference Singh, Pucci, Tenerani, Shibata, Hillier and Velli2019). The latter gives examples of a multiple reconnection events, calculating the time it takes to reach to the
 $n$th step and providing the number of island that, assuming the model is valid, should be present at a specific reconnection stage. Different models lead to order of magnitude differences in the number of islands, already at the secondary reconnection stage.
Although this result is valid in the resistive MHD framework it suggests the physics of primary and secondary reconnection onset is very important because, as we know from kinetic simulations, islands play a fundamental role as particle accelerators. Drake et al. (Reference Drake, Swisdak and Che2006) performing full PIC simulations with the p3d code, showed that electrons gain kinetic energy by reflecting from the ends of the contracting magnetic islands, that form as a result of recursive reconnection processes and island dynamics itself. The resultant electron energy spectra show indices that agree with the Wind satellite observations in the magnetosphere. More recent three-dimensional implicit PIC (iPIC3D) simulations by Zhou et al. (Reference Zhou, El-Alaoui, Lapenta, Berchem, Richard, Schriver and Walker2018) showed that particles are accelerated thanks to multiple mechanisms: parallel electric fields, betatron, Fermi acceleration and, finally, non-adiabatic acceleration by the perpendicular electric fields. As strong parallel electric fields can be developed at the reconnection location (Wilder et al. Reference Wilder, Ergun, Eriksson, Phan, Burch, Ahmadi, Goodrich, Newman, Trattner and Torbert2017; Fox et al. Reference Fox, Wilder, Eriksson, Jara-Almonte, Pucci, Yoo, Ji, Yamada, Ergun, Øieroset and Phan2018), especially in high-guide-field reconnection (Wilder et al. Reference Wilder, Ergun, Eriksson, Phan, Burch, Ahmadi, Goodrich, Newman, Trattner and Torbert2017; Fox et al. Reference Fox, Wilder, Eriksson, Jara-Almonte, Pucci, Yoo, Ji, Yamada, Ergun, Øieroset and Phan2018; Pucci et al. Reference Pucci, Usami, Ji, Guo, Horiuchi, Okamura, Fox, Jara-Almonte, Yamada and Yoo2018), particles going through multiple reconnection sites can be accelerated up to suprathermal energies. Petropoulou & Sironi (Reference Petropoulou and Sironi2018) generalized this idea to relativistic plasmas scenario. They were able to overcome the energy cutoff for suprathermal particles energy gain, assuming the magnetic moment of particles is conserved and particles are strongly accelerated by the island dynamics.
In conclusion, particle energization is strongly affected by the number of islands and their dynamics at each reconnection stage, so capturing the correct reconnection onset and dynamics is fundamental beyond the primary linear reconnection stage, and it is of interest of space, laboratory up to astrophysical relativistic plasmas.
5. Summary and conclusions
In this review, we have discussed the physical mechanisms that pave the way to magnetic reconnection onset and the possible trigger mechanisms in the context of laboratory, space and astrophysical plasma dynamics. Though much progress has been made, claims that the onset problem has been solved appear to be premature. It is clear that the trigger must rely on current sheets shrinking to small enough thicknesses, such that their aspect ratio is small enough or their dimensions become comparable to kinetic scales. It could be that there is no universal trigger mechanism, even within a well-defined approximation of the plasma dynamics, that is, reconnection onset might be at the whim of the chaotic behaviour of the driver in both laboratory and natural plasmas. For the corona, this might entail the location and orientation of emerging magnetic fields, or the amplitude of density or other fluctuations in a specific time or place. Similarly, for the magnetosphere, noise or perturbations driven by the solar wind might initiate the tail collapse. Nonetheless, the search for a basic understanding of the triggering process remains worthwhile, even if universality is beyond reach.
We have described the basic current understanding of possible triggers. The subject of magnetic reconnection is immense, and we have left out a number of important topics. We refer the reader to the book edited by Gonzalez & Parker (Reference Gonzalez and Parker2016), for many of these. One topic we have only mentioned in passing is the role turbulence may play in magnetic reconnection, and vice versa, the role that reconnection may play in initiating or modifying specific turbulence regimes. As for the first subject, we refer to Matthaeus & Velli (Reference Matthaeus and Velli2011) and for a different point of view to Lazarian et al. (Reference Lazarian, Eyink and Vishniac2012). For the second topic, the realization that thin current sheets could reconnect on fast, ideal timescales, has lead to applications of the ideas espoused in Pucci & Velli (Reference Pucci and Velli2014) to ongoing turbulent cascades. In Mallet et al. (Reference Mallet, Schekochihin and Chandran2017) and Loureiro & Boldyrev (Reference Loureiro and Boldyrev2020) (and references therein) the anisotropy of cascading eddies increases as the energy transfer marches to smaller scales, until current sheets form, whose tearing growth rate might be comparable to the nonlinear cascade time: the effects of the tearing of turbulent eddies alters the slope of turbulence inertial range spectra at higher wave numbers. On the other hand, the turbulence consequences of the self-similar current sheet collapse starting from a laminar configuration have been presented in Uzdensky, Loureiro & Schekochihin (Reference Uzdensky, Loureiro and Schekochihin2010) and Tenerani & Velli (Reference Tenerani and Velli2020).
We conclude by summarizing a few exciting open questions on magnetic reconnection onset. How does driving reconnection change the dynamics of the process itself and the relative plasma energization? Having a prediction from analytical calculation could inform us on how to drive, for example, a simulation or a reconnection experiment, see § 4.2. As discussed in § 4.6, catching the onset of reconnection can give an estimate of the number of islands and energy transfer times in the reconnection process. This kind of knowledge can provide insights and predictions on the particle heating and energization process through understanding of the magnetic field curvature effects, Fermi acceleration and/or multiple transition through reconnection sites. This could also explain non-thermal particle energization. Finally, a complete understanding of the onset problem in space and laboratory plasmas will shed light on astrophysical objects and help in interpreting current and future observations from the far Universe, see § 4.3.
Acknowledgements
We would like to thank K. Genestreti for discussions and insights on the onset of reconnection in the magnetosphere. We would also like to thank M.E. Innocenti and R. Wilder for discussions on kinetic simulations and physics of the AR. M.V. was supported by the NSF-DOE Partnership in Basic Plasma Science and Engineering award No. 1619611 and the NASA Parker Solar Probe Observatory Scientist grant NNX15AF34G. This research was supported in part by the National Science Foundation under Grant No. NSF PHY-1748958. F.A. is grateful for ASI-INAF agreement No. 2017-14-H.0.
Editor William Dorland thanks the referees for their advice in evaluating this article.
Declaration of interests
The authors report no conflict of interest.
Supplementary material
Supplementary material is available at https://doi.org/10.1017/S0022377820001373.