Introduction
According to the 2017 Global Burden of Disease (GBD) Study, 75% of global mortality is attributable to non-communicable diseases (NCDs). Of these, cardiovascular disease (CVD) is the leading cause of mortality and morbidity (GBD 2017 Causes of Death Collaborators, 2018). It is an established fact that uncontrolled hypertension is a risk for CVD (Zhou et al., Reference Zhou, Xi, Zhao, Wang and Veeranki2018). Uncontrolled hypertension can lead to chronic kidney disease (CKD) and hypertensive retinopathy, which results in blindness (Ralston et al., Reference Ralston, Penman, Strachan and Hobson2018). Hypertension has emerged as the single largest contributor to the global burden of mortality. Every year 9.4 million deaths are attributable globally to hypertension (Lim et al., Reference Lim, Vos, Flaxman, Danaei, Shibuya and Adair-Rohani2012; Poulter et al., Reference Poulter, Prabhakaran and Caulfield2015). In the adult population, hypertension is responsible for 92 million Disability Adjusted Life Years (DALYs) (Lawes et al., Reference Lawes, Vander Hoorn and Rodgers2008).
Hypertension disproportionately affects low- and middle-income countries, including countries in South Asia (Danaei et al., Reference Danaei, Finucane, Lin, Singh, Paciorek and Cowan2011; Sarki et al., Reference Sarki, Nduka, Stranges, Kandala and Uthman2015). The economic burden of hypertension in these countries is enormous. A systematic review by Gheorghe et al. (Reference Gheorghe, Griffiths, Murphy, Legido-Quigley, Lamptey and Perel2018) showed that the costs per episode of hypertension and generic CVD were US$500 and US$1500, respectively, in 2018. The annual cost incurred by an acute episode of hypertensive complications (i.e. CVD or stroke) exceeds the total per capita health expenditure (Gheorghe et al., Reference Gheorghe, Griffiths, Murphy, Legido-Quigley, Lamptey and Perel2018). Nepal, a South Asian country, is facing an increasing prevalence of NCDs, including hypertension (Mishra et al., Reference Mishra, Neupane, Bhandari, Khanal and Kallestrup2015). A systematic review and meta-analysis by Huang et al. (Reference Huang, Guo, Karmacharya, Seeruttun, Xu and Hao2019) found the prevalence of hypertension in Nepal to be 27.3%. In order to prevent the increasing burden of hypertension in Nepal, it is essential to identify its risk factors and address them accordingly (Hasan et al., Reference Hasan, Sutradhar, Akter, Das Gupta, Joshi, Haider and Sarker2018).
Previous studies have identified several risk factors for hypertension in Nepal, including older age, male sex, higher body mass index (BMI), higher wealth index and province of residence (Hasan et al., Reference Hasan, Sutradhar, Akter, Das Gupta, Joshi, Haider and Sarker2018; Das Gupta et al., Reference Das Gupta, Bin Zaman, Wagle, Crispen, Hashan and Al Kibria2019a). Other studies in Nepal have further identified short stature, alcohol intake, having diabetes mellitus and family history of hypertension as risk factors for hypertension (Neupane et al., Reference Neupane, Shrestha, Mishra, Bloch, Christensen and McLachlan2017). However, several methods to identify the associated factors of hypertension have not yet been explored. This study aimed to determine the associated factors of hypertension in Nepal using two methods together and compare the estimates generated through the two methods. The findings should help policymakers and public health managers in Nepal plan effective hypertension prevention and control strategies.
Methods
Data source and study design
This cross-sectional study was a secondary analysis of nationally representative Nepal Demographic and Health Survey (NDHS) 2016 data. The aim of this survey was to update demographic and health information for Nepal. It was implemented by NEW ERA under the supervision of the Ministry of Health, Nepal. A full description of NDHS 2016, including findings, methodology, sample size calculation and questionnaire, has been published previously (Ministry of Health et al., 2017).
Data were collected using stratified cluster sampling of households. Two-staged and three-staged sampling methods were used in rural and urban areas, respectively. Initially, primary sampling units (PSUs) were identified in rural areas using the probability proportional to size method. From each PSU, thirty households were selected. Similarly, PSUs were identified in urban areas. During the second stage, enumeration areas (EAs) were selected from each PSU. Finally, households were then selected from each EA. In total, 11,490 households (5520 urban and 5970 rural) were included (Ministry of Health Nepal et al., 2017).
Outcome variable
Hypertension in the adult population of Nepal (i.e. those aged ≥18 years) was the outcome of interest. Blood pressure (BP) was measured using UA-767F/FAC (A&D Medical) blood pressure monitors. The cuff size (small, medium, or large) was adjusted according to the arm circumference. Blood pressure was measured three times for each participant. There was a five-minute interval between each reading. The first reading was discarded and the average of the second and the third readings was considered as the BP of the respondent (Ministry of Health Nepal et al., 2017). The Joint National Committee Seven (JNC7) guideline’s cut-off was used to define hypertension. If the respondent had a systolic blood pressure (SBP) of ≥140 mmHg and/or a diastolic blood pressure (DBP) of ≥90 mmHg, then that person was considered hypertensive. An individual taking antihypertensive medications, regardless of measured BP, at the time of the survey was also defined as hypertensive (Chobanian et al., Reference Chobanian, Bakris, Black, Cushman, Green and Izzo2003).
Independent variables
Based on a literature review, the following potential explanatory variables were considered: age (18–29 years, 30–49 years, 50–69 years and ≥70 years); sex (male and female); body mass index (BMI) (presence and absence of overweight/obesity); education (no formal education, primary and secondary education and above); household wealth index (poorest, poor, middle, rich and richest); place of residence (urban and rural); province of residence (Provinces 1 to 7); and ecological region of residence (Terai, Hills and Mountains). Overweight/obesity was defined as having a BMI of ≥25 kg/m2 (WHO Expert Consultation, 2004). Household wealth index (on a continuous scale) was calculated based on principal component analysis of selected assets, i.e. type of construction material used for roof and flooring, type of water source, status of sanitation facilities, electricity and other belongings (e.g. television, bicycle). Then, it was divided into quintiles (Ministry of Health Nepal et al., 2017).
Statistical analysis
At first, descriptive analysis was carried out. The findings were presented through frequencies (n) and percentages (%). Previous studies have estimated the factors associated with hypertension in Nepal using odds ratios (ORs) (Hasan et al., Reference Hasan, Sutradhar, Akter, Das Gupta, Joshi, Haider and Sarker2018; Kibria et al., Reference Kibria, Swasey, Sharmeen, Sakib and Burrowes2018; Das Gupta et al., Reference Das Gupta, Bin Zaman, Wagle, Crispen, Hashan and Al Kibria2019a, b). The prevalence ratio (PR) – another measure with a multiplicative scale – has been used in previous cross-sectional studies instead of relative risk/risk ratios (Zocchetti et al., Reference Zocchetti, Consonni and Bertazzi1997; Tamhane et al., Reference Tamhane, Westfall, Burkholder and Cutter2017). Compared with the PR, the OR tends to overestimate the magnitude of association (Zocchetti et al., Reference Zocchetti, Consonni and Bertazzi1997; Tamhane et al., Reference Tamhane, Westfall, Burkholder and Cutter2017; Swasey et al., Reference Swasey, Gupta, Nayeem and Kibria2019) and generates a wider confidence interval (CI), leading to less-precise estimates (Zocchetti et al., Reference Zocchetti, Consonni and Bertazzi1997). Furthermore, the PR is easier to interpret than the OR. Therefore, this study estimated both PRs and ORs to identify the associated factors. The PRs and ORs were obtained using log-binomial and logistic regression, respectively. The ratios were reported with 95% CI. Then, unadjusted PRs and ORs were obtained. The variables yielding a significance level below 0.2 in the bivariate (i.e. unadjusted) analysis were included in the final multivariable analysis and were considered sufficient to adjust for residual confounding (Maldonado & Greenland, Reference Maldonado and Greenland1993). The variance inflation factor was used to check for the existence of multicollinearity among the independent variables, and no multicollinearity was found. The sample weight of NDHS 2016 and the cluster effect was adjusted during the analysis. All analyses were carried out using Stata 14.0 (College Station, TX, USA).
Results
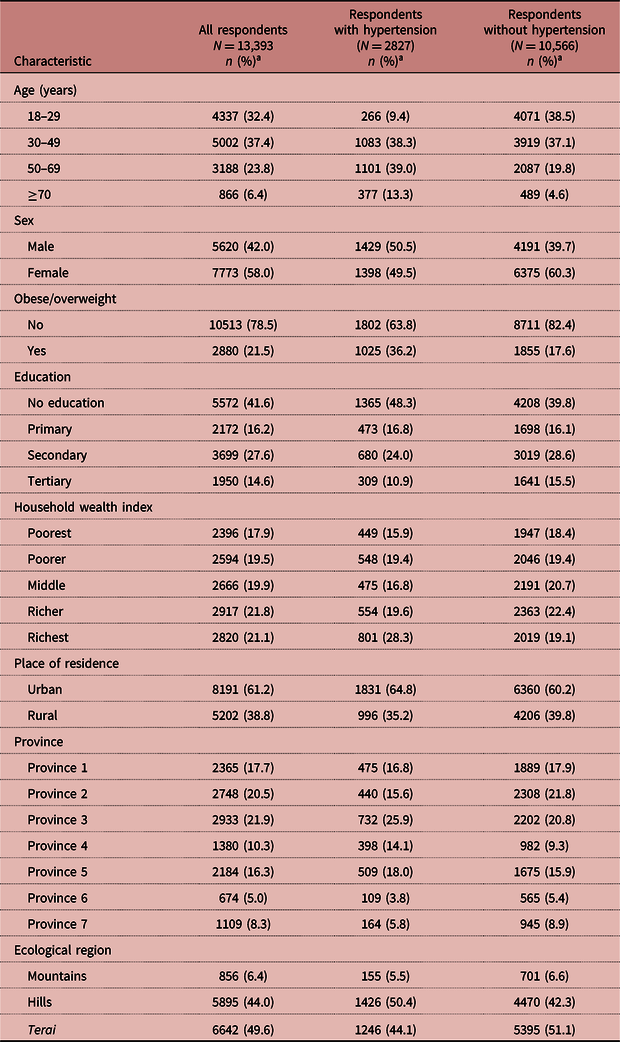
Table 1 describes the study sample by the presence of hypertension. A total of 13,393 participants were included in the analyses. The overall prevalence of hypertension was 21.1% (n = 2827). A higher proportion of hypertensive people belonged to the older age groups than the overall sample. The proportion of female respondents was higher in the overall sample (58%); however, there was an almost equal distribution of males and females among the hypertensives. More than one-fifth of the Nepalese (21.5%) were found to be overweight/obese. The proportion of respondents in the richest wealth quintile was higher among hypertensive people (28.3%) than the overall sample (21.1%) or people without hypertension (19.1%). Nearly two-thirds (61.2%) of respondents were from urban areas. About half (49.6%) were from the Terai region, 44% belonged to the Hills and the rest (6.4%) were from the Mountains.
Distribution of respondents by blood pressure status

a Column percentages.
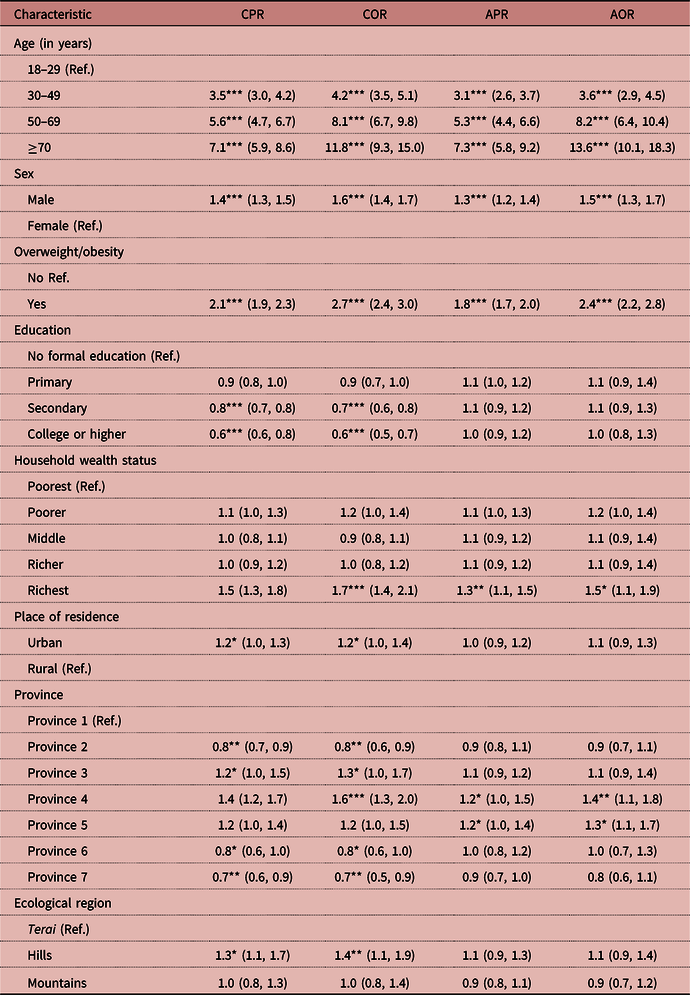
The crude and adjusted PR and OR estimates are reported in Table 2. Adjustment for covariates led to the loss of statistical significance of the association between hypertension and some of its potential correlates, such as education to secondary and tertiary level, residence in urban setting, residence in Province 2, Province 3 (officially Bagmati Pradesh), Province 6 (officially Karnali Pradesh) and Province 7 (officially Sudurpashchim Pradesh) and inhabitancy in the Hills. Only the adjusted measures are given here. Compared with the 18–29 years age group, the older age groups had both higher prevalence and higher odds of having hypertension. The PR for the ≥70 years age group was the highest of all (APR: 7.3, 95% CI: 5.8, 9.2), as was the OR (AOR: 13.6, 95% CI: 10.1, 18.3). Males’ prevalence and odds of having hypertension were higher than females’ (APR: 1.3, 95% CI: 1.2, 1.4; AOR: 1.5, 95% CI: 1.3, 1.7). Overweight/obese individuals had a higher prevalence and odds of having hypertension, compared with those who were not overweight/obese (APR: 1.8, 95% CI: 1.7, 2.0; AOR: 2.4, 95% CI: 2.2, 2.8). In terms of wealth status, compared with that of the poorest, the richest quintile had a higher prevalence and odds of having hypertension (APR: 1.3, 95% CI: 1.1, 1.5; AOR: 1.5, 95% CI: 1.1, 1.9). When compared with Province 1, inhabitants of Province 4 (officially Gandaki Province) (APR: 1.2, 95% CI: 1.0, 1.5; AOR: 1.4, 95% CI: 1.1, 1.8) and Province 5 (APR: 1.2, 95% CI: 1.1, 1.4; AOR: 1.3, 95% CI: 1.1, 1.7) were found to have a higher prevalence and odds of getting hypertension.
Crude and adjusted PR and OR (95% CI) estimates by respondent background characteristics

CPR: Crude Prevalence Ratio; COR: Crude Odds Ratio; APR: Adjusted Prevalence Ratio; AOR: Adjusted Odds Ratio; CI: Confidence Interval.
*p <0.05; **p <0.01; ***p <0.001.
Discussion
This study aimed to identify the factors associated with hypertension in Nepal using ORs and PRs. In the final model, age, sex, overweight/obesity, wealth index and province of residence were found to be significantly associated with hypertension. The associated factors that were found to be significant using PRs were also found to be significant using ORs; however, the magnitude of association was different. As seen in previous literature, ORs have overestimated the association for many variables (Zocchetti et al., Reference Zocchetti, Consonni and Bertazzi1997; Tamhane et al., Reference Tamhane, Westfall, Burkholder and Cutter2017; Swasey et al., Reference Swasey, Gupta, Nayeem and Kibria2019).
The prevalence and odds of hypertension were higher among older than younger people in the study. Age is a non-modifiable risk factor for hypertension. With ageing, structural changes in the cardiovascular system (i.e. atherosclerosis) occur (Lee et al., Reference Lee, Kim, Sunwoo and Huh2005). Other co-morbidities such as diabetes mellitus increase the risk of hypertension in the elderly population (Fleg & Strait, Reference Fleg and Strait2012). The burden of hypertension will probably increase in Nepal in the future due to the predicted increase in the size of the elderly population (Feeney et al., Reference Feeney, Thapa and Sharma2001). The elderly should be targeted by hypertension screening and control programmes. Like age, sex is a non-modifiable risk factor for hypertension (Sandberg & Ji, Reference Sandberg and Ji2012). Male respondents had higher prevalence and odds of having hypertension in the present study. This is a similar finding to previous studies (Chow et al., Reference Chow, Teo, Rangarajan, Islam, Gupta and Avezum2013; Ghosh et al., Reference Ghosh, Mukhopadhyay and Barik2016). Due to the absence of endogenous oestradiol, sex differences in T-cells and difference in the renin–angiotensin system from females, males are more prone to developing hypertension (Ashraf & Vongpatanasin, Reference Ashraf and Vongpatanasin2006; Gillis & Sullivan, Reference Gillis and Sullivan2016). Public health programmes should focus on raising awareness among males for the prevention and control of hypertension.
The presence of overweight/obesity increases the likelihood of having hypertension. Overweight/obesity is a known risk factor for hypertension. It also predisposes an individual to developing diabetes mellitus and chronic kidney disease, which in turn increase the risk of hypertension (Kovesdy et al., Reference Kovesdy, Furth and Zoccali2017). Nepal is currently undergoing a nutritional transition and the prevalence of overweight/obesity in the country is increasing (Subedi et al., Reference Subedi, Marais and Newlands2017). The burden of hypertension is likely to increase in the future if this overweight/obesity epidemic cannot be addressed. Moreover, the factors associated with overweight/obesity have been found to be similar to those associated with hypertension, so a comprehensive approach targeting the two conditions together would be helpful (Kibria, Reference Kibria2019).
Although ecological setting and settlement (i.e. urban–rural) were not found to have a statistically significant association with hypertension, two provinces (Province 4 [officially known as ‘Gandaki Pradesh] and Province 5), in particular, had higher prevalences and odds of hypertension compared with the rest. This is consistent with several studies conducted previously in Nepal (Das Gupta et al., Reference Das Gupta, Bin Zaman, Wagle, Crispen, Hashan and Al Kibria2019a, b), and in other countries (Devi et al., Reference Devi, Rao, Sigamani, Faruqui, Jose and Gupta2013; Anchala et al., Reference Anchala, Kannuri, Pant, Khan, Franco, Di Angelantonio and Prabhakaran2014; Harshfield et al., Reference Harshfield, Chowdhury, Harhay, Bergquist and Harhay2015; Meshram et al., Reference Meshram, Vishnu Vardhana Rao, Sudershan Rao, Laxmaiah and Polasa2016), where similar provincial differences in health status are thought to be attributable, mainly, to dietary and socioeconomic differences. Furthermore, marked differences have also been observed across different regions of Nepal in terms of health care facilities and accessibility of these (Nawal & Goli, Reference Nawal and Goli2013a, b). The potential causal association of such differences, however, was beyond the scope of this study, and further research on this is recommended.
In terms of wealth status, Nepal adults in the richest quintile had higher prevalence and odds of developing hypertension when compared with the poorest quintile. One possible explanation for this correlation could be the similar correlation between increased income and sedentariness, as well as an over-reliance on high-calorie processed food (Reddy et al., Reference Reddy, Naik and Prabhakaran2006). Therefore, the higher-income strata should be targeted for lifestyle interventions to address this problem. Nevertheless, in the long run, people living in poverty should also be made aware, since with further epidemiological transition, people in the lower wealth quintiles may also be affected by hypertension (Busingye et al., Reference Busingye, Arabshahi, Subasinghe, Evans, Riddell and Thrift2014), even though it was not evident in this particular analysis.
Some limitations could have potentially biased the findings of this study. Although three blood pressure measurements were recorded, all were done in a single visit within a five-minute interval, hence breaching the recommended longitudinal assessment guidelines (Chobanian et al., Reference Chobanian, Bakris, Black, Cushman, Green and Izzo2003). Moreover, the analysed dataset lacked information about some potentially important behavioural and lifestyle-related risk factors for hypertension, such as level of physical activity, dietary habits (including salt intake), intake of tobacco and alcohol and familial history of hypertension. Adjusting for these covariates could have yielded more-robust evidence of association between hypertension and its sociodemographic correlates. This was a cross-sectional study and therefore the identified factors may not be causally associated. Nevertheless, the randomness of the sampling technique employed to select the study subjects, and representation of the sampling frame in urban/rural, regional and zonal levels of Nepal, make the study findings potentially generalizable to the entire over-18 Nepalese population. Furthermore, since the NDHS 2016 survey used reliable and standard measurement techniques, it may well have succeeded in reducing systematic measurement errors. This study did not consider several potential interactions and mediations that were beyond the scope of the present analysis; however, future studies should investigate these relationships.
To conclude, this study found that among Nepalese adults, increasing age, male sex, being overweight/obese, being in the richest wealth quintile and residence in Provinces 4 and 5 were associated with an increased likelihood of being hypertensive. The factors obtained by the logistic regression method were also found to be significant using a more conservative method. The findings of this study indicate that prevention and control programmes should focus more on these factors and target individuals with a higher prevalence and odds of hypertension: older people, males, those of higher wealth status and those residing in certain administrative provinces of Nepal (Province 4 and 5).
Acknowledgments
The authors are grateful to the DHS programme for allowing access to the Nepal Demographic Health Survey (NDHS) 2016 datasets.
Funding
This research received no specific grant from any funding agency, commercial entity, or not-for-profit organization.
Conflicts of Interest
The authors have no conflicts of interest to declare.
Ethical approval
The ethical review board of the Nepal Research Council and ICF International approved the protocol of NDHS 2016. Verbal informed consent was taken from the respondents before interview and BP measurement (Ministry of Health Nepal et al., 2017).